SECURITIES AND EXCHANGE COMMISSION
Washington, D.C. 20549
FORM 6-K
Report of Foreign Private Issuer
Pursuant to Rule 13a-16 or 15d-16 of the
Securities Exchange Act of 1934
For the month of February, 2024
Commission File Number 1-14668
COMPANHIA PARANAENSE DE ENERGIA
(Exact name of registrant as specified in its
charter)
Energy Company of Paraná
(Translation of Registrant's name into English)
José Izidoro Biazetto, 158
81200-240 Curitiba, Paraná
Federative Republic of Brazil
+55 (41) 3331-4011
(Address of principal executive offices)
Indicate by check
mark whether the registrant files or will file annual reports under cover Form 20-F or Form 40-F. Form
20-F ___X___ Form 40-F _______
Indicate
by check mark whether the registrant by furnishing the information contained in this Form is also thereby furnishing the information
to the Commission pursuant to Rule 12g3-2(b) under the Securities Exchange Act of 1934.
Yes _______ No ___X____


4Q23 Highlights
| § | Record
adjusted EBITDA1 of R$ 5.8 billion in 2023 (+5.6% vs 2022) and R$ 1.5 billion in 4Q23 (+4.6% vs 2022) |
| § | Net
Income 1 of R$ 943 million in 4Q23 (+51.1% vs 4Q22) and R$ 2.3 billion in 2023 (+102.5% vs. 2022) |
| § | Operating Cash Generation of R$ 1.5 billion in 4Q23 |
| § | Supplementary
dividend proposal of R$ 131.0 million, total of R$ 1.1 billion – Payout of 50% |
| § | Copel
Distribuição’s Regulatory efficiency of 28% adjusted LTM |
| § | UEGA’s
Divestment – signning of CCVA |
| § | Included in MSCI Brazil’s composition – world reference to institucional investors |
| § | Procces of undoing the UNITS program finished |
| § | LatinFinance Award - Deal of the Year |
| § | ISE B3 Copel remains in the index in 2024 |
| § | Copel
foward to A- score from CDP |
1 Considers discontinued
operations

Message from the CEO
In 2023, A new journey began to Copel’s history. Our common shares valued in 43%, while preferred shares grew by 36%, bringing the
company to a market value of R$29.8 billion. Throughout the year, we led the company's transformation into a corporation with dispersed
capital and no controlling shareholder (“True Corporation”). Completed in August, it reached the largest follow-on and the
second largest offer in the Utilities sector in the West in 2023, moving R$5.2 billion. Of these, R$3.2 billion refers to the secondary
offer from the State of Paraná and R$2.0 billion to the primary offer, an amount that will be used to pay the grant bonus for the
full renewal of the concessions of the three largest hydroelectric plants of Copel (Foz do Areia, Salto Segredo and Salto Caxias), which
together add up to 4.2 GW of installed capacity (approximately 60% of the Company's total capacity).
This achievement goes beyond the renewal of these fundamental concessions. As a corporation, with a private legal nature, Copel gains
better conditions to operate in the competitive and challenging environment of the electricity sector, with efficiency gains and the real
possibility of leveraging investment conditions. We combine Copel's 69-year history of contributions to the national electricity sector
with a more competitive, sustainable and innovative future, contributing to the development of Paraná and Brazil. The success of
the transformation process into a corporation was aligned with the company's other operations. We achieved an adjusted EBITDA of R$5.8
billion and a net income of R$2.3 billion, an increase of 102% compared to the previous year. In 2023, we made the largest investment
in the history of Copel Distribuição with an investment of R$2 billion for the modernization, expansion and automation of
Paraná's electrical infrastructure. Thus, at the end of the year we achieved historic efficiency, with adjusted EBITDA exceeding
regulatory EBITDA by 28%.
In a challenging year, faced with a scenario of constant low energy prices, Copel Geração e Transmissão managed to
achieve the enviable amount of R$3.5 billion in adjusted EBITDA in its continuing operations. For the third consecutive year, Copel Mercado
Livre was among the largest traders in the country in terms of energy volume. Faced with the challenge of managing uncontracted energy
from Copel GeT and facing another stage in the expansion of the free market starting in 2024, we restructured our trader and invested
in digitalization and efficiency, integrating and centralizing Copel's energy planning.
Focused on our sustainable agenda, we completed the acquisition of the Aventura and Santa Rosa & Mundo Novo Wind Complexes, with 260.4
MW of installed capacity, and we are about to complete the divestment in the Araucária Gas Power Plant (UEGA) and consolidate a
generator matrix practically 100% renewable. And, in line with the strategy of concentrating our operations in the electricity sector,
we continued with the process of selling our shareholding in Compagas.
Expanding the frontiers of innovation, we created a Corporate Venture Capital fund with a commitment to invest R$150 million over 10 years.
We have already made our first contributions: at Move, a start-up that works with electric mobility and offers electric charger management
solutions.
The constant focus on results and our ability to achieve led Copel to the Morgan Stanley Capital Index (MSCI) seal, an important global
reference index for institutional investors. We also ranked for the 18th time in the corporate sustainability ranking (ISE) and in the
Efficient Carbon Index (ICO2), both from B3.
Finally, I reinforce that in 2024 we will continue on a journey of operational excellence, in the discipline of capital allocation and
execution of our strategic plan. We believe that Copel's integrated operations, with a relevant presence in the Generation, Transmission,
Distribution and Trade business, is one of our great competitive differentiators and will allow the Company to continue generating value
for all stakeholders.
All of this represents, on the eve of the celebration of the company's 70th anniversary, some of the perennial hallmarks of Copel's operations
since its inception: innovation, sustainability, solidity and permanent commitment to the customer.
Daniel Slaviero |
Copel’s CEO
|
RESULTS | 4Q23

List of contents
| 1. Consolidated Results |
2 |
| 1.1 EBITDA |
2 |
| 1.2 Operating Revenue |
3 |
| 1.3 Operational Costs and Expenses |
4 |
| 1.4 Equity in Earnings of Subsidiaries |
6 |
| 1.5 Financial Results |
6 |
| 1.6 Consolidated Net Income |
7 |
| 1.7 Debt |
7 |
| 2. Investment |
9 |
| 2.1 Investment Policy |
9 |
| 2.2 Investment Program |
9 |
| 3. Copel Geração e Transmissão |
10 |
| 3.1 Financial Performance |
10 |
| 3.1.1 IFRS effect in the Transmission segment |
12 |
| 3.2 Operacional Performance |
12 |
| 3.2.1 Generation |
13 |
| 3.2.2 Hydro and Wind Generation |
13 |
| 3.2.3 Thermal Generation |
13 |
| 3.3 Transmission |
14 |
| 3.3.1 RBSE Reprofiling |
14 |
| 4. Copel Distribuição |
15 |
| 4.1 Financial Performance |
15 |
| 4.1.1 Regulatory Efficiency |
16 |
| 4.2 Operational Performance |
17 |
| 4.2.1 Grid Market (TUSD) |
17 |
| 4.2.2 Captive Market |
17 |
| 4.2.3 Concession Agreement |
17 |
| 4.2.4 Investment and Operational Data |
17 |
| 5. Copel Mercado Livre |
20 |
| 5.1 Financial Performance |
20 |
| 5.2 Operational Performance |
21 |
| 6. ESG Performance |
22 |
| 6.1 Copel pioneers in ESG in the sector |
22 |
| 6.2 Recent Highlights |
22 |
| 6.3 Indicators |
23 |
| 6.4 Ratings, Rankings, and Indexes |
24 |
| 7. Other highlights |
25 |
| Exhibit |
29 |
The following analyzes refer to the fourth quarter of 2023 and the
year to date, compared to the same period in 2022.
1.1 EBITDA
Adjusted EBITDA from continuing operations (excluding Compagas and
UEGA, which are in the process of being sold) and excluding non-recurring items, grew 10.1% in 4Q23 (R$1,482.9 compared to R$1,347.0 million
in 4Q22 ) reflecting, above all, the better result of Copel Distribuição (+35.6%). When including the result of discontinued
operations, adjusted EBITDA reached R$1,493.6 million, an amount 4.6% higher than the R$1,427.6 million recorded in 4Q22 and, also, when
excluding the effects of the equity in earnings of subsidiaries (that is, adjusted EBITDA with all operations and without equity in earnings
of subsidiaries) there was an increase of 11.8% (R$1,430.5 million in 4Q23 compared to R$1,279.2 million in 4Q22).
Therefore, the main factors that explain the growth in results in
the quarter are, mainly, (i) the 8.0% growth in the billed grid market, (ii) the tariff adjustment in June 2023, with an average effect
of 6.32% in Tariffs for the Use of the Distribution System (TUSD), and (iii) the increase of 5.4% (+R$8.1 million) in other operating
revenues, mainly because of leases and rentals of equipment and structures and sharing of posts. Also contributing to the result were:
(i) Copel GeT's better performance in the purchase and sale of electricity (+R$50.9 million 4Q23 compared to 4Q22), due to the scenario
of greater hydrology in 4Q23 (average GSF of 83.8%, compared to 77.6% in 4Q22) and the increase in results from the Aventura and Santa
Rosa & Mundo Novo – SRMN Wind Complexes, acquired on January 30, 2023 (+ R$29.1 million in adjusted EBITDA); and (ii) the reversal
of provisions in 4Q23 mainly due to the reversal of R$83.0 million in regulatory litigation within the scope of Copel GeT, effect of Aneel
Order No. 4,758 of December 5, 2023 which deals with the calculation methodology of the Surplus and Deficit Compensation Mechanism (MCSD)[1].
These events were partially offset, above all, by (i) lower remuneration
on transmission agreement assets, mainly due to the periodic tariff review applied to the agreements and lower inflation in the comparison
between periods (IPCA of 1.08% in 4Q23 compared to 1.63% in 4Q22), with a reduction of R$15.9 million in Copel GeT's revenue from use
of the main transmission grid and R$85.3 million in equity in earnings of subsidiaries; and (ii) the reduction of R$30.2 million in revenue
from wind farms[2] due to generation
diversion in the comparison between periods, essentially due to the operational restriction imposed by the ONS (Constrained-off).
Adjusted Consolidated EBITDA

Obs. Considers descontinued operations.
The non-recurring items that were neutralized to calculate adjusted
EBITDA are shown in the following table:
[1]
Due to the renegotiation of the hydrological risk in the ACR in 2016, which extended the validity period
for plants with existing energy in the period from 05/24/2023 to 09/17/2023, Copel GeT, understanding that the amounts originally contracted
in the auctions must be fully rehired, without subsequent reductions caused by the Surplus and Deficit Return Mechanism – MSCD 4%
and monthly, filed a precautionary measure with Aneel, accepted by the agency, to suspend the effects of the MCSD in this process.
[2]
More details in Item 3. Generation and Transmission.
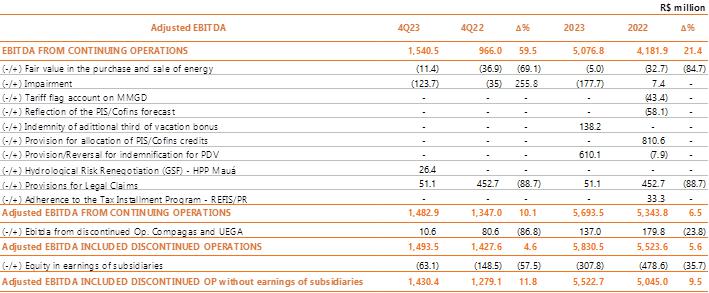
In 4Q23, the following non-recurring items were recorded: (i) the
partial reversal of impairment of generation assets in the amount of R$123.7 million, mainly explained by the reversal of R$105.1 million
relating to HPP Colíder and R$24.1 million referring to HPP Baixo Iguaçu, due to the reevaluation of calculation assumptions
considering a reduction in operating costs and the discount rate (WACC) from 5.71% p.a. to 5.43% p.a. (more details in explanatory note
16.4.1 of the Financial Statements); (ii) the provision for additional litigation in the amount of R$51.1 million, in accordance with
the agreement signed to close the arbitration process (more information in Explanatory Note 40.1 of our Financial Statements); (iii) reversal
of R$26.4 million due to the review of accounting recognition carried out in 3Q23 which dealt with recording the extension of the concession
period for HPP Mauá in intangible assets[3];
and (iv) R$11.4 million referring to the fair value of energy purchase and sale contracts (mark to market) from Copel Mercado Livre, an
amount determined by the difference between the contracted price and the future market price estimated by the Company.
In 2023, adjusted EBITDA from continuing operations (disregarding
Compagas and UEGA, which are in the process of being sold) and excluding non-recurring items, reached R$5,693.4 million, growth of 6.5%
in relation to R $5,343.6 million recorded in 2022. This result is mainly explained by (i) the better performance of Copel Distribuição
with the increase of R$499.2 million in “Parcel B”, essentially due to the increase in the market and tariff adjustments applied
in June 2022 (+16.55%) and June 2023 (+6.32%) in tariffs for the use of the distribution system (TUSD); (ii) the increase in the result
of wind power generation assets, mainly due to the entry into commercial operation of the Jandaíra Wind Complex (+R$42.7 million
in adjusted EBITDA) and the acquisition of the Aventura and SRMN Wind Complexes (+R$109.0 million in adjusted EBITDA); and (iii) the higher
result of Copel Mercado Livre (adjusted EBITDA of R$112.6 million in 2023 compared to R$90.3 million in 2022), mainly due to the improvement
in energy trading margins. These events were partially offset, especially by the decrease in Elejor's results, due to the lower margin
in electricity sales, and by the drop in remuneration on transmission assets of subsidiaries (Costa Oeste, Marumbi and Uirapuru) and jointly
controlled ventures, mainly due to the periodic tariff review applied to the agreements and lower inflation when comparing periods (IPCA
of 4.62% in 2023 compared to 5.79% in 2022).
[3]
Reversal made due to the fact that the exclusion of liability only shifts the plant's concession period in
time, with the extension of the concession period being related to the construction period, i.e., not generating additional revenues correlated
to the asset.
Within the scope of transmission assets, item 3.1.1 presents the
regulatory accounting of results for the purpose of verifying the IFRS (International Financial Reporting Standards) effect.
1.2 Operating Revenue
Net operating revenue from continuing operations totaled R$5,567.7
million in 4Q23, growth of 5.8% compared to the R$5,264.8 million recorded in 4Q22. This result is mainly a reflection of:
| (i) | the increase of R$429.4 million in revenue from electricity sales to final customers, essentially due to the 9.0% growth in the
billed captive market and the tariff adjustment applied to the Energy Tariff (TE) component from the distributor in June 2023, with an
average effect of 17.4%; and |
| (ii) | the increase of R$357.8 million in revenue from use of the main distribution and transmission grid, mainly
due to the 8.0% growth in Copel Distribuição's billed grid market, which considers offset energy from Mini and Micro Distributed
Generation – MMGD and the June 2023 tariff adjustment of Copel Distribuição, with an average effect of an increase
of 6.32% in tariffs for the use of the distribution system (TUSD). |
These increases were partially offset by (i) the reduction of R$376.4
million in the result of sectorial financial assets and liabilities (CVA), due to the drop in energy costs; and (ii) the decrease of
R$117.4 million in revenue from electricity sales to distributors, essentially a consequence of the 17.8% reduction in the amounts of
electricity sold by Copel Mercado Livre through bilateral contracts.
The other variations in operating income were:
| (i) | the increase of R$15.3 million in construction revenue, essentially due to the increase in the volume
of works related to Copel Distribuição's “Transformation” program, which encompasses investments aimed at improving
and modernizing infrastructure and improvements in customer service; and |
| (ii) | the increase of R$8.1 million in the “other operating revenue” line, basically due to higher
income from leasing and rentals by the distributor, with emphasis on the greater volume of sharing of poles/fixing points. |

In 2023, net operating revenue totaled R$21,479.5 million, an increase
of 4.6% compared to the R$20,535.3 million recorded in 2022, with emphasis on the following variations: (i) increase of R$1,173.4 million
(+24.3%) in revenue from “Use of the main distribution and transmission grid”; (ii) increase of R$436.1 million (+5.8%) with
“electricity sales to final customers”; (iii) increase of R$169.7 million (+7.8%) in construction revenue; (iv) growth of
R$99.3 million (+21.5%) in the “other operating revenues” item; (v) reduction of R$705.7 million (-42.1%) in the result of
sectorial financial assets and liabilities; and (v) a drop of R$211.6 million (-5.5%) in revenue from “electricity sales to distributors”.
1.3 Operational Costs and Expenses
In 4Q23, operating costs and expenses from continuing operations
totaled R$4,445.1 million, a reduction of 6.7% compared to the R$4,765.5 million recorded in 4Q22, mainly due to:
| (i) | the reduction of R$603.5 million with “provisions and reversals”, mainly reflecting (a) the
extraordinary event of recording a provision in 4Q22, in the amount of R$452.7 million related to the discussion of a process that it
was in arbitration at the time (more information in Explanatory Note 40.1 of our Financial Statements); (b) the partial reversal of impairment
of generation assets in the amount of R$123.7 million, mainly explained by the reversal of R$105.1 million relating to HPP Colíder
and R$24.1 million relating to HPP Baixo Iguaçu , as a result of the reassessment of assumptions in the calculation of fair value
considering better estimates of revenue from the sale of electricity and reduction in operating costs and discount rate (more details
in explanatory note 16.4.1 in the Financial Statements); and (c) the reversal of R$83.0 million of regulatory litigation within the scope
of Copel GeT, effect of Aneel Order No. 4,758 of December 5, 2023, which deals with the calculation methodology of the Surplus and Deficit
Compensation Mechanism (MCSD ); and |
| (ii) | the drop of R$50.7 million in electricity purchased for resale (-2.4%), basically due to the lower average
price applied to the purchase of electricity and the drop in the volume of electricity purchased by Copel Mercado Livre and Copel GeT,
due to the improvement in the hydrological scenario (average GSF of 83.8%, compared to 77.6% in 4Q22). |
These reductions were partially offset by:
| (i) | the increase of R$ 148.6 million (+23.7%) with “charges for using the electricity grid” justified
mainly by higher costs with transporting energy on the basic grid; and |
| (ii) | the growth of R$ 109.9 million (+16.1%) with manageable costs (PMSO), excluding provisions and
reversals, mainly due to; (a) the Company's best results in 2023 and the performance related to short-term goals, resulting in
greater amounts allocated to the performance bonus (PPD) and profit sharing (PLR), with a record of R$39, 5 million in 4Q23 compared
to a reversal of R$24.1 million in 4Q22; and (b) higher expenses with third-party services (+27.8%), basically due to the increase
in maintenance costs for the electrical system, mainly resulting from the greater number
of interventions in the distribution grid caused by bad weather and rain during the period, in addition to the costs added by the acquisition
of the Aventura and Santa Rosa & Mundo Novo Wind Complexes within the scope of Copel GeT. These events were partially offset by the
21.7% reduction in the item “other costs and expenses”, mainly due to (a) the recovery of taxes, especially related to the
court decision on the Inspection Fee for the Use or Occupation of the Highway Right-of-Way – TFDER (DER/PR) in the amount of R$24.8
million[4], and (b) lower losses related
to the deactivation of assets. |
[4]
This is a sentence relating to the removal of the Inspection Fee for the Use or Occupation of the Highway
Right-of-Way – TFDER, provided for in State Law no. 17,445/2012

Neutralizing the effects of provisions related to PPD and PLR, there
is an increase of 1.1% in the quarterly comparison, despite the effects of ACT 2022/2024 with salary bonus in 4Q23 and salary adjustments
of 7.19% in January and 4.51% in October of the current year. Considering the accumulated inflation measured by the National Consumer
Price Index – INPC, of 3.71% between 4Q22 and 4Q23, there was a reduction in real terms of 2.5%, due to the reduction of 71 employees
in the comparison between periods.

Headcount Evolution

In 2023, total operating costs and expenses reached R$18,092.6 million,
a value 4.9% higher than the R$17,254.6 million recorded in 2022, mainly justified by (i) higher expenses with personnel and management,
due to (a) the provisioning of R$610.1 million in 2023 referring to the Voluntary Dismissal Program (PDV), as per Notice to the Market
23/23, (b) the increase of R$134.0 million in the amount intended for the payment of performance bonuses (PPD) and profit sharing (PLR),
resulting from the Company's best results and performance related to short-term goals, and (c) compensation of R$138.2 million paid in
January 2023 regarding the bonus of the additional third of vacation, after a collective agreement signed with employees; and (ii) the
increase of R$408.7 million with charge of the main distribution and transmission grid, mainly due to the higher costs of transporting
energy on the basic grid. These events were partially offset, especially, by reductions of R$380.7 million in electricity purchased for
resale and R$625.3 million in provisions and reversals.
Considering the impact of the provision for the allocation of PIS
and Cofins credits in 2022 (R$810.6 million), total operating costs and expenses increased by 0.2% (R$18,092.6 million in 2023 compared
to R$18,065.1 million in 2022).
Breakdown of Costs and Expenses

It is worth mentioning that the company, in 2023, changed the method
of accounting for the “monetary update on provisions for litigation” item, which was no longer recorded in the provisions
and reversals line and began to form part of financial expenses. More information in Explanatory Note 28.1 of our Financial Statements.
1.4 Equity in Earnings of Subsidiaries
The equity result of joint ventures and other Copel associates reduced
R$85.3 million compared to that recorded in the same period of the previous year (R$63.1 million, compared to R$148.5 million recorded
in 4Q22), due to the lower remuneration on transmission agreement assets, basically explained by the periodic tariff review applied to
transmission agreements and the lower inflation (IPCA) in 4Q23 (1.08% compared to 1.63% in 4Q22). More details can be seen in Appendix
I.
1.5 Financial Results
In 4Q23, the financial result was a negative R$305.7 million, compared
to a negative R$279.7 million recorded in 4Q22.
Financial expenses registered an increase of R$65.8 million, basically
due to the growth of R$36.0 million in monetary variation and debt charges due to the greater volume of loans and financing (R$15.0 billion
in 4Q23 compared to R$ 12.5 billion in 4Q22) and the greater impact of monetary variation and adjustment to present value on accounts
payable linked to the concession (+R$25.1 million), referring to the UBP (Use of Public Asset) of Elejor. Financial expenses were also
impacted by the voluntary change in the accounting method for the “monetary update on provisions for litigation” item, which
was no longer recorded in the provisions and reversals line and became part of financial expenses. More information in Explanatory Note
28.1 of our Financial Statements.
Financial revenues increased by R$39.9 million, reflecting, above
all, the higher income from investments (+R$64.4 million), essentially due to the greater volume of investments coming from cash resources,
partially offset due to the drop in the remuneration of sectoral financial assets and liabilities (-R$ 41.7 million) within the distributor.

In the 2023 consolidated, excluding the effect of updating the provision
for the allocation of PIS and Cofins credit, the financial result was negative by R$1,205.0 million compared to R$994.6 million recorded
in 2022, essentially justified by the growth of R$284.5 million with monetary variation and debt charges, resulting from the greater volume
of loans and financing.
1.6 Consolidated Net Income
Copel recorded in 4Q23, considering discontinued operations, net
income of R$942.8 million compared to R$623.5 million in 4Q22 (an increase of 51.2%). In addition to the items already mentioned, the
reversal of impairment at UEGA in the amount of R$258.6 million contributed to the growth in results, as a result of the signing of the
share purchase and sale contract – CCVA, according to Material Fact 20/23.
Also noteworthy is the difference of R$627.7 million in income tax
and social contribution, mainly reflecting the recognition of the PIS/COFINS provision in 2022, impacting the result and deferred taxes.

Considering the accumulated result for 2023, the net income recorded,
considering discontinued operations, was R$2,327.2 million compared to R$1,149.3 million recorded in 2022.
1.7 Debt
Copel's total consolidated debt, considering the results of continuing
operations, totaled R$14,962.3 million on December 31, 2023, a variation of 20.1% in relation to the amount recorded on December 31, 2022,
of R$12,454.2 million.
At the end of 2023, the Company's gross debt represented 61.8% of
consolidated net equity, which was R$24,191.7 million.
The following table and graphs demonstrate the indebtedness of Copel
and its subsidiaries at the end of 2023.
Debt by Subsidiary

Adjusted Net Debt/EBITDA Adjusted

Debt Indexers Average cost: 8.72%

Amortization - R$ million Average term to maturity: 4.0 years

Weighted Average Cost and Average term to maturity

Copel's consolidated debt at the end of 2023, considering the 4th
issuance of simple debentures by Compagas in July 2023 in the amount of R$295.0 million, totaled R$15,246.5 million.
2.1 Investment Policy
In March 2021, the Board of Directors approved the Company's Investment
Policy. Said Policy was subject to analysis and approval by the Investment and Innovation Committee, which was established by the new
Bylaws of March 11, 2021, whose main purpose is to improve discipline in the allocation of capital, being an essential tool for the execution
of the strategic guidelines for sustainable growth, generation of value for shareholders and the perpetuity of our energy business.
The Policy establishes the criteria for selecting, prioritizing,
evaluating, approving and monitoring investments. Among the various aspects, the Policy segregates investment opportunities into three
groups that will be prioritized as follows:
| (i) | Operating Investments: expansion of capacity and modernization of the assets of the Distribution, Transmission
and Generation concessions, in addition to the continuity of existing businesses; |
| (ii) | Strategic Investments: acquisition and development of new assets with an emphasis on brownfield opportunities
and that provide operational synergies to the Company. Portfolio review and divestments are included; and |
| (iii) | Investments in Innovation: where we highlight projects aimed at open innovation. |
The Investment and Innovation Committee meets ordinarily once a
month and extraordinarily whenever necessary, analyzing and issuing recommendations for the Company's investment proposals.
2.2 Investment Program
Investment Programs follow their schedules in each development project.
In 2023, the amount realized from the investment program was R$2,252.1 million (99.1% of the forecast), of which R$1,966.5 million was
made by Copel Distribuição, R$240.1 million by Copel Geração e Transmissão, R$40.7 million by Copel
Serviços and R$4.8 million by Copel Holding and Copel Mercado Livre.
The investments made at Copel Distribuição aim to
expand and automate the electrical infrastructure in the concession area, mainly through the “Paraná Trifásico”,
Smart Grid and Total Reliability programs (see item 4.2.4). Of the amount allocated in the year, 95.0% was allocated to investments in
electrical assets, 4.4% to investments in non-electrical assets and 0.6% to other investments.

1 Includes "Transformation" Program composed of the
Paraná Trifásico, Smart Grid and Total Reliability projects.
2 Includes the Facilities Modernization Plan - PMI.
3Includes modernization of COGT (Generation and Transmission Operation
Center), HPP GPS Parigot de Souza, SHPs Marumbi and Uirapuru, Jandaíra Wind Complexes and other projects.
4 Considers innovation plan within the energy sector and aligned
with Copel's investment thesis and ESG practice.
5 Does not consider appropriation of own labor, charges and others,
as well the acquisition of the Aventura and SRMN Wind Complexes in 2023 and the Grant Bonus for the renewal of the Salto Caxias, Segredo
and Foz do Areia HPP concessions, in the amount of R$3.7 billion, scheduled for 2024.
|
3.
Copel Geração e Transmissão
(Consolidated Results) |
| 3.1 Financial Performance |
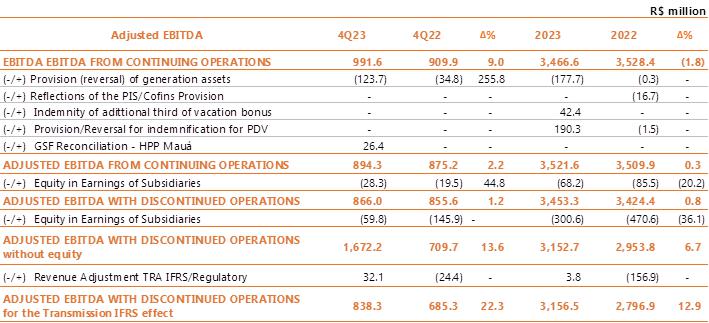
Copel GeT presented an adjusted EBITDA of R$866.0 million considering
the result of the discontinued UEGA operation and excluding non-recurring items, an amount 1.2% higher than the R$855.6 million recorded
in 4Q22, due to, mainly, (a) the reduction of R$96.2 million with provisions and reversals (on a recurring basis), explained, above all,
by the reversal of R$83.0 million in regulatory litigation, in which Aneel accepted, through the Order Aneel No. 4,758 of December 5,
2023, Copel's challenge to the methodology for calculating the Surplus and Deficit Return Mechanism – MCSD[5];
(b) the best result with the purchase and sale of electrical energy (+R$50.9 million), essentially justified by the reduction of R$48.3
million in acquisition costs for electricity purchased for resale, resulting from the more favorable hydrological scenario in 4Q23, with
an average GSF of 83.8%, compared to 77.6% in 4Q22; and (c) addition of R$29.1 million to the result due to the incorporation of the Aventura
and Santa Rosa & Mundo Novo Wind Complexes on January 30, 2023.
This result was partially offset by:
| i. | the reduction of R$30.2 million (R$ 62.0 million in 4Q23 compared to R$31.8 million in 4Q23) in net operating
revenue from wind farms, caused by the diversion of generation resulting from the operational restriction imposed by the ONS (Constrained-off)
in 4Q23. Considering the existing wind farms in both periods[6],
the effect of the generation restriction on revenue was R$27.9 million; |
[5]
Due to the renegotiation of the hydrological risk in the ACR in 2016, which extended the validity period
for plants with existing energy in the period from 05/24/2023 to 09/17/2023, Copel GeT, understanding that the amounts originally contracted
in the auctions must be fully rehired, without the subsequent reductions caused by MSCD 4% and monthly, had filed a precautionary measure
with the agency.
[6]
Considers the wind farms of Cutia, São Bento, Brisa Potiguar, Bento Miguel and Vilas.
| ii. | the lower remuneration on transmission agreement assets, mainly due to the periodic tariff review applied
to the agreements and lower inflation in the comparison between periods (IPCA of 1.08% in 4Q23 compared to 1.63% in 4Q22), with a reduction
of R$15.9 million in Copel GeT's revenue from use of the main transmission grid and R$85.3 million in equity in earnings of subsidiaries.
Item 3.1.1 presents the regulatory accounting of results for the purpose of verifying the IFRS (International Financial Reporting Standards)
effect on transmission assets. |
Regarding non-recurring items for continuing operations in 4Q23,
the following were recorded: (i) the partial reversal of impairment of generation assets in the amount of R$123.7 million, mainly explained
by the reversal of R$105.1 million relating to HPP Colíder and R$24.1 million referring to HPP Baixo Iguaçu, due to the
revaluation of the discount rate, after taxes, to 5.43% p.a. (5.71% p.a. in 2022) and better estimates of revenue from the sale of electricity
and reduction in operating costs (more details in explanatory note 16.4.1 in the Financial Statements); ii) reversal of R$26.4 million,
which had been recorded in intangible assets in 3Q23 relating to the extension of the concession period for HPP Mauá, which had
its accounting recognition reviewed. In the case of the discontinued UEGA operation, the reversal of impairment was recorded (R$258.6
million), as a result of the signing of the CCVA share purchase and sale contract (more details in “Other highlights of the period”
and Note in Explanatory 39 Copel's financial statements);
Expenses with PMSO, excluding provisions and reversals, increased
5.9%, mainly influenced by:
| (i) | increase in “personnel and management” costs of R$21.8 million, justified mainly by the higher
provision for the performance bonus (PPD) and profit sharing (PLR), +R$ 10, 4 million in 4Q23 compared to a reversal of -R$ 6.1 million
in 4Q22; |
| (ii) | increase in expenses with “third party services” by 22.3%, essentially due to the costs of
maintaining wind farms (+R$ 7.0 million), also reflecting the incorporation of the Aventura and Santa Rosa & Mundo Novo Wind Complexes; |
| (iii) | partially offset by the reduction in “Other costs and expenses” by 31.4%, mainly by the reimbursement
of coal through the energy development account (CDE), resulting from the return to operation of TPP Figueira since December 2022 (R $11.8
million). |

Neutralizing the effects of provisions relating to PPD and PLR,
there is an increase of 5.8% in personnel and management costs in the quarterly comparison, mainly due to the effects of ACT 2022/2024
with salary bonus (+R$ 5.2 million) in 4Q23 and salary adjustments of 7.19% in January and 4.51% in October of this year, despite the
reduction of 10 employees. Considering the accumulated inflation measured by the National Consumer Price Index – INPC, of 3.71%
between 4Q22 and 4Q23, there was an increase in real terms of 2.0%.

In 2023, Copel GeT recorded EBITDA of R$3,466.6 with continuing
operations, a decrease of 1.8% compared to 2022, mainly due to provisions for compensation from the voluntary dismissal program and compensation
for the additional third of vacation, partially offset by (a) reversal of the impairment of generation assets, (b) incorporation of new
wind farms (Complexo Jandaíra, Aventura and SRMN), (c) the best result with the purchase and sale of electricity in the year, explained
by better hydrological conditions. Including discontinued operations and disregarding non-recurring effects, adjusted EBITDA was recorded
at R$3,453.3 million, an increase of 0.8%, compared to R$3,424.4 million in the same period of the previous year.
Net income from continuing operations was R$1,634.3 million in 2023,
a reduction of 11.8% compared to 2022. This result mainly reflects the negative financial result in R$ 747.4 million in 2023, compared
to a negative R$ 636.0 million recorded in 2022, resulting from the increase in debt charges, reflecting the greater amount of debentures,
loans and financing, being partially offset by the growth in EBITDA, by the points presented previously. Considering discontinued operations,
net income reached R$1,700.5 million, 6.3% higher than in the previous year, essentially due to the reversal of the UEGA impairment.

3.1.1 IFRS effect in the Transmission segment
For the calculation, an adjustment was made considering the effects
of the application of CPC47/IFRS15 in the corporate statements in the transmission business.

| 3.2 Operacional Performance |
Copel is present in 10 states, operating in the generation and transmission
business.
In the Generation business, Copel GET operates a diversified park
of hydroelectric, wind and thermal plants, totaling 6,966.7 MW of installed capacity and 3,156.6 average MW of assure energy. In the Transmission
business, Copel owns a total grid of 9,685 Km of transmission lines and 53 basic grid substations, considering the affiliates.
For more information on generation and transmission operational
data, see Exhibit IV.

3.2.1 Generation
Copel's generating portfolio is made up of 94% of renewable sources,
such as hydro and wind power.

3.2.2 Hydro and Wind Generation
The energy generation of Copel Geração e Transmissão
S.A. and its wind farms in 2023 was 25,797 GWh (compared to 24,721 GWh in 2022). The increase is mainly due to the entry into commercial
operation of Jandaíra Wind Farm and the acquisition of the Aventura and Santa Rosa & Mundo Novo (SRMN) Wind Complexes.
In the fourth quarter of 2023, Copel Geração e Transmissão's
hydro plants (including HPP Foz do Areia and SHP Bela Vista) recorded 5,600 GWh of electricity sold, an increase of 10.7%, mainly due
to CCEARs resulting from the renegotiation of the GSF.
For wind farms, the total electricity sold in 4Q23 was 1,159 GWh,
an increase of 30.9%, influenced by the acquisition of the Aventura and SRMN Wind Complexes, which became part of the Company's portfolio
on January 30, 2023.

3.2.3 Thermal Generation
TPP Araucária
It is a natural gas generation plant with an installed capacity
of 484.2 MW that operates in a combined cycle (two gas turbines and one steam turbine) and operates in the modality known as "merchant"
in which the plant operates without sales contracts. of electricity, whether in the free (ACL) or regulated (ACR) environment, subject
to fluctuations in the Price for Settlement of Differences - PLD. In this modality, the thermoelectric plant is dispatched centrally by
the National Electric System Operator (ONS), in situations where the Marginal Cost of Operation (CMO) of the electrical system exceeds
its Variable Unit Cost (CVU) approved by ANEEL, or out of order of merit, when requested by the ONS. For TPP Araucária, which is
in the process of being disinvested by Copel, there was no dispatch in 4Q23, due to hydrological conditions.
TPP Figueira
Coal-fired generation plant with an installed capacity of 20 MW,
achieved after a modernization process that allowed an increase in capacity without the need to increase the volume of coal consumed.
TPP Figueira resumed commercial operations on 12/07/2022, by ANEEL order no. 2502/2022. On 10/31/2023, the Company filed a letter with
the Ministry of Mines and Energy requesting the withdrawal of the intention to extend the TPP Figueira concession. Concomitantly, in 4Q23
the plant was unavailable due to the obstruction of one of the coal supply lines, causing no generation in 4Q23. On 02/23/2024, Aneel
decided to suspend commercial operations, more details in “Other highlights”.
In 2023, generation was 40.1 GWh.
GSF and PLD

3.3 Transmission
Copel has more than 9.6 thousand km of transmission lines in eight
Brazilian states, considering its own assets and in partnership with other companies. In addition to building, maintaining and operating
an extensive own energy transmission grid, Copel provides services to projects of other concessionaires with the quality of someone who
has accumulated more than 60 years of experience in the sector. The Transmission projects are listed in Exhibit IV, including the projects
of Copel Geração e Transmissão, SPCs Costa Oeste, Marumbi and Uirapuru Transmissora (100% Copel GeT), as well as
the 7 SPCs in which Copel GeT has a stake.
3.3.1 RBSE Reprofiling
The Concession Agreement 060/2001 represents 42.3% of the annual
permitted revenue (APR) of Copel GET's transmission business, also considering its affiliates. Below, we describe the flow of receipt
of the portion of revenue referring to the Basic Grid - Existing System (RBSE) for the next cycles. It is important to note that this
flow may change in the future, as a result of the tariff review processes and/or review of parameters used to compose these revenues by
the regulatory agent. The values referring to O&M from the 2023-2024 cycle were readjusted by the IPCA.

Note:
Economic component: future values based on the 2023-2024 cycle (according
to REH 3.216/2023 of 06/30/2023)
Financial component: values published in REH 2847/21. Subject to review during
the current cycle in view of the controversy in the methodology used to calculate these values by the regulatory agency.
RAP values up to the 2023-2024 cycle taken from the REH of each cycle, with
reference to the cycle price (June of the year of publication) RAP values include RB and DIT assets
| 4. Copel Distribuição |
| 4.1 Financial Performance |
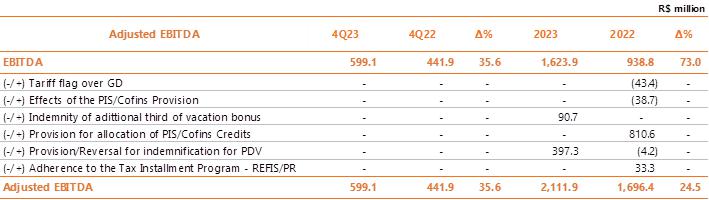
EBITDA in 4Q23 reached R$599.1 million, growth of 35.6%, due to
(i) the 8.0% growth in the billed grid market, mainly due to the high average temperature in the fourth quarter of 2023 (see item 4.2.1);
(ii) the tariff adjustment of June 2023, with an average increase of 6.32% in the Tariffs for the Use of the Distribution System (TUSD);
and (iii) the increase of 41.6% (+R$43.2 million) in other operating revenues, mainly referring to leases and rentals of equipment and
structures and sharing of poles, including fines. In the fourth quarter there were no non-recurring items for adjustment. In the year
to date, excluding the non-recurring effects listed below, adjusted EBITDA increased by 24.5%.
Manageable costs, excluding
provisions and reversals, increased by 17.8% compared to 4Q22, mainly as a result of: (i) the 24.3% increase in expenses with personnel
and management, due to the provision of R$24,6 million for profit sharing (PLR) and performance bonus (PPD) in 4Q23, compared to the reversal
of R$17.4 million in PLR in 4Q22, and (ii) the increase of 23.2% (+R$ 33.2 million) with third-party services, mainly caused by higher
expenses with maintenance of the electrical system, especially the increase in expenses with emergency situations, due to a higher incidence
of storms; partially offset by the 14.0% reduction in other operating costs and expenses, mainly related to the recovery of expenses due
to a court decision in favor of Copel DIS on the non-enforceability of the Inspection Fee for the Use or Occupation of the Highway Right-of-Way
– TFDE/DER and refund of amounts paid in 2013, in the amount of R$ 24.8 million.

The personnel and management
account, excluding the effects of the provision of PDV, PPD and PLR, recorded a reduction of 2.7%, mainly due to the reduction of 54 employees,
despite the effects of ACT 2022/2024 with bonus salary (+R$ 12.8 million) in 4Q23 and salary adjustments of 7.19% in January 2023 and
4.51% in October 2023 of the current year. Considering the accumulated inflation measured by the National Consumer Price Index –
INPC, of 3.71% between 4Q22 and 4Q23, the personnel and management cost line recorded a reduction in real terms of 6.2%.

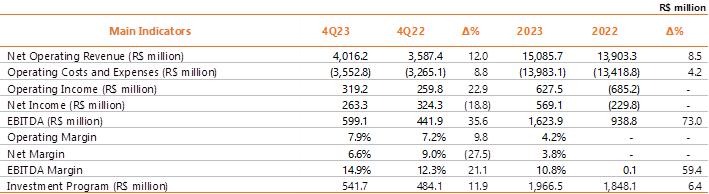
The following table presents the main indicators of Copel Distribuição:
In 4Q23, we also highlight:
| (i) | the 34.2% growth in revenue from Use of the main distribution grid, mainly due to the 8.0% growth in the
billed grid market, which considers offset energy from Mini and Micro Distributed Generation – MMGD, and the tariff adjustment of
June 2023, with an average effect of an increase of 6.32% in the Tariffs for the Use of the Distribution System (TUSD). Also contributing
to this growth was the reduction of R$24.1 million in the Energy Development Account – CDE, a reducing account for the item, which
constitutes a sectoral liability in the CVA to maintain the neutrality of charges for the distributor; |
| (ii) | the 33.6% increase in electricity sales to final customers revenue, due to the +9.0% variation in the
captive market billed in the quarter, valued by the average effect of a 17.4% increase in the Energy Tariff (TE) component in the 2023
tariff adjustment; |
| (iii) | the 61.6% reduction in revenue from electricity sales to distributors, due to lower revenue from energy
settlement in the CCEE Spot Market and revenue from MVE contracts; |
| (iv) | the 80.5% reduction in the sectorial assets and liabilities result, mainly due to lower energy costs in
the period; |
| (v) | the 28.4% increase in costs with charges of main transmission grid, due to higher expenses with: charges
for the use of the Basic Grid (+R$ 102.4 million), given the readjustment of the APR, power transport from Itaipu (+R$34.3 million), given
the increase in the tariff, and System Services Charges – ESS (+R$37.3 million), given the considerable increase in load which,
despite the storage of ten /2023 being better than Dec/2022, required an additional thermal dispatch for the electrical safety of the
system; and |
| (vi) | the 22.1% reduction in provisions and reversals, due to the reversal of provisions for labor, tax, civil
and administrative disputes, partially offset by the 42.5% increase in the provision for doubtful debts, due to the reduction in invoice
recovery, of R$17.1 million in 4Q23 versus R$32.9 million in 4Q22, as a result of the resumption of collection actions by distributors,
interrupted due to the Covid-19 epidemic, and (b ) to the constitution of PCLD of R$33.1 million in 4Q23 compared to R$1.2 million in
4Q22. |
Copel Distribuição's net income was R$263.3 million
in 4Q23 compared to R$324.3 million in 4Q22. In the year, net income was R$569.1 million, result of the better operational performance
of Copel Distribuição, highlighted previously, and higher than the accumulated loss in 2022 of R$229.8 million, due to the
provision for allocation of PIS and Cofins credits and its update.
4.1.1 Regulatory Efficiency
Copel Distribuição recorded an adjusted EBITDA of
R$2,111.9 million in the last 12 months, equivalent to an efficiency of R$461.5 million, 28.0% above regulatory EBITDA.
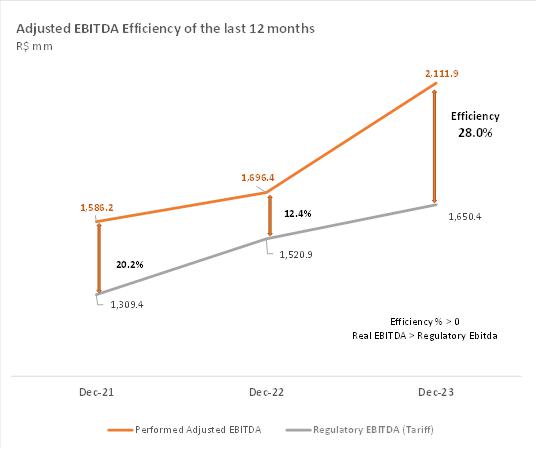
Note: Regulatory EBITDA is calculated based on the WACC
+ QRR values published in ANEEL's Technical Notes in Tariff Revision or Adjustment events.

|
4.2 Operational Performance
4.2.1 Grid Market (TUSD)
Copel Distribuição's grid market, made up of the
captive market, supply to concessionaires and licensees within the State of Paraná and all the free customers existing in its concession
area, had a 10.0% increase in electricity consumption in the 4Q23 compared to the same period of the previous year and 4.0% year-to-date,
mainly due to the high average temperature in the fourth quarter of 2023. The billed grid market, which considers offset energy from Distributed
Mini and Micro Generation – MMGD, increased 8.0% in the quarter and dropped 1.9% in the year, considering the Availability Cost.
4.2.2 Captive Market
The captive market showed an increase of 12.1% in electricity
consumption in the fourth quarter of 2023 and 4.1% for the year. The billed captive market, which considers MMGD offset energy, increased
by 9.0% in the fourth quarter of 2023 and 0.5% in the year. |
4.2.3 Concession Agreement
In December 2015, the Company signed the fifth amendment to the
Public Service Concession Agreement for Electricity Distribution No. 46/1999 of Copel Distribuição SA, which extends the
concession until July 7, 2045. Copel Distribuição complied with the conditioning requirements of economic-financial efficiency
and quality for the inspection cycle of the initial 5 years. From the sixth year after the conclusion of the contract, failure to comply
with the quality criteria for three consecutive years or the economic-financial management criteria for two consecutive years will result
in the opening of the expiry process. For the quality criterion of distribution service provision, ANEEL defined the limits of Equivalent
Interruption Duration per Consumer Unit - DEC and Equivalent Interruption Frequency per Consumer Unit - FEC for the years 2021 to 2026.
For DEC, the result for the last 12 months calculated in December 2023 was 7.86 hours. For the FEC, the result in the same period was
5.21 interruptions.

The economic-financial management efficiency criterion will be measured
by the calculation, each calendar year, according to ANEEL Normative Resolution No. 896/2020, by the following inequation:

4.2.4 Investment and Operational Data
Transformation Program (Programa Transformação)
- a broad investment plan with the objective of modernizing, auto mating and renovating the distribution grid and private communication
grid with standardized technologies to service automation equipment. Among the expected benefits are the strengthening of rural grid to
reduce disconnections and guarantee support for the growth of agribusiness in the State of Paraná, the reduction of costs with
O&M and commercial services and improvement in the control of DEC and FEC indicators. The program is composed of 3 pillar projects
to achieve the objectives:
| · | Paraná Tri-phase: represents the improvement and renewal of rural distribution grid in the Company's
concession area, with the implementation of a three-phase grid and creation of redundancy in the main rural branches. By the end of 2023,
15,254 km of grid had been completed. |
| · | Smart Grid: aims to implement a private communication network with standardized technology to service
all automation equipment in the distribution grid and advanced metering infrastructure. By the end of 2023, 615,644 smart meters had already
been installed. In phase 1 of the program, advances were identified for our operation, with a reduction in man-hours and kilometers driven,
fewer non-technical losses, improvements in quality and reduction in compensation, with estimated benefits of around R$49 million/ year. |
| · | Total Reliability: aims to ensure modernity in the operations of the energy grid based on the following
premises: maintain full communication between teams and the availability of equipment on the grid, implement automation in special equipment,
maintain the entire municipality of the concession with a substation or special key and expand the grid circuits and Self Healing. By
the end of 2023, the project had completed 84.35% of the planned schedule. |
Copel Distribuição's Transformation Program covers
the construction of approximately 25 thousand km of new grid, 15 thousand new automated points and the implementation of smart grid technology
in the state of Paraná.
Compact and Protected Grid – deployment of compact
grid predominantly in urban areas with a high degree of afforestation in the vicinity of distribution grid and protected grid exclusively
in rural areas. Compact grid avoids cutting and pruning trees and improves the quality of supply, as it reduces the number of disconnections.
Protected grid also improves the quality and reliability of the system as it avoids interruptions due to contact with vegetation or other
objects and bad weather. At the end of 2023, the length of compact and protected grid installed was 27,851 km, compared to 22,366 km in
2022, an increase of 5,485 km, or 24.52%, in twelve months.
Isolated Secondary Grid- investment in low voltage isolated
secondary grid (127/220V), which have significant advantages over the conventional overhead grid, such as: improving DEC and FEC indicators;
make energy theft difficult; improve environmental conditions; reduce pruning areas; increase security; reduce voltage drop across the
grid; increase the useful life of transformers by reducing the number of short circuits in the grid, among others. At the end of 2023,
the length of isolated secondary distribution grid installed was 22,827 km, compared to 21,896 km in 2022, an increase of 931 km, or 4.25%,
in twelve months.
Losses - refer to the generated electrical energy that passes
through transmission lines and distribution grid, but which is not commercialized, either for technical or commercial reasons. Distribution
losses can be defined as the difference between the electricity purchased by distributors and that billed to their consumers, being classified
as technical and non-technical. Technical Losses are inherent to the electrical energy distribution activity and occur due to its dissipation
during the transport process, voltage transformation and measurement due to the laws of physics. Historically, the Company's Technical
Losses have maintained percentages close to or below the regulatory target. At the end of 2023, Technical Losses were 2,120 GWh, compared
to 2,040 GWh in 2022. Non-Technical Losses, calculated by the difference between total and technical losses, originate mainly from theft
(illegal connection, direct grid diversion), fraud (meter tampering or deviations), reading, measurement and billing errors. These losses
are largely associated with the concessionaire's management and the socioeconomic characteristics of the concession areas. At the end
of September 2023, Non-Technical Losses for the last 12 months were 575 GWh, compared to 614 GWh in the same period of the previous year.
In this sense, the Company maintains a Program to Combat Non-Technical Losses that consists of several actions that aim to reduce or maintain
the current level of non-technical losses, through the following actions:
| ü | Improvement of actions to combat irregular procedures, improving the performance of targeted inspections; |
| ü | Investments destined to the availability and/or acquisition of equipment for inspection; |
| ü | Preparation and execution of specific training and recycling related to commercial losses; |
| ü | Carrying out inspections, both at Medium and Low Voltage; |
| ü | Educational notes in the press and messages on the electricity bill. |
| ü | Joint operations with the Civil Police and Public Ministry; |
| ü | Opening of police investigations in regions where significant numbers of irregular procedures were found. |
At the end of 2023, Non-Technical Losses in the last 12 months were
742 GWh, compared to 661 GWh in the same period of the previous year.
It is worth noting that the targets established for the reasonable
tariff for Non-Technical Losses take into account the level of complexity of the distributor's concession area and, according to the Aneel
Report on Electricity Losses in Distribution 2023, the complexity index of Copel Distribuição's concession is one of the
smallest compared to other dealerships in Brazil.
At the end of 2023, total losses in the last 12 months were 2,862
GWh, compared to 2,701 GWh in the same period of the previous year. In terms of classification, Total Losses were made up of 74.1% Technical
Losses and 25.9% Non-Technical Losses.
| GWh - 12 Months |
Dec/19 |
Dec /20 |
Dec /21 |
Dec /22 |
Dec /23 |
| Injected Energy |
32,994 |
32,754 |
34,403 |
35,253 |
36,639 |
| Distribuition losses |
2,402 |
2,553 |
2,660 |
2,701 |
2,862 |
| Technical losses |
1,995 |
1,981 |
1,991 |
2,040 |
2,120 |
| Non-Technical losses |
407 |
573 |
669 |
661 |
742 |
* The losses reflect the difference between the measured
load and the billed market and, with the onset of the Covid-19 Pandemic, the load in 2020 suffered a rapid retraction, but the market
did not respond at the same speed, due to the mismatch between the measurement schedule and consumers billing schedule, reducing the volume
of losses in this period.
The tariff transfer of the efficient levels of losses is foreseen
in the concession contracts and these losses are considered in the costs with the purchase of energy up to the regulatory limit stipulated
by ANEEL. Despite the total losses having percentages slightly above the regulatory one, the methodology for regulatory calculation uses
the billed market and within this methodology, no loss glosses were calculated for Copel Distribuição in the annual tariff
readjustment cycles of 2022 and 2023.

5.Copel Mercado Livre |
| 5.1 Financial Performance |
In 4Q23, Copel Mercado Livre presented an adjusted EBITDA of R$9.7
million, an amount 61.3% lower than the R$25.2 million recorded in 4Q22, mainly reflecting a lower margin in electricity sales. In 2023,
adjusted EBITDA increased by 24.7%, mainly as a result of the higher annual margin in electricity sales, resulting from purchase contracts
signed in previous years, reaching R$112.6 million compared to R$90.3 million from the same period of the previous year.

In the quarter, the adjustment in the periods was the fair value
of the electricity purchase and sale contracts (mark to market) - amount determined by the difference between the contracted price and
the future market price estimated by the Company - a result, mainly, of carrying out contracts that left the base and the increased sensitivity
of default given by the credit risk rate. In 2023, the adjustments were the mark-to-market, the provision of compensation for PDV, recorded
in the third quarter, and the compensation for the bonus for the additional third of vacation that occurred in the first quarter.
Manageable costs increased by 37.2% in 4Q23 (+1.9 million), mainly
impacted by the increase in insurance expenses (+R$0.6 million) and projects to support social development and sport through tax incentives
(+R$ 1.2 million), which have no impact on the result and still contribute to the brand's exposure and positioning strategy.

The personnel and management account, excluding the PLR and PPD
effects, recorded a 13.5% reduction in 4Q23, mainly due to the 12.8% reduction in the number of employees, despite the effects of ACT
2022/2024 with salary bonus (+R$ 0.2 million) in 4Q23 and salary adjustments of 7.19% in January 2023 and 4.51% in October 2023 of the
current year. Considering the accumulated inflation measured by the National Consumer Price Index – INPC, of 3.71% between the quarters,
the personnel and management cost line registered a reduction in real terms of 17.2%. In the year to date, disregarding the effects of
PLR and PPD, compensation for PDV and compensation for the bonus of the additional third of vacation, the personnel and management account
reduced by 2.7%.

Net income in 4Q23 was R$24.7 million, 50.5% lower than the R$49.9
million in 4Q22 as a result of the reduction in the sales margin. In 2023, Copel Mercado Livre's net income was R$105.6 million compared
to R$108.4 million in 2022.

|
5.2
Operational Performance |
Copel was a pioneer in creating an energy trader and the first
to sell energy to free consumers, when this category was created in the country, in 1995. Copel Mercado Livre, created in 2016, is already
the largest in the country in terms of energy volume marketed in the free contracting environment, offering more savings and peace of
mind for customers from all regions of Brazil.
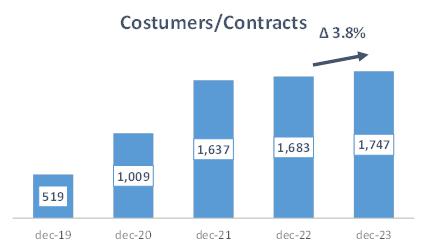
For a long time known as Copel Energia, Copel Mercado Livre is
responsible for trading energy and providing services in the ACL. In December 2023, the Company registered 1,747 customers/contracts,
an increase of 3.8% compared to the same period of the previous year. The amount of energy sold reached 22,450 GWh in 2023, a reduction
of 9.5% compared to 2022. The graph below shows the evolution of Copel Mercado Livre in terms of the amount of GWh sold and number of
final consumers.

| 6. ESG Performance |
| 6.1 Copel pioneers in ESG in the sector |
Copel was the first company in the industry to produce an Environmental
Impact Report for a generation project, and the first energy company in Brazil to become a signatory of the UN Global Compact in 2000.
The Company promotes actions to disseminate the UN’s Agenda 2030 and implement the SDGs of the electricity sector. In 2020/2021,
Copel participated in the Global Compact Program “SDG Ambition”. Copel joined the “Pact on Water and Energy Resilience”
Commitment and received the Federal Government’s Pro Gender and Race Equality Seal. The Company received the Pró-Ética
Seal, 2018-2019 and 2020-2021 editions, granted by the Brazillian Comptroller General (CGU) and Instituto ETHOS, for the voluntary adoption
of integrity measures, for public recognition of the commitment to implement measures aimed at prevention, detection, and remediation
of acts of corruption and fraud.
| § | Copel achieved an A- (A minus) rating from the CDP Disclosure Insight Action, previously known as the
Carbon Disclosure Project, reinforcing its commitment to the ESG theme. |
| § | For the 18th time, Copel is in the ISE B3 portfolio – Corporate Sustainability Index. |
| § | Copel signed the Share Purchase and Sale agreement relating to its shareholding in UEG Araucária
S.A. (“UEGA”), in line with the decarbonization process of the generation matrix and adhering to Copel’s Business Strategic
Planning – Vision 2030, strengthening the pillars for the longevity and sustainable growth of businesses. |
| § | Copel concluded its 2023 materiality process, where 10 material themes were defined, namely: Corporate
Governance; Economic-financial performance; Customer satisfaction; Environmental commitment; Social Commitment; People management; Well-being,
health and safety for the workforce; Transformation of the energy sector; Public safety; Sustainable Supplier Management. For the first
time, the Company also carried out double materiality, i.e., it worked on ESG and financial analysis together, strengthening its corporate
strategy. |
| § | The transformation of Copel into a Corporation led to the review of several Corporate Policies, Regulations
and Bylaws, keeping the Company's Governance aligned with the best market practices. |
| § | The Company participated for the second consecutive year as a partner in “Empoderando Refugiadas”
in Curitiba, a UN Women project that aims to increase the employability of migrant women. Copel works on the project mainly through corporate
volunteering. |
Environmental
| § | It has a Copel 2030 Neutrality Plan, approved by the Board of Directors: focusing on science-based goals
(SBTi), with the purpose of neutralizing the Emission of Greenhouse Effect Gases (GHG) of Scope 1, for the assets that Copel owns operational
control (according to the concept established in the GHG Protocol methodology) by 2030. |
| § | Net Zero Ambition Movement – Copel joined the Net Zero Ambition Movement. The movement is part of
the strategies developed by the Global Compact so that large companies together can promote actions that result in the reduction of 2Gton
CO2e by 2030. |
| § | Has corporate policies on Climate Change, Environmental, and Biodiversity. |
| § | Integrates the Brazilian Business Commitment to Biodiversity with the Brazilian Business Council for Sustainable
Development (CEBDS). |
Social
| § | Actions and Programs – Solidary Selective Collection; Grow Energy Program; Electricity Citizenship;
Good Neighborhood Program; Diversity Commission; Human Rights; EducaODS; Illuminating Generations; More than Energy, among others. |
| § | Has corporate policies on Human Rights, Engagement with Stakeholders, Private Social Investment, People
Management, Occupational Health and Safety, among others. |
Governance
| § | It has Statutory Advisory Committees to the Board of Directors: Statutory Audit Committee -CAE; Statutory
Sustainable Development Committee -CDS, Investment and Innovation Committee -CII and Minority Shareholders Committee –CDM. |
| § | The Board of Directors is made up mostly of independent members; |
| § | The Statutory Audit Committee -CAE is made up of independent members, one of whom is an external member. |
| § | Establishment of variable remuneration with ESG targets –2022: 30% of PPD. |
| § | Listed under B3 Governance Level 2. |
| § | On 08/11/2023, Copel was transformed into a Corporation. As a result, the company became a company with
dispersed capital and no controlling shareholder. |
Priority SDG of the Brazilian Electricity Sector
6.3 Indicators
The indicators may change due to the assurance of the independent
external audit.
In relation to the scope 1 GHG indicator (tCO2), the increase recorded
is due to the return of commercial operation at UTE Figueira, on 12/07/2022, by ANEEL Order no. 2502/2022, with generation until September
2023. Online With the plan to have a 100% clean generation matrix, in October 2023 the Company filed a letter with the Ministry of Mines
and Energy - MME requesting the withdrawal of the intention to extend the TPP Figueira concession. In February 2024, Aneel decided to
suspend commercial operations, and the plant will be hibernated. More details in “Other highlights”.
Available Cash Flow and Dividends
The Available Cash Flow is defined in the Dividend Policy as: FCD
= Cash generated by Operating activities, deducted from the net cash used by investing activities, as follows: (a) Cash generated by Operating
Activities: cash generated by operating activities in the fiscal year, before taxes, contributions (IRCS) and financial charges; (b) Net
cash used by Investing activities: amount invested in noncurrent assets in the fiscal year. The Table below shows the calculation of FCD
as of December 31, 2023:
R$’000
| 12.31.2023 |
| CASH FLOW FROM OPERATIONAL ACTIVITIES |
| CASH GENERATED BY OPERATING ACTIVITIES |
5.360.703 |
| CASH FLOW FROM INVESTMENT ACTIVITIES |
| FROM CONTINUING OPERATIONS |
(3,099,567) |
| FROM DISCONTINUED OPERATIONS |
(35,524) |
| NET CASH USED FROM INVESTMENT ACTIVITIES |
(3,135,091) |
| AVAIABLE CASH FLOW “FCD” |
2,225,612 |
In line with the dividend policy, considering the above DCF and
the level of leverage, the Company proposed the total payment of R$1,089.2 million in dividends for the 2023 financial year, of which
R$958.0 million in the form of Interest on Equity (JCP) and R$131.2 million in the form of dividends. The Company has already paid R$456.9
million on November 30, 2023, and the remaining R$632.3 million will be paid by June 30, 2024, after deliberation at the Ordinary General
Meeting – AGM on 22/04 /2024.
Copel Day 2023 – True Corporation
The Company held Investor Day at its headquarters in Curitiba-PR,
on November 22, 2023, and was attended in person by more than 40 analysts, investors and interested parties and more than 400 spectators
who watched the live broadcast. The event discussed, among other topics, PMSO planning + Contingency Provision, Investment in Reinforcement
and Improvement in Transmission Lines and the Regulatory Remuneration Base. For more information, access the event broadcast and presentation
available on our website.
Divestment in UEGA: signing of Share Purchase
and Sale Agreement (CCVA)
On December 14, 2023, Copel and Copel GeT signed a CCVA contract
for the 81.2% equity interest in TPP Araucária with Âmbar Energia S.A. The signing of the CCVA derives from the acceptance
of the binding proposal received by the Company in the value of its participation corporate value (“Enterprise Value”) of
R$320.7 million, on the base date of September 30, 2023, with the “Equity Value” being R$290.7 million, considering a net
debt of R$30.0 million on the same base date. For more information, visit here.
On February 23, 2024, Petróleo Brasileiro S.A. –
Petrobras adhered to the terms and conditions of the CCVA for the sale of 18.8% of its stake, representing the divestment of the entire
plant.
Copel becomes part of the MSCI Brazil index
Since December 1, 2023, class B preferred shares (CPLE6) have
been included in the Morgan Stanley Capital Index (MSCI) seal. As a result, the shares were heavily traded with index-based funds. MSCI
indices are a global reference for institutional investors who use them as a reference to compose the investment portfolio of passive
funds around the world. According to MSCI, currently around US$14.9 trillion in assets under investment fund management are managed globally
using MSCI indices as a benchmark.
Copel receives the Deal of the Year Award from
LatinFinance magazine
On January 25, 2024, the Company received the Subnational Deal
of the Year award from LatinFinance magazine, in recognition of the process of transforming COPEL into a corporation with dispersed capital
and without a controlling shareholder, which took place in 2023. This achievement reflects the commitment, efficiency and effectiveness
of the entire Company in the set of actions for the successful execution of the Public Offering of Shares process.
For more information, visit here.
Closing of the Unit Program
On December 26, 2023, the program was discontinued upon approval
at the 209th EGM of December 18, 2023 and resulted in the cancellation of the share deposit certificates (“Units”) (CPLE11)
and the consequent delivery of the 5 (five) shares of issued by the Company underlying each Unit in 1 (one) common share (CPLE3) and 4
(four) class “B” preferred shares (CPLE6), preserving the same rights, advantages and restrictions of these shares for the
holders of the Units.
For more information, click here.
TPP Figueira: SFT/ANEEL Order - No. 561/2024
On February 23, 2024, Aneel's Technical Inspection Superintendence
(SFT), through Order No. 561/2024, authorized the suspension of the commercial operation of the generating unit – UG1 of TPP Figueira.
Copel has also formalized with the granting authority the withdrawal of the request to extend the concession of the asset and is awaiting
a response from the Ministry of Mines and Energy. The thermoelectric plant with 20 MW of installed power, powered by mineral coal, does
not have current energy supply contracts. This claim is another stage in Copel's strategic plan to decarbonize its energy generation portfolio.
Copel remains in ISE B3
The Company will continue to be part of the B3 – Brasil,
Bolsa, Balcão Corporate Sustainability Index (ISE) portfolio in 2024. The ISE portfolio evaluation process is organized into 5
dimensions (environment, corporate governance and senior management, human capital, social capital and business model and innovation),
and a sixth dimension, referring to climate change, assessed using the CDP-Climate Change score (index produced by the international organization
Carbon Disclosure Project, used to evaluate companies in in relation to issues relating to climate change). The ISE is a comparative analysis
tool and reflects the return of a portfolio made up of shares from companies with the best performance in ESG (Environmental, Social and
Governance) aspects, being a reference for the Company's strategy, providing longevity and sustainability to its businesses.
Copel advanced to A- CDP score
The Company achieved an A- rating from the CDP Disclosure Insight
Action, formerly known as the Carbon Disclosure Project. The Company has responded to the CDP since 2010 and in recent years has maintained
a B score, increasing its score in the Climate Change program in 2023 to A-. CDP is a global organization that manages the main environmental
disclosure platform for strategic climate change management initiatives. With strategic guidelines adhering to ESG precepts, Copel's evolution
reflects practices developed such as inventory history, approval of the carbon neutrality plan, investment in a more renewable company,
carrying out risk analyzes and development of planning strategic and financial strategies that consider climate change and its articulation
with interested parties.
Copel closes 2023 with delivery of 30 transmission
and distribution works
During 2023, Copel carried out around 30 works including construction
or expansion of substations, transmission and energy distribution lines in Paraná. The projects are part of the company's investment
plan in recent years and total R$428 million in improvements. The majority, R$379 million, was invested by the company in 27 works that
modernize and reinforce the energy distribution infrastructure. Another R$49 million was allocated to the modernization of three transmission
grid projects.
Creation of the Regulatory Assistance Office
Aiming to align with the best market practices, have integrated
policies with better control of results, optimize leadership functions and strengthen them for continuous value generation, the Company
defined and the Board of Directors (“CAD”) approved the new organizational structure of Copel Holding with the creation of
the Regulatory Assistance Office linked directly to the Presidency, contemplating an exclusive structure for even more strategic action
in the regulatory sphere with a view to creating value for the Company. Since January 02, 2024, the new officer is engineer Fernando Antônio
Gruppelli Junior. Graduated in Electrical Engineering from the Federal Technological University of Paraná (UTFPR), the new director
has a master's degree in electrical engineering and industrial information technology from the same institution, an MBA in management
from Fundação Dom Cabral, and an MBA in finance, controllership and compliance from Fundação Getúlio
Vargas. A career employee since 1997, Director Fernando Gruppelli has worked in the areas of planning, underground networks, research
and development, projects and works and management. He has held management positions since 2007 and for the last six years was superintendent
of Asset Management and Distribution Finance.
New Officer of Copel Mercado Livre
On December 01, 2023, electrical engineer Kleberson Luiz da Silva
is the new general director of Copel Mercado Livre. Working at the Company since 2010, Kleberson was in charge of several areas of energy
commercialization in the company and, more recently, the superintendencies of energy commercialization at GeT. He was at Copel Mercado
Livre in the Energy Market and Planning department. Graduated in Electrical Engineering with a Master's degree in Technology Development
from Lactec, he is a member of the Board of Directors of Simepar and the Supervisory Board of the Electricity Trading Chamber-CCEE. He
has been a career employee of Copel since 2010, working as an Electrical Engineer and holding management positions in various areas of
commercialization and generation and transmission.
.Disclaimer
The information contained in this press release may contain
forward-looking statements that reflect management’s current view and estimates of future economic circumstances, industry conditions,
company performance, and financial results. Any statements, expectations, capabilities, plans and assumptions contained in this press
release that do not describe historical facts such as statements regarding the declaration or payment of dividends, the direction of future
operations, the implementation of relevant operating and financial strategies, the investment program, factors or trends affecting the
Company’s financial condition, liquidity or results of operations are forward-looking statements within the meaning of the U.S.
Private Securities Litigation Reform Act of 1995 and involve a number of risks and uncertainties. There is no guarantee that these results
will actually occur. The statements are based on many assumptions and factors, including general economic and market conditions, industry
conditions and operating factors. Any changes in such assumptions or factors could cause actual results to differ materially from current
expectations.
Investor Relations
ri@copel.com
Phone: +55 (41) 3331-4011

| Exhibit I - CONSOLIDATED RESULTS > INCOME STATEMENT |
| Income Statement |
4Q23 |
4Q22 |
Δ% |
2023 |
2022 |
Δ% |
|
| |
| OPERATING REVENUES |
5,567,699 |
5,264,780 |
5.8 |
21,479,468 |
20,535,341 |
4.6 |
|
| Electricity sales to final customers |
2,192,491 |
1,763,100 |
24.4 |
7,946,168 |
7,510,037 |
5.8 |
|
| Electricity sales to distributors |
864,078 |
981,497 |
(12.0) |
3,602,787 |
3,814,409 |
(5.5) |
|
| Use of the main distribution and transmission grid |
1,654,202 |
1,296,436 |
27.6 |
6,002,192 |
4,828,841 |
24.3 |
|
| Construction revenue |
587,661 |
572,340 |
2.7 |
2,333,788 |
2,164,134 |
7.8 |
|
| Fair value of assets from the indemnity for the concession |
20,269 |
34,124 |
(40.6) |
62,167 |
79,169 |
(21.5) |
|
| Result of Sectorial financial assets and liabilities |
91,494 |
467,880 |
(80.4) |
971,203 |
1,676,936 |
(42.1) |
|
| Other operating revenues |
157,504 |
149,403 |
5.4 |
561,163 |
461,815 |
21.5 |
|
| OPERATING COSTS AND EXPENSES |
(4,445,090) |
(4,765,496) |
(6.7) |
(18,092,563) |
(18,065,146) |
0.2 |
|
| Electricity purchased for resale |
(2,022,064) |
(2,072,787) |
(2.4) |
(7,716,190) |
(8,096,910) |
(4.7) |
|
| Charge of the main distribution and transmission grid |
(778,220) |
(629,269) |
23.7 |
(2,896,710) |
(2,487,997) |
16.4 |
|
| Personnel and management |
(316,642) |
(249,726) |
26.8 |
(1,878,332) |
(977,904) |
92.1 |
|
| Pension and healthcare plans |
(65,950) |
(64,485) |
2.3 |
(260,159) |
(260,197) |
(0.0) |
|
| Materials and supplies |
(37,917) |
(26,358) |
43.9 |
(102,667) |
(90,541) |
13.4 |
|
| Materials and supplies for power eletricity |
- |
(9,349) |
- |
(17,654) |
(9,349) |
88.8 |
|
| Third-party services |
(267,960) |
(209,625) |
27.8 |
(996,312) |
(754,551) |
32.0 |
|
| Depreciation and amortization |
(354,807) |
(318,215) |
11.5 |
(1,382,040) |
(1,233,097) |
12.1 |
|
| Provisions and reversals |
112,537 |
(490,967) |
(122.9) |
(92,235) |
(717,531) |
(87.1) |
|
| Construction cost |
(585,226) |
(563,881) |
3.8 |
(2,319,720) |
(2,137,188) |
8.5 |
|
| Renegotiation of Hydrological Risk - GSF - HPP Mauá |
(26,405) |
- |
- |
- |
- |
- |
|
| Other cost and expenses |
(102,435) |
(130,834) |
(21.7) |
(430,544) |
(489,318) |
(12.0) |
|
| PROVISION FOR ALLOCATION OF PIS AND COFINS |
- |
- |
- |
- |
(810,563) |
- |
|
| EQUITY IN EARNINGS OF SUBSIDIARIES |
63,134 |
148,462 |
(57.5) |
307,809 |
478,577 |
(35.7) |
|
| PROFIT BEFORE FINANCIAL RESULTS AND TAXES |
1,185,742 |
647,746 |
83.1 |
3,694,714 |
2,948,772 |
25.3 |
|
| FINANCIAL RESULTS |
(305,701) |
(279,746) |
9.3 |
(1,204,990) |
(2,005,884) |
(39.9) |
|
| Financial income |
272,666 |
232,808 |
17.1 |
1,069,116 |
956,413 |
11.8 |
|
| Financial expenses |
(578,367) |
(512,554) |
12.8 |
(2,274,106) |
(1,950,927) |
16.6 |
|
| Update of provision for allocation of Pis and Cofins credits |
- |
- |
- |
- |
(1,011,370) |
- |
|
| OPERATIONAL EXPENSES/ INCOME |
880,041 |
368,000 |
139.1 |
2,489,724 |
942,888 |
164.1 |
|
| INCOME TAX AND SOCIAL CONTRIBUTION ON PROFIT |
(261,000) |
366,766 |
(171.2) |
(354,057) |
281,099 |
- |
|
| Income tax and social contribution on profit |
(73,702) |
179,562 |
(141.0) |
(371,104) |
(368,035) |
0.8 |
|
| Deferred income tax and social contribution on profit |
(187,298) |
187,204 |
(200.1) |
17,047 |
649,134 |
(97.4) |
|
| NET INCOME continuing operations |
619,041 |
734,766 |
(15.7) |
2,135,667 |
1,223,987 |
74.5 |
|
| NET INCOME discontinued operations |
323,767 |
(111,256) |
- |
191,501 |
(74,666) |
- |
|
| NET INCOME |
942,808 |
623,510 |
51.2 |
2,327,168 |
1,149,321 |
102.5 |
|
| Attributed to the controlling company's shareholders - continuing operations |
637,261 |
733,224 |
(13.1) |
2,158,077 |
1,237,819 |
74.3 |
|
| Attributed to the controlling company's shareholders - discontinued operations |
241,762 |
(111,947) |
- |
100,733 |
(125,812) |
- |
|
| Attributed to non-controlling shareholders- continuing operations |
(5,241) |
3,809 |
- |
873 |
(207) |
- |
|
| Attributed to non-controlling shareholders- discontinued operations |
69,027 |
(1,576) |
- |
67,485 |
37,521 |
79.9 |
|
| EBITDA continued operations |
1,540,549 |
965,961 |
59.5 |
5,076,754 |
4,181,869 |
21.4 |
|
| Exhibit I - CONSOLIDATED RESULTS > BALANCE SHEET |
| R$'000 |
|
R$'000 |
| Assets |
Dec-23 |
Dec-22 |
Δ% |
|
Liabilities |
Dec-23 |
Dec-22 |
Δ% |
| CURRENT |
13,715,730 |
9,327,249 |
47.1 |
|
CURRENT |
9,309,433 |
7,156,597 |
30.1 |
| Cash and cash equivalents |
5,634,623 |
2,678,457 |
110.4 |
|
Payroll, social charges and accruals |
927,538 |
252,789 |
266.9 |
| Bonds and securities |
4,763 |
93 |
- |
|
Suppliers |
2,154,430 |
2,090,022 |
3.1 |
| Collaterals and escrow accounts |
9 |
157 |
(94.3) |
|
Income tax and social contribution payable |
132,979 |
156,191 |
(14.9) |
| Customers |
3,761,170 |
3,342,050 |
12.5 |
|
Other taxes due |
346,083 |
303,606 |
14.0 |
| Dividends receivable |
95,569 |
138,330 |
(30.9) |
|
Loans and financing |
675,980 |
278,838 |
142.4 |
| Sectorial financial assets |
15,473 |
190,699 |
(91.9) |
|
Debentures |
1,225,649 |
1,346,347 |
(9.0) |
| Account receivable related to concession |
9,354 |
8,603 |
8.7 |
|
Minimum compulsory dividend payable |
464,147 |
482,325 |
(3.8) |
| Contract Assets |
284,616 |
220,660 |
29.0 |
|
Post employment benefits |
85,833 |
73,814 |
16.3 |
| Other current receivables |
949,732 |
897,380 |
5.8 |
|
Customer charges due |
61,466 |
46,488 |
32.2 |
| Inventories |
174,726 |
194,850 |
(10.3) |
|
Research and development and energy efficiency |
320,196 |
370,244 |
(13.5) |
| Income tax and social contribution |
315,218 |
355,065 |
(11.2) |
|
Accounts Payable related to concession |
101,976 |
105,003 |
(2.9) |
| Other current recoverable taxes |
943,343 |
1,239,694 |
(23.9) |
|
Net sectorial financial liabilities |
476,103 |
433,914 |
9.7 |
| Prepaid expenses |
62,869 |
60,076 |
4.6 |
|
Lease liability |
49,742 |
64,870 |
(23.3) |
| Related parties |
1,336 |
1,135 |
17.7 |
|
Other accounts payable |
859,456 |
601,619 |
42.9 |
| Assets held for sale |
1,462,929 |
- |
- |
|
PIS and COFINS to be refunded to costumers |
558,591 |
550,527 |
1.5 |
| NON-CURRENT |
42,103,344 |
40,376,451 |
4.3 |
|
Provisions for litigation |
336,000 |
- |
- |
| Long Term Assets |
16,343,437 |
16,442,145 |
(0.6) |
|
Liabilities associated with assets held for sale |
533,264 |
- |
- |
| Bonds and securities |
490,732 |
430,963 |
13.9 |
|
NON-CURRENT |
22,317,974 |
21,415,878 |
4.2 |
| Other temporary investments |
31,728 |
25,619 |
23.8 |
|
Suppliers |
131,143 |
125,448 |
4.5 |
| Customers |
105,259 |
109,819 |
(4.2) |
|
Deferred income tax and social contribution |
1,686,793 |
1,517,682 |
11.1 |
| Judicial deposits |
634,712 |
632,458 |
0.4 |
|
Other taxes due |
612,093 |
633,491 |
(3.4) |
| Sectoral financial assets |
15,473 |
190,699 |
(91.9) |
|
Loans and financing |
4,667,237 |
4,371,525 |
6.8 |
| Account receivable related to concession |
2,809,901 |
2,269,690 |
23.8 |
|
Debentures |
8,393,457 |
6,457,508 |
30.0 |
| Contract Assets |
7,320,445 |
7,452,019 |
(1.8) |
|
Post employment benefits |
1,398,410 |
996,223 |
40.4 |
| Other non-current receivables |
853,340 |
931,452 |
(8.4) |
|
Research and development and energy efficiency |
233,478 |
244,514 |
(4.5) |
| Income tax and social contribution |
68,003 |
127,824 |
(46.8) |
|
Accounts Payable related to concession |
791,879 |
832,539 |
(4.9) |
| Deferred income tax and social contribution |
1,757,688 |
1,644,299 |
6.9 |
|
Net sectorial financial liabilities |
27,888 |
49,341 |
(43.5) |
| Other non-current recoverable taxes |
2,256,156 |
2,627,293 |
(14.1) |
|
Lease liability |
220,700 |
208,886 |
5.7 |
| Prepaid expenses |
- |
10 |
(100.0) |
|
Other accounts payable |
579,070 |
645,234 |
(10.3) |
| Investments |
3,511,797 |
3,325,731 |
5.6 |
|
PIS and COFINS to be refunded to costumers |
173,135 |
1,444,631 |
(88.0) |
| Property, plant and equipment, net |
10,825,421 |
10,069,468 |
7.5 |
|
Provision for allocation of Pis and Cofins credits |
1,909,775 |
1,851,257 |
3.2 |
| Intangible assets |
11,170,089 |
10,277,727 |
8.7 |
|
Provisions for litigation |
1,492,916 |
2,037,599 |
(26.7) |
| Right to use an asset |
252,600 |
261,380 |
(3.4) |
|
EQUITY |
24,191,667 |
21,131,225 |
14.5 |
| TOTAL |
55,819,074 |
49,703,700 |
12.3 |
|
Attributed to controlling shareholders |
23,886,153 |
20,817,364 |
14.7 |
| |
|
|
|
|
Share capital |
12,821,758 |
10,800,000 |
18.7 |
| |
|
|
|
|
Equity valuation adjustments |
307,050 |
593,382 |
(48.3) |
| |
|
|
|
|
Legal reserves |
1,625,628 |
1,512,687 |
7.5 |
| |
|
|
|
|
Retained earnings |
9,000,506 |
7,911,295 |
13.8 |
| |
|
|
|
|
Proposed additional dividend |
131,211 |
- |
- |
| |
|
|
|
|
Accrued earnings |
- |
- |
- |
| |
|
|
|
|
Attributable to non-controlling interest |
305,514 |
313,861 |
(2.7) |
| |
|
|
|
|
TOTAL |
55,819,074 |
49,703,700 |
12.3 |
| Exhibit I - CONSOLIDATED RESULTS > CASH FLOW |
| |
|
R$'000 |
| |
12/31/23 |
12/31/22 |
| CASH FLOWS FROM OPERATIONAL ACTIVITIES |
| |
|
|
| Net income from continuing operations |
2,135,667 |
1,223,987 |
| |
|
|
| Adjustments to reconcile net income for the period with cash generation from operating activities: |
4,775,315 |
3,210,369 |
| Unrealized monetary and exchange variation and debt charges - net |
1,951,552 |
1,298,681 |
| Interest - bonus from the grant of concession agreements under the quota system |
(114,370) |
(118,439) |
| Remuneration of transmission concession contracts |
(730,094) |
(769,248) |
| Provision for allocation of PIS and Cofins credits |
- |
1,821,933 |
| Income tax and social contribution |
371,104 |
368,035 |
| Deferred income tax and social contribution |
(17,047) |
(649,134) |
| Equity in earnings of investees |
(307,809) |
(478,577) |
| Appropriation of post-employment benefits obligations |
267,741 |
266,273 |
| Creation for research and development and energy efficiency programs |
165,459 |
155,705 |
| Recognition of fair value of assets from the indemnity for the concession |
(62,167) |
(79,169) |
| Sectorial financial assets and liabilities result |
(1,070,196) |
(1,847,863) |
| Depreciation and amortization |
1,382,040 |
1,233,097 |
| Provision from the voluntary dismissal program |
610,057 |
- |
| Net operating estimated losses, provisions and reversals |
92,235 |
717,531 |
| Resultado da repactuação do risco hidrológico - GSF |
- |
- |
| Realization of added value in business combinations |
(722) |
(721) |
| Fair value in energy purchase and sale operations |
(5,046) |
(32,748) |
| Derivatives fair value |
- |
2,907 |
| Loss on disposal of accounts receivable related to concession |
270 |
26,533 |
| Loss on disposal of contract assets |
16,728 |
8,829 |
| Loss on disposal of property, plant and equipment |
10,458 |
7,850 |
| Loss on disposal of intangible assets |
78,728 |
55,053 |
| Result of write-offs of use rights of assets and liabilities of leases - net |
726 |
(146) |
| |
|
|
| Decrease (increase) in assets |
98,706 |
2,335,113 |
| Trade accounts receivable |
188,437 |
1,482,232 |
| Dividends and interest on own capital received |
174,826 |
67,732 |
| Judicial deposits |
33,298 |
1,521 |
| Sectorial financial assets |
36,964 |
966,466 |
| Other receivables |
(11,555) |
69,208 |
| Inventories |
18,741 |
7,326 |
| Income tax and social contribution recoverable |
(201,003) |
(488,495) |
| Other taxes recoverable |
(138,520) |
236,843 |
| Prepaid expenses |
(2,281) |
(6,585) |
| Related parties |
(201) |
(1,135) |
| |
|
|
| Increase (decrease) in liabilities |
486,682 |
(449,170) |
| Payroll, social charges and accruals |
297,343 |
(191,643) |
| Suppliers |
19,506 |
(347,157) |
| Other taxes |
974,083 |
884,140 |
| Post-employment benefits |
(224,809) |
(200,697) |
| Sectorial charges due |
14,978 |
(151,898) |
| Research and development and energy efficiency |
(255,295) |
(202,073) |
| Payable related to the concession |
(115,736) |
(106,370) |
| Other accounts payable |
149,450 |
106,269 |
| Provisions for legal claims |
(372,838) |
(239,741) |
| |
|
|
| CASH GENERATED BY OPERATING ACTIVITIES |
5,360,703 |
5,096,312 |
| |
|
|
| Income tax and social contribution paid |
(294,676) |
(124,381) |
| Loans and financing - interest due and paid |
(521,134) |
(337,455) |
| Debentures - interest due and paid |
(1,127,607) |
(890,123) |
| Charges for lease liabilities paid |
(24,284) |
(19,531) |
| |
|
|
| NET CASH GENERATED BY OPERATING ACTIVITIES FROM CONTINUING OPERATIONS |
3,393,002 |
3,724,822 |
| NET CASH GENERATED BY OPERATING ACTIVITIES FROM DISCONTINUED OPERATIONS |
125,474 |
177,827 |
| NET CASH GENERATED FROM OPERATING ACTIVITIES |
3,518,476 |
3,902,649 |
| |
|
|
| CASH FLOWS FROM INVESTMENT ACTIVITIES |
| Financial investments |
(44,061) |
44,190 |
| Additions to contract assets |
(1,973,215) |
(1,909,603) |
| Acquisitions of subsidiaries - effect on cash |
(911,450) |
(18,031) |
| Disposal of investments |
58,132 |
- |
| Additions in investments |
(10,780) |
(4,829) |
| Capital reduction of investees |
- |
61,536 |
| Additions to property, plant and equipment |
(204,805) |
(381,938) |
| Additions to intangible assets |
(13,388) |
(8,319) |
| |
|
|
| NET CASH USED BY INVESTMENT ACTIVITIES FROM CONTINUING OPERATIONS |
(3,099,567) |
(2,216,994) |
| NET CASH USED BY INVESTMENT ACTIVITIES FROM DISCONTINUED OPERATIONS |
(35,524) |
(558,002) |
| NET CASH USED FROM INVESTING ACTIVITIES |
(3,135,091) |
(2,774,996) |
| |
|
|
| CASH FLOWS FROM FINANCING ACTIVITIES |
| Loans and financing obtained from third parties |
45,325 |
1,891,954 |
| Transaction costs in the issuing of loans and financing |
(6,886) |
(19,781) |
| Issue of debentures |
2,900,000 |
1,500,000 |
| Transaction costs in the issuing of debentures |
(60,677) |
(14,445) |
| Payments of principal - loans and financing |
(260,971) |
(1,000,319) |
| Payments of principal - debentures |
(1,193,910) |
(2,051,481) |
| Amortization of principal of lease liabilities |
(69,293) |
(57,212) |
| Capital increase |
2,031,619 |
- |
| Transaction costs in the capital increase |
(14,941) |
- |
| Dividends and interest on own capital paid |
(750,371) |
(2,167,769) |
| |
|
|
| NET CASH GENERATED (USED) BY FINANCING ACTIVITIES FROM CONTINUING OPERATIONS |
2,619,895 |
(1,919,053) |
| NET CASH GENERATED (USED) BY FINANCING ACTIVITIES FROM DISCONTINUED OPERATIONS |
76,677 |
(2,988) |
| NET CASH GENERATED (USED) FROM FINANCING ACTIVITIES |
2,696,572 |
(1,922,041) |
| |
|
|
| TOTAL EFFECTS ON CASH AND CASH EQUIVALENTS |
3,079,957 |
(794,388) |
| |
|
|
| Cash and cash equivalents at the beginning of the period |
2,678,457 |
3,472,845 |
| Cash and cash equivalents at the end of the period |
5,634,623 |
2,552,407 |
| Change in cash and cash equivalents from discontinued operations |
123,971 |
126,050 |
| |
|
|
| CHANGE IN CASH AND CASH EQUIVALENTS |
3,079,957 |
(794,388) |
| Exhibit I - CONSOLIDATED RESULTS > ADJUSTED EBITDA AND FINANCIAL RESULT |
| |
|
|
|
R$'000 |
| |
4Q23 |
4Q22 |
Δ% |
2023 |
2022 |
Δ% |
| EBITDA FROM CONTINUING OPERATIONS |
1,540.5 |
966.0 |
59.5 |
5,076.8 |
4,181.9 |
21.4 |
| (-/+) Fair value in the purchase and sale of energy |
(11.4) |
(36.9) |
(69.1) |
(5.0) |
(32.7) |
(84.6) |
| (-/+) Impairment |
(123.7) |
(34.8) |
255.8 |
(177.7) |
7.4 |
|
| (-/+) Tariff flag account on MMGD |
- |
- |
|
- |
(43.4) |
|
| (-/+) Reflection of the PIS/Cofins forecast |
- |
- |
|
- |
(58.1) |
|
| (-/+) Indemnity of adittional third of vacation bonus |
- |
- |
|
138.2 |
- |
|
| (-/+) Provision for allocation of PIS/Cofins credits |
- |
- |
|
- |
810.6 |
|
| (-/+) Provision/Reversal for indemnification for PDV |
- |
- |
|
610.1 |
(7.9) |
|
| (-/+) Hydrological Risk Renegotiation (GSF) - HPP Mauá |
26.4 |
- |
|
- |
- |
|
| (-/+) Provision for litigation |
51.1 |
452.7 |
(88.7) |
51.1 |
452.7 |
(88.7) |
| (-/+) Adherence to REFIS/PR |
- |
- |
|
- |
33.3 |
|
| Adjusted EBITDA FROM CONTINUING OPERATIONS |
1,483.0 |
1,347.0 |
10.1 |
5,693.4 |
5,343.8 |
6.5 |
| (-) Ebitda from discontinued Op. Compagas and UEGA |
10.6 |
80.6 |
(86.8) |
137.0 |
179.8 |
(24) |
| Adjusted EBITDA INCLUDED DISCONTINUED OPERATIONS |
1,493.6 |
1,427.6 |
4.6 |
5,830.3 |
5,523.6 |
5.6 |
| (-/+) Equity in earnings of subsidiaries |
(63.1) |
(148.5) |
(57.5) |
(307.8) |
(478.6) |
(36) |
| Adjusted EBITDA INCLUDED DISCONTINUED OP without earnings of subsidiaries |
1,430.5 |
1,279.2 |
11.8 |
5,522.5 |
5,045.0 |
9.5 |
| |
|
|
|
|
|
|
| |
|
|
|
|
|
R$'000 |
| |
4Q23 |
4Q22 |
Δ% |
2023 |
2022 |
Δ% |
| Financial Revenues |
272,666 |
232,808 |
17.1 |
1,069,116 |
956,413 |
11.8 |
| Income from investments held for trading |
173,232 |
108,872 |
59.1 |
540,672 |
406,270 |
33.1 |
| Late fees on electricity bills |
44,007 |
47,301 |
(7.0) |
200,341 |
265,818 |
(24.6) |
| Monetary restatement and adjustment to present value of accounts payable related to concession |
- |
(157) |
- |
69,059 |
2,720 |
- |
| Income from sectorial assets and liabilities |
7,040 |
48,769 |
(85.6) |
62,795 |
146,753 |
(57.2) |
| Exchange variation About Purchase Itaipu Electric Power |
3,047 |
2,572 |
18.5 |
17,073 |
43,946 |
(61.2) |
| Interest on taxes to be compensated |
38,964 |
14,026 |
177.8 |
89,938 |
63,810 |
40.9 |
| Income and monetary restatement of judicial deposits |
13,700 |
11,218 |
22.1 |
55,092 |
42,846 |
28.6 |
| Other financial revenues |
4,325 |
10,122 |
(57.3) |
75,660 |
25,748 |
193.8 |
| (-) Pis/Pasep and Cofins on revenues |
(11,649) |
(9,915) |
17.5 |
(41,514) |
(41,498) |
0.0 |
| Financial Expenses |
578,367 |
512,554 |
12.8 |
2,274,106 |
1,950,927 |
16.6 |
| Monetary variation, foreign exchange and debt service charges |
408,512 |
372,461 |
9.7 |
1,763,555 |
1,479,057 |
19.2 |
| Monetary variation and adjustment to present value of accounts payable related to concession |
38,990 |
13,936 |
179.8 |
140,214 |
142,673 |
(1.7) |
| Exchange variation About Purchase Itaipu Electric Power |
2,820 |
1,160 |
143.1 |
10,605 |
27,584 |
(61.6) |
| Pis/ Pasep and Cofins taxes over interest on equity |
30,497 |
83,532 |
(63.5) |
101,251 |
107,720 |
(6.0) |
| Income from sectorial assets and liabilities |
768 |
1,529 |
(49.8) |
4,542 |
11,208 |
(59.5) |
| Derivatives fair value - forward contract |
- |
(2,907) |
- |
- |
- |
- |
| Interest on R&D and PEE |
5,854 |
10,231 |
(42.8) |
26,009 |
33,810 |
(23.1) |
| Interest on tax installments |
8,563 |
10,753 |
(20.4) |
39,569 |
38,111 |
3.8 |
| Interest on lease liabilities |
7,033 |
5,283 |
33.1 |
24,292 |
19,441 |
25.0 |
| Monetary variation of litigation |
74,147 |
3,340 |
- |
150,140 |
33,981 |
- |
| Other financial expenses |
1,183 |
13,236 |
(91.1) |
13,929 |
57,342 |
(75.7) |
| (-) Update of provision for allocation of PIS and Cofins credits |
- |
- |
- |
- |
1,011,370 |
- |
| Financial income (expenses) |
(305,701) |
(279,746) |
9.3 |
(1,204,990) |
(2,005,884) |
(39.9) |
| Exhibit I - CONSOLIDATED RESULTS > EQUITY IN EARNINGS OF SUBSIDIARIES AND INDICATORS |
| |
|
|
|
|
|
|
|
R$'000 |
| Variation in Equity in earnings of subsidiaries |
|
4Q23 |
4Q22 |
Δ% |
2023 |
2022 |
Δ% |
| Joint Ventures |
|
|
57,819 |
142,219 |
(59.3) |
285,808 |
452,562 |
(36.8) |
| Voltalia São Miguel do Gostoso I Participações S.A. |
|
|
2,112 |
1,940 |
8.9 |
1,508 |
2,157 |
(30.1) |
| Caiuá Transmissora de Energia S.A. |
|
|
2,854 |
6,568 |
(56.5) |
12,263 |
23,806 |
(48.5) |
| Integração Maranhense Transmissora de Energia S.A. |
|
|
4,873 |
4,942 |
(1.4) |
24,218 |
32,824 |
(26.2) |
| Matrinchã Transmissora de Energia (TP NORTE) S.A. |
|
|
12,728 |
42,756 |
(70.2) |
77,493 |
162,298 |
(52.3) |
| Guaraciaba Transmissora de Energia (TP SUL) S.A. |
|
|
4,933 |
30,551 |
(83.9) |
30,871 |
82,251 |
(62.5) |
| Paranaíba Transmissora de Energia S.A. |
|
|
6,617 |
26,565 |
(75.1) |
36,269 |
47,623 |
(23.8) |
| Mata de Santa Genebra Transmissão S.A. |
|
|
12,861 |
15,495 |
(17.0) |
58,262 |
56,140 |
3.8 |
| Cantareira Transmissora de Energia S.A. |
|
|
10,799 |
13,494 |
(20.0) |
44,563 |
45,293 |
(1.6) |
| Solar Paraná |
|
|
42 |
(92) |
- |
361 |
170 |
112.4 |
| Associates |
|
|
5,315 |
6,243 |
(14.9) |
22,001 |
26,015 |
(15.4) |
| Dona Francisca Energética S.A. |
|
|
1,162 |
734 |
58.3 |
5,353 |
5,648 |
(5.2) |
| Foz do Chopim Energética Ltda. |
|
|
4,155 |
5,510 |
(24.6) |
16,651 |
20,370 |
(18.3) |
| Others ¹ |
|
|
(2) |
(1) |
- |
(3) |
(3) |
- |
| TOTAL |
|
|
63,134 |
148,462 |
(57.5) |
307,809 |
478,577 |
(35.7) |
| 1 Includes Carbocampel S.A. |
|
|
|
|
|
| |
|
|
|
|
|
|
|
|
| |
|
|
|
|
|
|
|
R$'000 |
| Main Indicators -Associates Dec-23 |
|
|
|
|
Dona Francisca |
Foz do Chopim |
| Total assets |
|
|
|
|
|
170,927 |
|
47,069 |
| Shareholder’s equity¹ |
|
|
|
|
|
133,787 |
|
45,047 |
| Net operating revenue |
|
|
|
|
|
66,166 |
|
60,593 |
| Net Income |
|
|
|
|
|
23,243 |
|
46,547 |
| Participation in the enterprise - % |
|
|
|
|
|
23.0 |
|
35.8 |
| Investment book value |
|
|
|
|
|
30,812 |
|
16,113 |
| |
|
|
|
|
|
|
|
R$'000 |
Main Indicators -Joint ventures
Dec-23 |
Voltalia |
Caiuá |
Integração Maranhense |
Matrinchã |
Guaraciaba |
Paranaíba |
Mata de Santa Genebra |
Cantareira |
| Total assets |
239,779 |
335,003 |
585,668 |
2,984,765 |
1,611,484 |
2,047,430 |
3,768,174 |
1,799,642 |
| Shareholder’s equity¹ |
239,762 |
271,578 |
432,775 |
2,030,613 |
1,004,252 |
1,191,925 |
1,470,430 |
955,738 |
| Net operating revenue |
- |
36,562 |
63,370 |
313,948 |
165,557 |
282,153 |
393,463 |
177,852 |
| Net Income |
3,075 |
25,025 |
49,420 |
158,149 |
63,003 |
148,036 |
116,292 |
90,945 |
| Participation in the enterprise - % |
49.0 |
49.0 |
49.0 |
49.0 |
49.0 |
24.5 |
50.1 |
49.0 |
| Investment book value |
117,484 |
133,074 |
212,060 |
994,999 |
492,083 |
292,022 |
736,685 |
468,311 |
| Note: Income from Transmitters according to adjustments for the application of CPC 47 / IFRS 15 in the Corporate Statements. |
|
|
|
| Exhibit I - CONSOLIDATED RESULTS > SHARE CAPITAL |
| Share Capital - As of December, 31,2023 * |
| |
|
|
|
|
|
|
|
|
Thousand shares |
| Shareholders |
Common |
% |
Preferred "A" |
% |
Preferred "B" |
% |
Special ** |
TOTAL |
% |
| State of Paraná |
358,563 |
27.6% |
- |
- |
116,081 |
6.9% |
<1 |
474,644 |
15.9% |
| BNDESPAR |
131,161 |
10.1% |
- |
- |
524,646 |
31.2% |
- |
655,807 |
22.0% |
| Free Floating |
807,456 |
62.1% |
686 |
21.9% |
1,037,615 |
61.8% |
- |
1,845,757 |
61.9% |
| B3 |
782,255 |
60.2% |
686 |
21.9% |
935,818 |
55.7% |
- |
1,718,759 |
57.6% |
| NYSE |
24,993 |
1.9% |
- |
- |
99,992 |
6.0% |
- |
124,985 |
4.2% |
| LATIBEX |
208 |
0.0% |
- |
- |
1,805 |
0.1% |
- |
2,013 |
0.1% |
| Other |
3,167 |
0.2% |
2,442 |
78.1% |
993 |
0.1% |
- |
6,602 |
0.2% |
| TOTAL |
1,300,347 |
100% |
3,128 |
100% |
1,679,335 |
100% |
<1 |
2,982,810 |
100% |
| * The 209th Extraordinary General Assembly approved the undoing of the UNITS Program, ending in December/23. |
|
|
|
|
|
| ** State of Paraná has a special class preferred share with veto power as established in the Statute. |
|
|
|
|
|
|

| Exhibit II- RESULT BY SUBSIDIARY > COPEL GET (CONSOLIDATED) |
| |
|
|
|
R$'000 |
| Income Statement |
4Q23 |
4Q22 |
Δ% |
2023 |
2022 |
Δ% |
| OPERATING REVENUES |
1,215,688 |
1,233,631 |
(1.5) |
5,117,723 |
4,941,152 |
3.6 |
| Electricity sales to final customers |
- |
- |
- |
- |
103 |
- |
| Electricity sales to distributors |
967,208 |
964,636 |
0.3 |
4,022,079 |
3,784,322 |
6.3 |
| Use of the main transmission grid |
222,697 |
238,580 |
(6.7) |
966,844 |
991,174 |
(2.5) |
| Construction revenue |
19,080 |
17,773 |
7.4 |
99,248 |
116,112 |
(14.5) |
| Other operating revenues |
6,703 |
12,642 |
(47.0) |
29,552 |
49,441 |
(40.2) |
| OPERATING COSTS AND EXPENSES |
(493,088) |
(659,147) |
(25.2) |
(2,771,944) |
(2,626,709) |
5.5 |
| Electricity purchased for resale |
(45,326) |
(93,582) |
(51.6) |
(216,565) |
(377,716) |
(42.7) |
| Charges of main distribution and transmission grid |
(147,082) |
(141,459) |
4.0 |
(589,428) |
(533,591) |
10.5 |
| Personnel and management |
(102,810) |
(81,054) |
26.8 |
(604,808) |
(319,740) |
89.2 |
| Pension and healthcare plans |
(20,605) |
(19,732) |
4.4 |
(81,704) |
(79,056) |
3.3 |
| Materials and supplies |
(11,454) |
(4,719) |
142.7 |
(26,246) |
(17,640) |
48.8 |
| Materials and supplies for power eletricity |
- |
(6,398) |
- |
(17,654) |
(9,349) |
88.8 |
| Third-party services |
(68,661) |
(56,126) |
22.3 |
(269,711) |
(207,486) |
30.0 |
| Depreciation and amortization |
(209,179) |
(189,560) |
10.3 |
(820,188) |
(743,375) |
10.3 |
| Provisions and reversals |
214,454 |
29,335 |
- |
159,214 |
11,461 |
- |
| Construction cost |
(16,646) |
(9,314) |
78.7 |
(85,181) |
(89,166) |
(4.5) |
| Renegotiation of Hydrological Risk - GSF - HPP Mauá |
(26,405) |
- |
- |
- |
- |
- |
| Other cost and expenses |
(59,374) |
(86,538) |
(0.3) |
(219,673) |
(261,051) |
(0.2) |
| EQUITY IN EARNINGS OF SUBSIDIARIES |
59,820 |
145,882 |
(59.0) |
300,589 |
470,606 |
(36.1) |
| PROFIT BEFORE FINANCIAL RESULTS AND TAXES |
782,420 |
720,366 |
8.6 |
2,646,368 |
2,785,049 |
(5.0) |
| FINANCIAL RESULTS |
(163,680) |
(160,462) |
2.0 |
(747,409) |
(636,045) |
17.5 |
| Financial income |
78,511 |
71,561 |
9.7 |
334,020 |
257,977 |
29.5 |
| Financial expenses |
(242,191) |
(232,023) |
4.4 |
(1,081,429) |
(894,022) |
21.0 |
| OPERATIONAL EXPENSES/ INCOME |
618,740 |
559,904 |
10.5 |
1,898,959 |
2,149,004 |
(11.6) |
| INCOME TAX AND SOCIAL CONTRIBUTION ON PROFIT |
(101,978) |
121,019 |
|
(264,614) |
(295,404) |
(10.4) |
| Income tax and social contribution on profit |
(58,592) |
109,503 |
|
(247,136) |
(212,852) |
16.1 |
| Deferred income tax and social contribution on profit |
(43,386) |
11,516 |
|
(17,478) |
(82,552) |
(78.8) |
| NET INCOME continuing operations |
516,762 |
680,923 |
(24.1) |
1,634,345 |
1,853,600 |
(11.8) |
| NET INCOME discontinued operations |
282,281 |
(179,713) |
|
66,176 |
(254,141) |
|
| NET INCOME |
799,043 |
501,210 |
59.4 |
1,700,521 |
1,599,459 |
6.3 |
| Attributed to shareholders of the parent company - continuing operations |
523,341 |
680,186 |
(23.1) |
1,651,036 |
1,866,955 |
(11.6) |
| Attributed to the controlling company's shareholders - discontinued operations |
167,900 |
(108,992) |
|
30,134 |
(162,903) |
|
| Attributed to non-controlling shareholders |
107,802 |
(69,984) |
|
19,351 |
(104,593) |
|
| EBITDA continuing operations |
991,599 |
909,926 |
9.0 |
3,165,967 |
3,057,818 |
3.5 |
| Exhibit II- RESULT BY SUBSIDIARY > COPEL DIS |
| |
|
|
|
R$'000 |
| Income Statement |
4Q23 |
4Q22 |
Δ% |
2023 |
2022 |
Δ% |
| OPERATING REVENUES |
4,016,174 |
3,587,443 |
12.0 |
15,085,707 |
13,903,300 |
8.5 |
| Electricity sales to final customers |
1,613,874 |
1,208,415 |
33.6 |
5,663,429 |
5,236,339 |
8.2 |
| Electricity sales to distributors |
24,369 |
63,535 |
(61.6) |
164,825 |
266,991 |
(38.3) |
| Use of the main distribution grid |
1,550,506 |
1,155,062 |
34.2 |
5,468,715 |
4,221,011 |
29.6 |
| Construction revenue |
568,580 |
554,567 |
2.5 |
2,234,539 |
2,048,022 |
9.1 |
| Fair value of assets from the indemnity for the concession |
20,269 |
34,124 |
(40.6) |
62,167 |
79,169 |
(21.5) |
| Sectorial assets and liabilities result |
91,494 |
467,880 |
(80.4) |
971,203 |
1,676,936 |
(42.1) |
| Other operating revenues |
147,082 |
103,860 |
41.6 |
520,829 |
374,832 |
38.9 |
| OPERATING COSTS AND EXPENSES |
(3,552,826) |
(3,265,136) |
8.8 |
(13,983,117) |
(13,418,798) |
4.2 |
| Electricity purchased for resale |
(1,585,200) |
(1,546,763) |
2.5 |
(6,074,752) |
(5,980,124) |
1.6 |
| Charges of main transmission grid |
(743,458) |
(579,074) |
28.4 |
(2,715,273) |
(2,313,203) |
17.4 |
| Personnel and management |
(191,156) |
(153,742) |
24.3 |
(1,174,906) |
(599,121) |
96.1 |
| Pension and healthcare plans |
(42,400) |
(42,215) |
0.4 |
(167,533) |
(169,493) |
(1.2) |
| Materials and supplies |
(25,544) |
(21,243) |
20.2 |
(74,501) |
(71,302) |
4.5 |
| Third-party services |
(176,368) |
(143,126) |
23.2 |
(643,999) |
(505,407) |
27.4 |
| Depreciation and amortization |
(135,744) |
(119,638) |
13.5 |
(521,301) |
(454,307) |
14.7 |
| Provisions and reversals |
(54,646) |
(70,190) |
(22.1) |
(201,083) |
(281,895) |
(28.7) |
| Construction cost |
(568,580) |
(554,567) |
2.5 |
(2,234,539) |
(2,048,022) |
9.1 |
| Other cost and expenses |
(29,730) |
(34,577) |
(14.0) |
(175,230) |
(185,361) |
(5.5) |
| Provision for allocation of PIS and Cofins |
- |
- |
- |
- |
(810,563) |
- |
| PROFIT BEFORE FINANCIAL RESULTS AND TAXES |
463,348 |
322,306 |
43.8 |
1,102,590 |
484,502 |
127.6 |
| FINANCIAL RESULTS |
(144,134) |
(62,536) |
130.5 |
(475,102) |
(1,169,741) |
(59.4) |
| Financial income |
115,304 |
138,255 |
(16.6) |
479,944 |
593,726 |
(19.2) |
| Financial expenses |
(259,438) |
(200,791) |
29.2 |
(955,046) |
(752,097) |
27.0 |
| Update of provision for allocation of PIS and Cofins credits |
- |
- |
- |
- |
(1,011,370) |
- |
| OPERATIONAL EXPENSES/ INCOME |
319,214 |
259,770 |
22.9 |
627,488 |
(685,239) |
- |
| INCOME TAX AND SOCIAL CONTRIBUTION ON PROFIT |
(55,924) |
64,497 |
- |
(58,368) |
455,465 |
- |
| Income tax and social contribution on profit |
(12,255) |
42,283 |
- |
(87,394) |
(130,102) |
(32.8) |
| Deferred income tax and social contribution on profit |
(43,669) |
22,214 |
- |
29,026 |
585,567 |
(95.0) |
| NET INCOME (LOSS) |
263,290 |
324,267 |
(18.8) |
569,120 |
(229,774) |
- |
| EBITDA |
599,092 |
441,945 |
35.6 |
1,623,891 |
938,809 |
73.0 |
| Exhibit II- RESULT BY SUBSIDIARY > COPEL COM (MERCADO LIVRE) |
| |
|
|
|
R$'000 |
| Income Statement |
4Q23 |
4Q22 |
Δ% |
2023 |
2022 |
Δ% |
| OPERATING REVENUES |
1,037,173 |
1,279,343 |
(18.9) |
4,056,904 |
4,938,368 |
(17.8) |
| Electricity sales to final customers |
579,008 |
555,071 |
4.3 |
2,284,271 |
2,275,872 |
0.4 |
| Electricity sales to distributors |
454,267 |
688,188 |
(34.0) |
1,761,200 |
2,620,535 |
(32.8) |
| Other operating revenues |
3,898 |
36,084 |
(89.2) |
11,433 |
41,961 |
(72.8) |
| OPERATING COSTS AND EXPENSES |
(1,016,478) |
(1,217,361) |
(16.5) |
(3,948,287) |
(4,814,710) |
(18.0) |
| Electricity purchased for resale |
(1,007,473) |
(1,211,291) |
(16.8) |
(3,908,484) |
(4,790,427) |
(18.4) |
| Personnel and management |
(3,670) |
(3,471) |
5.7 |
(21,133) |
(12,712) |
66.2 |
| Pension and healthcare plans |
(454) |
(458) |
(1.0) |
(1,877) |
(1,787) |
5.0 |
| Materials and supplies |
(17) |
(17) |
(0.1) |
(77) |
(53) |
45.3 |
| Third-party services |
(503) |
(479) |
5.0 |
(3,389) |
(2,665) |
27.2 |
| Depreciation and amortization |
(439) |
(99) |
346.0 |
(2,003) |
(353) |
467.4 |
| Provisions and reversals |
(672) |
(220) |
204.8 |
(3,927) |
(1,724) |
127.8 |
| Other cost and expenses |
(3,251) |
(1,326) |
145.1 |
(7,396) |
(4,989) |
48.2 |
| PROFIT BEFORE FINANCIAL RESULTS AND TAXES |
20,696 |
61,981 |
(66.6) |
108,618 |
123,658 |
(12.2) |
| FINANCIAL RESULTS |
10,127 |
9,120 |
11.0 |
37,861 |
32,376 |
16.9 |
| Financial income |
10,579 |
9,175 |
15.3 |
38,577 |
32,667 |
18.1 |
| Financial expenses |
(453) |
(55) |
723.6 |
(717) |
(291) |
146.4 |
| OPERATIONAL EXPENSES/ INCOME |
30,822 |
71,101 |
(56.7) |
146,479 |
156,034 |
(6.1) |
| INCOME TAX AND SOCIAL CONTRIBUTION ON PROFIT |
(6,148) |
(21,229) |
(71.0) |
(40,928) |
(47,659) |
(14.1) |
| Income tax and social contribution on profit |
(2,569) |
(6,214) |
(58.7) |
(30,418) |
(25,081) |
21.3 |
| Deferred income tax and social contribution on profit |
(3,579) |
(15,015) |
(76.2) |
(10,510) |
(22,578) |
(53.5) |
| NET INCOME (LOSS) |
24,675 |
49,872 |
(50.5) |
105,550 |
108,375 |
(2.6) |
| EBITDA |
21,135 |
62,080 |
(66.0) |
110,620 |
124,011 |
(10.8) |
| Exhibit II- RESULT BY SUBSIDIARY > INCOME STATEMENT FOR THE QUARTER BY COMPANY |
| R$'000 |
| Income Statement 4Q23 |
GET |
Distribuição |
Compagas |
Elejor |
UEG Araucária |
Serviços |
Wind Farms |
FDA |
Bela Vista |
C. Oeste, Marumbi, Uirapuru |
Mercado Livre |
Holding |
Elimination |
Consolidated |
| Geração |
Transmissão |
| NET OPERATING INCOME |
630,506 |
230,996 |
4,016,174 |
212,824 |
34,465 |
- |
- |
172,135 |
172,465 |
6,804 |
19,547 |
1,037,173 |
- |
(965,391) |
5,567,698 |
| Electricity sales to final customers |
6 |
(6) |
1,613,874 |
- |
- |
- |
- |
- |
- |
- |
- |
579,008 |
- |
(391) |
2,192,491 |
| Electricity sales to distributors |
615,810 |
- |
24,369 |
- |
34,377 |
- |
- |
172,135 |
172,459 |
6,804 |
- |
454,267 |
- |
(616,143) |
864,078 |
| Use of the main distribution and transmission grid (TUSD/ TUST) |
- |
205,764 |
1,550,506 |
- |
- |
- |
- |
- |
- |
- |
19,503 |
- |
- |
(121,571) |
1,654,202 |
| Construction revenue |
- |
19,043 |
568,580 |
6,822 |
- |
- |
- |
- |
- |
- |
37 |
- |
- |
(6,822) |
587,660 |
| Fair value of assets from the indemnity for the concession |
- |
- |
20,269 |
- |
- |
- |
- |
- |
- |
- |
- |
- |
- |
- |
20,269 |
| Distribution of piped gas |
- |
- |
- |
206,002 |
- |
- |
- |
- |
- |
- |
- |
- |
- |
(206,002) |
- |
| Sectoral assets and liabilities result |
- |
- |
91,494 |
- |
- |
- |
- |
- |
- |
- |
- |
- |
- |
- |
91,494 |
| Other operating revenues |
14,690 |
6,195 |
147,082 |
- |
88 |
- |
- |
- |
6 |
- |
7 |
3,898 |
- |
(14,462) |
157,504 |
| OPERATING COSTS AND EXPENSES |
(178,298) |
(71,020) |
(3,552,826) |
(184,753) |
(23,776) |
221,574 |
(1,779) |
(141,265) |
(96,852) |
(9,211) |
(2,595) |
(1,016,478) |
(105,281) |
717,468 |
(4,445,091) |
| Energy purchased for resale |
(26,952) |
(14,741) |
(1,585,200) |
- |
(25) |
(3,282) |
- |
(3,633) |
- |
- |
- |
(1,007,473) |
- |
619,242 |
(2,022,064) |
| Charges of the main distribution and transmission grid |
(92,034) |
- |
(743,458) |
- |
(6,236) |
(8,962) |
- |
(16,861) |
(40,211) |
(347) |
- |
- |
- |
129,887 |
(778,222) |
| Personnel and management |
(54,172) |
(41,749) |
(191,156) |
(10,421) |
(1,176) |
(1,770) |
(47) |
(5,555) |
(773) |
(305) |
(256) |
(3,670) |
(17,783) |
12,191 |
(316,642) |
| Private pension and health plans |
(11,458) |
(8,347) |
(42,400) |
(1,716) |
(56) |
(214) |
(8) |
(652) |
(92) |
(25) |
(31) |
(454) |
(2,428) |
1,930 |
(65,950) |
| Materials and supplies |
(2,518) |
(1,331) |
(25,544) |
(503) |
(58) |
(8) |
(212) |
(3,614) |
(572) |
(3,324) |
(93) |
(17) |
(636) |
514 |
(37,916) |
| Materials and supplies for power eletricity |
- |
- |
- |
- |
- |
(428) |
- |
- |
- |
- |
- |
- |
- |
428 |
- |
| Natural gas and supplies for gas business |
- |
- |
- |
(145,206) |
- |
- |
- |
- |
- |
- |
- |
- |
- |
145,206 |
- |
| Third-party services |
(27,216) |
(13,199) |
(176,368) |
(3,764) |
(3,913) |
(5,010) |
(1,212) |
(30,613) |
(4,718) |
(2,253) |
(1,760) |
(503) |
(18,326) |
20,894 |
(267,960) |
| Depreciation and amortization |
(94,000) |
(4,182) |
(135,744) |
(10,781) |
(8,467) |
(5,156) |
(211) |
(68,883) |
(32,037) |
(2,718) |
(10) |
(439) |
(767) |
8,588 |
(354,808) |
| Provisions and reversals |
185,768 |
24,771 |
(54,646) |
(1,150) |
- |
248,283 |
- |
3,933 |
(48) |
(1) |
(82) |
(672) |
(58,999) |
(234,620) |
112,537 |
| Construction cost |
- |
(16,609) |
(568,580) |
(6,822) |
- |
- |
- |
- |
- |
- |
(37) |
- |
- |
6,822 |
(585,226) |
| Renegotiation of Hydrological Risk - GSF - HPP Mauá |
(26,405) |
- |
- |
- |
- |
- |
- |
- |
- |
- |
- |
- |
- |
- |
(26,405) |
| Other operating costs and expenses |
(29,311) |
4,367 |
(29,730) |
(4,390) |
(3,845) |
(1,879) |
(89) |
(15,387) |
(18,401) |
(238) |
(326) |
(3,251) |
(6,342) |
6,386 |
(102,435) |
| EQUITY IN EARNINGS OF SUBSIDIARIES |
45,912 |
72,987 |
- |
- |
- |
- |
- |
15,070 |
- |
- |
- |
- |
812,988 |
(883,823) |
63,134 |
| EARNINGS BEFORE INCOME TAXES |
498,120 |
232,963 |
463,348 |
28,071 |
10,689 |
221,574 |
(1,779) |
45,940 |
75,613 |
(2,407) |
16,952 |
20,696 |
707,707 |
(1,131,746) |
1,185,740 |
| FINANCIAL RESULTS |
(94,652) |
(53,124) |
(144,134) |
(2,586) |
(33,348) |
(1,442) |
(23) |
(24,249) |
8,865 |
869 |
1,642 |
10,127 |
31,683 |
(5,328) |
(305,701) |
| Financial income |
25,590 |
12,903 |
115,304 |
11,687 |
4,647 |
602 |
138 |
30,901 |
9,039 |
876 |
2,233 |
10,579 |
69,812 |
(21,645) |
272,666 |
| Financial expenses |
(120,242) |
(66,027) |
(259,438) |
(14,273) |
(37,995) |
(2,044) |
(161) |
(55,150) |
(174) |
(7) |
(591) |
(453) |
(38,129) |
16,317 |
(578,367) |
| OPERATIONAL EXPENSES / INCOME |
403,468 |
179,839 |
319,214 |
25,485 |
(22,659) |
220,132 |
(1,802) |
21,691 |
84,478 |
(1,538) |
18,594 |
30,822 |
739,390 |
(1,137,074) |
880,039 |
| INCOME TAX AND SOCIAL CONTRIBUTION ON PROFIT |
(45,171) |
(14,794) |
(55,923) |
2,489 |
5,186 |
50,409 |
- |
(16,367) |
(26,152) |
(510) |
(1,388) |
(6,148) |
(102,129) |
(50,499) |
(260,998) |
| NET INCOME continuing operations |
358,297 |
165,045 |
263,291 |
27,974 |
(17,473) |
270,541 |
(1,802) |
5,324 |
58,326 |
(2,048) |
17,206 |
24,675 |
637,261 |
(1,187,573) |
619,041 |
| NET INCOME discontinued operations |
167,900 |
- |
- |
- |
- |
- |
- |
- |
- |
- |
- |
- |
241,762 |
(85,895) |
323,767 |
| NET INCOME |
526,197 |
165,045 |
263,291 |
27,974 |
(17,473) |
270,541 |
(1,802) |
5,324 |
58,326 |
(2,048) |
17,206 |
24,675 |
879,023 |
(1,273,468) |
942,808 |
| Attributed to shareholders of the parent company - continuing operations |
358,298 |
165,045 |
263,291 |
- |
(12,231) |
- |
(1,802) |
5,324 |
58,326 |
(2,048) |
17,206 |
24,675 |
805,160 |
(1,043,981) |
637,260 |
| Attributed to the controlling company's shareholders - discontinued operations |
167,899 |
- |
- |
14,267 |
- |
219,679 |
- |
- |
- |
- |
- |
- |
73,863 |
(233,942) |
241,762 |
| Attributed to non-controlling shareholders - continuing operations |
- |
- |
- |
- |
(5,241) |
- |
- |
- |
- |
- |
- |
- |
- |
- |
(5,241) |
| Attributed to non-controlling shareholders - discontinued operations |
- |
- |
- |
13,707 |
- |
50,862 |
- |
- |
- |
- |
- |
- |
- |
4,455 |
69,027 |
| EBITDA continuing operations |
592,120 |
237,145 |
599,092 |
38,852 |
19,156 |
226,730 |
(1,568) |
114,823 |
107,650 |
311 |
16,962 |
21,135 |
708,474 |
(1,140,334) |
1,540,548 |
| |
|
|
|
|
|
|
|
|
|
|
|
|
|
|
|
| R$'000 |
| Income Statement 4Q22 |
GET |
Distribuição |
Compagas |
Elejor |
UEG Araucária |
Serviços |
Wind Farms |
FDA |
Bela Vista |
C. Oeste, Marumbi, Uirapuru |
Mercado Livre |
Holding |
Elimination |
Consolidated |
| Geração |
Transmissão |
| NET OPERATING INCOME |
639,697 |
247,032 |
3,587,443 |
361,872 |
44,254 |
33 |
- |
152,943 |
185,827 |
7,722 |
16,567 |
1,279,343 |
- |
(1,257,953) |
5,264,780 |
| Electricity sales to final customers |
- |
- |
1,208,415 |
- |
- |
- |
- |
- |
- |
- |
- |
555,071 |
- |
(386) |
1,763,100 |
| Electricity sales to distributors |
619,824 |
- |
63,535 |
- |
44,019 |
33 |
- |
151,267 |
185,823 |
7,722 |
- |
688,188 |
- |
(778,914) |
981,497 |
| Use of the main distribution and transmission grid (TUSD/ TUST) |
- |
224,262 |
1,155,062 |
- |
- |
- |
- |
- |
- |
- |
16,753 |
- |
- |
(99,641) |
1,296,436 |
| Construction revenue |
- |
17,965 |
554,567 |
2,985 |
- |
- |
- |
- |
- |
- |
(192) |
- |
- |
(2,985) |
572,340 |
| Fair value of assets from the indemnity for the concession |
- |
- |
34,124 |
(2,059) |
- |
- |
- |
- |
- |
- |
- |
- |
- |
2,059 |
34,124 |
| Distribution of piped gas |
- |
- |
- |
349,468 |
- |
- |
- |
- |
- |
- |
- |
- |
- |
(349,468) |
- |
| Sectoral assets and liabilities result |
- |
- |
467,880 |
- |
- |
- |
- |
- |
- |
- |
- |
- |
- |
(0) |
467,880 |
| Other operating revenues |
19,873 |
4,805 |
103,860 |
11,478 |
235 |
- |
- |
1,676 |
4 |
- |
6 |
36,084 |
- |
(28,618) |
149,403 |
| OPERATING COSTS AND EXPENSES |
(393,183) |
(60,640) |
(3,265,138) |
(277,205) |
(22,417) |
(169,217) |
(809) |
(113,191) |
(99,846) |
(4,959) |
(2,130) |
(1,217,362) |
(463,864) |
1,324,465 |
(4,765,496) |
| Energy purchased for resale |
(93,096) |
- |
(1,546,763) |
- |
(18) |
- |
- |
(502) |
309 |
(309) |
- |
(1,211,291) |
- |
778,883 |
(2,072,787) |
| Charges of the main distribution and transmission grid |
(91,007) |
- |
(579,074) |
- |
(5,744) |
(8,706) |
- |
(13,218) |
(39,212) |
(330) |
- |
- |
- |
108,022 |
(629,269) |
| Personnel and management |
(45,142) |
(30,156) |
(153,742) |
(9,921) |
(1,145) |
(1,717) |
- |
(4,260) |
(829) |
(396) |
(271) |
(3,472) |
(10,313) |
11,638 |
(249,726) |
| Private pension and health plans |
(11,620) |
(7,561) |
(42,215) |
(1,196) |
(79) |
(162) |
- |
(418) |
(83) |
(22) |
(28) |
(458) |
(2,002) |
1,359 |
(64,485) |
| Materials |
(3,133) |
(1,137) |
(21,243) |
(560) |
(53) |
(7) |
(2) |
(48) |
(310) |
(9) |
(81) |
(16) |
(325) |
566 |
(26,358) |
| Raw material and supplies - energy production |
(9,349) |
- |
- |
- |
- |
(1,212) |
- |
- |
- |
- |
- |
- |
- |
1,212 |
(9,349) |
| Natural gas and supplies for gas business |
- |
- |
- |
(237,592) |
- |
- |
- |
- |
- |
- |
- |
- |
- |
237,592 |
- |
| Third-party services |
(20,912) |
(9,135) |
(143,127) |
(2,908) |
(4,834) |
(20,126) |
(384) |
(23,601) |
(11,050) |
(704) |
(1,649) |
(479) |
(9,340) |
38,624 |
(209,625) |
| Depreciation and amortization |
(93,895) |
(3,360) |
(119,638) |
(12,473) |
(7,744) |
(5,914) |
(545) |
(55,319) |
(31,897) |
(2,800) |
(7) |
(98) |
(632) |
16,107 |
(318,215) |
| Provisions and reversals |
35,083 |
(3,847) |
(70,188) |
(697) |
- |
(108,207) |
63 |
(1,807) |
(1) |
(91) |
(2) |
(220) |
(436,315) |
95,262 |
(490,967) |
| Construction cost |
- |
(9,506) |
(554,567) |
(2,985) |
- |
- |
- |
- |
- |
- |
192 |
- |
- |
2,985 |
(563,881) |
| Other operating costs and expenses |
(60,112) |
4,062 |
(34,581) |
(8,873) |
(2,800) |
(23,166) |
59 |
(14,018) |
(16,773) |
(298) |
(284) |
(1,328) |
(4,937) |
32,215 |
(130,834) |
| PROVISION FOR ALLOCATION OF PIS/COFINS CREDITS |
- |
- |
- |
- |
- |
- |
- |
- |
- |
- |
- |
- |
- |
- |
- |
| EQUITY IN EARNINGS OF SUBSIDIARIES |
132,889 |
154,995 |
- |
- |
- |
- |
- |
54,728 |
- |
- |
- |
- |
1,065,020 |
(1,259,170) |
148,462 |
| EARNINGS BEFORE INCOME TAXES |
379,403 |
341,387 |
322,305 |
84,667 |
21,837 |
(169,184) |
(809) |
94,480 |
85,981 |
2,763 |
14,437 |
61,981 |
601,156 |
(1,192,658) |
647,746 |
| FINANCIAL RESULTS |
(97,607) |
(55,426) |
(62,536) |
8,620 |
(6,367) |
1,161 |
(183) |
12,886 |
7,146 |
574 |
1,285 |
9,120 |
(59,318) |
(39,101) |
(279,746) |
| Financial income |
22,680 |
11,781 |
138,255 |
17,187 |
5,882 |
2,854 |
150 |
33,694 |
7,275 |
574 |
2,036 |
9,175 |
8,733 |
(27,468) |
232,808 |
| Financial expenses |
(120,287) |
(67,207) |
(200,791) |
(8,567) |
(12,249) |
(1,693) |
(333) |
(20,808) |
(129) |
- |
(751) |
(55) |
(68,051) |
(11,633) |
(512,554) |
| Provision for allocation of PIS/COFINS credits update |
- |
- |
- |
- |
- |
- |
- |
- |
- |
- |
- |
- |
- |
- |
- |
| OPERATIONAL EXPENSES / INCOME |
281,796 |
285,961 |
259,769 |
93,287 |
15,470 |
(168,023) |
(992) |
107,366 |
93,127 |
3,337 |
15,722 |
71,101 |
541,838 |
(1,231,759) |
368,000 |
| INCOME TAX AND SOCIAL CONTRIBUTION ON PROFIT |
99,078 |
67,264 |
64,498 |
(27,842) |
(2,774) |
(10,945) |
- |
(14,907) |
(29,475) |
(436) |
(1,219) |
(21,228) |
205,251 |
39,501 |
366,766 |
| NET INCOME continuing operations |
380,874 |
353,225 |
324,267 |
179,202 |
12,696 |
(267,492) |
(992) |
92,459 |
63,652 |
2,901 |
14,503 |
49,873 |
747,089 |
(1,217,491) |
734,766 |
| NET INCOME discontinued operations |
(162,903) |
- |
- |
(113,757) |
- |
88,524 |
- |
- |
- |
- |
- |
- |
(125,812) |
202,692 |
(111,256) |
| NET INCOME |
217,971 |
353,225 |
324,267 |
65,445 |
12,696 |
(178,968) |
(992) |
92,459 |
63,652 |
2,901 |
14,503 |
49,873 |
621,277 |
(1,014,798) |
623,510 |
| Attributed to shareholders of the parent company - continuing operations |
380,874 |
353,225 |
324,267 |
- |
8,887 |
- |
(992) |
92,459 |
63,652 |
2,901 |
14,503 |
49,873 |
584,185 |
(1,140,611) |
733,224 |
| Attributed to the controlling company's shareholders - discontinued operations |
(162,903) |
- |
- |
33,377 |
- |
(145,323) |
- |
- |
- |
- |
- |
- |
37,092 |
125,810 |
(111,947) |
| Attributed to non-controlling shareholders - continuing operations |
- |
- |
- |
- |
3,809 |
- |
- |
- |
- |
- |
- |
- |
- |
- |
3,809 |
| Attributed to non-controlling shareholders - discontinued operations |
- |
- |
- |
32,069 |
- |
(33,645) |
- |
- |
- |
- |
- |
- |
- |
- |
(1,576) |
| EBITDA continuing operations |
473,298 |
344,747 |
441,943 |
97,140 |
29,581 |
(163,270) |
(264) |
149,799 |
117,878 |
5,563 |
14,444 |
62,079 |
601,788 |
(1,208,765) |
965,961 |
| Exhibit II- RESULT BY SUBSIDIARY > INCOME STATEMENT BY COMPANY ACCUMULATED |
| R$'000 |
| Income Statement 2023 |
GET |
Distribuição |
Compagas |
Elejor |
UEG Araucária |
Serviços |
Wind Farms |
FDA |
Bela Vista |
C. Oeste, Marumbi, Uirapuru |
Mercado Livre |
Holding |
Elimination |
Consolidated |
| Geração |
Transmissão |
| NET OPERATING INCOME |
2,523,737 |
1,034,167 |
15,085,707 |
978,581 |
140,757 |
- |
- |
782,111 |
755,449 |
29,754 |
67,695 |
4,056,904 |
- |
(3,975,394) |
21,479,468 |
| Electricity sales to final customers |
6 |
(6) |
5,663,429 |
- |
- |
- |
- |
- |
- |
- |
- |
2,284,271 |
- |
(1,532) |
7,946,168 |
| Electricity sales to distributors |
2,463,377 |
- |
164,825 |
- |
139,968 |
- |
- |
781,534 |
755,433 |
29,754 |
- |
1,761,200 |
- |
(2,493,303) |
3,602,788 |
| Use of the main distribution and transmission grid (TUSD/ TUST) |
- |
908,902 |
5,468,715 |
- |
- |
- |
- |
- |
- |
- |
67,969 |
- |
- |
(443,394) |
6,002,192 |
| Construction revenue |
- |
99,549 |
2,234,539 |
17,010 |
- |
- |
- |
- |
- |
- |
(301) |
- |
- |
(17,010) |
2,333,787 |
| Fair value of assets from the indemnity for the concession |
- |
- |
62,167 |
- |
- |
- |
- |
- |
- |
- |
- |
- |
- |
- |
62,167 |
| Distribution of piped gas |
- |
- |
- |
961,567 |
- |
- |
- |
- |
- |
- |
- |
- |
- |
(961,567) |
- |
| Sectoral assets and liabilities result |
- |
- |
971,203 |
- |
- |
- |
- |
- |
- |
- |
- |
- |
- |
- |
971,203 |
| Other operating revenues |
60,354 |
25,722 |
520,829 |
4 |
789 |
- |
- |
577 |
16 |
- |
27 |
11,433 |
- |
(58,588) |
561,163 |
| OPERATING COSTS AND EXPENSES |
(1,336,235) |
(477,353) |
(13,983,117) |
(814,455) |
(92,793) |
4,674 |
(2,606) |
(532,931) |
(432,953) |
(23,618) |
(9,417) |
(3,948,287) |
(216,087) |
3,772,614 |
(18,092,563) |
| Energy purchased for resale |
(123,926) |
(14,741) |
(6,074,752) |
- |
(1,073) |
(3,282) |
- |
(23,261) |
(61,983) |
(673) |
- |
(3,908,484) |
- |
2,495,985 |
(7,716,190) |
| Charges of the main distribution and transmission grid |
(373,875) |
- |
(2,715,273) |
- |
(24,149) |
(35,362) |
- |
(64,281) |
(159,227) |
(1,335) |
- |
- |
- |
476,792 |
(2,896,710) |
| Personnel and management |
(334,294) |
(246,379) |
(1,174,906) |
(43,201) |
(4,991) |
(6,381) |
(62) |
(18,779) |
(3,036) |
(1,306) |
(1,014) |
(21,133) |
(72,432) |
49,582 |
(1,878,332) |
| Private pension and health plans |
(46,035) |
(32,882) |
(167,533) |
(6,222) |
(196) |
(733) |
(10) |
(2,214) |
(356) |
(96) |
(121) |
(1,877) |
(8,839) |
6,955 |
(260,159) |
| Materials and supplies |
(10,932) |
(5,374) |
(74,501) |
(1,574) |
(248) |
(40) |
(212) |
(4,725) |
(1,644) |
(3,363) |
(209) |
(77) |
(1,384) |
1,616 |
(102,667) |
| Materials and supplies for power eletricity |
(17,654) |
- |
- |
- |
- |
(1,459) |
- |
- |
- |
- |
- |
- |
- |
1,459 |
(17,654) |
| Natural gas and supplies for gas business |
- |
- |
- |
(678,885) |
- |
- |
- |
- |
- |
- |
- |
- |
- |
678,885 |
- |
| Third-party services |
(104,178) |
(49,586) |
(643,999) |
(13,861) |
(16,355) |
(21,096) |
(1,594) |
(117,604) |
(32,052) |
(4,589) |
(6,671) |
(3,389) |
(65,775) |
84,437 |
(996,312) |
| Depreciation and amortization |
(378,112) |
(16,167) |
(521,301) |
(41,148) |
(33,863) |
(21,588) |
(1,668) |
(259,228) |
(127,732) |
(11,201) |
(40) |
(2,003) |
(3,017) |
35,028 |
(1,382,040) |
| Provisions and reversals |
168,260 |
(20,712) |
(201,083) |
(548) |
- |
97,811 |
- |
6,116 |
(50) |
(1) |
(425) |
(3,927) |
(47,348) |
(90,328) |
(92,235) |
| Construction cost |
- |
(85,482) |
(2,234,539) |
(17,010) |
- |
- |
- |
- |
- |
- |
301 |
- |
- |
17,010 |
(2,319,720) |
| Renegotiation of Hydrological Risk - GSF - HPP Mauá |
- |
- |
- |
- |
- |
- |
- |
- |
- |
- |
- |
- |
- |
- |
- |
| Other operating costs and expenses |
(115,489) |
(6,030) |
(175,230) |
(12,006) |
(11,918) |
(3,196) |
940 |
(48,955) |
(46,873) |
(1,054) |
(1,238) |
(7,396) |
(17,292) |
15,193 |
(430,544) |
| EQUITY IN EARNINGS OF SUBSIDIARIES |
305,369 |
347,703 |
- |
- |
- |
- |
- |
86,058 |
- |
- |
- |
- |
2,332,609 |
(2,763,930) |
307,809 |
| EARNINGS BEFORE INCOME TAXES |
1,492,871 |
904,517 |
1,102,590 |
164,126 |
47,964 |
4,674 |
(2,606) |
335,238 |
322,496 |
6,136 |
58,278 |
108,618 |
2,116,522 |
(2,966,710) |
3,694,714 |
| FINANCIAL RESULTS |
(381,271) |
(284,257) |
(475,102) |
(11,757) |
(43,569) |
2,856 |
(656) |
(115,435) |
26,634 |
3,296 |
6,655 |
37,861 |
30,212 |
(456) |
(1,204,990) |
| Financial income |
106,496 |
57,636 |
479,944 |
36,559 |
90,509 |
9,803 |
497 |
133,035 |
27,294 |
3,304 |
9,286 |
38,577 |
145,881 |
(69,705) |
1,069,116 |
| Financial expenses |
(487,767) |
(341,893) |
(955,046) |
(48,316) |
(134,078) |
(6,947) |
(1,153) |
(248,470) |
(660) |
(8) |
(2,631) |
(717) |
(115,669) |
69,249 |
(2,274,106) |
| OPERATIONAL EXPENSES / INCOME |
1,111,600 |
620,260 |
627,488 |
152,369 |
4,395 |
7,530 |
(3,262) |
219,803 |
349,130 |
9,432 |
64,933 |
146,479 |
2,146,734 |
(2,967,166) |
2,489,724 |
| INCOME TAX AND SOCIAL CONTRIBUTION ON PROFIT |
(60,404) |
(20,420) |
(58,368) |
(40,750) |
(1,487) |
36,795 |
- |
(67,057) |
(115,615) |
(2,900) |
(5,347) |
(40,928) |
11,343 |
11,081 |
(354,057) |
| NET INCOME continuing operations |
1,051,196 |
599,840 |
569,121 |
111,619 |
2,908 |
44,325 |
(3,262) |
152,746 |
233,515 |
6,532 |
59,586 |
105,550 |
2,158,077 |
(2,956,085) |
2,135,667 |
| NET INCOME discontinued operations |
30,134 |
- |
- |
- |
- |
- |
- |
- |
- |
- |
- |
- |
100,733 |
60,634 |
191,501 |
| NET INCOME |
1,081,330 |
599,840 |
569,121 |
111,619 |
2,908 |
44,325 |
(3,262) |
152,746 |
233,515 |
6,532 |
59,586 |
105,550 |
2,258,810 |
(2,895,451) |
2,327,168 |
| Attributed to shareholders of the parent company - continuing operations |
1,051,196 |
599,840 |
569,121 |
- |
2,036 |
- |
(3,262) |
152,746 |
233,515 |
6,532 |
59,586 |
105,550 |
2,188,210 |
(2,806,994) |
2,158,077 |
| Attributed to the controlling company's shareholders - discontinued operations |
30,134 |
- |
- |
56,926 |
- |
35,992 |
- |
- |
- |
- |
- |
- |
70,600 |
(92,912) |
100,733 |
| Attributed to non-controlling shareholders - continuing operations |
- |
- |
- |
- |
873 |
- |
- |
- |
- |
- |
- |
- |
- |
- |
873 |
| Attributed to non-controlling shareholders - discontinued operations |
- |
- |
- |
54,693 |
- |
8,333 |
- |
- |
- |
- |
- |
- |
- |
4,455 |
67,485 |
| EBITDA continuing operations |
1,870,983 |
920,684 |
1,623,891 |
205,274 |
81,827 |
26,262 |
(938) |
594,466 |
450,228 |
17,337 |
58,318 |
110,620 |
2,119,539 |
(3,001,738) |
5,076,754 |
| |
|
|
|
|
|
|
|
|
|
|
|
|
|
|
|
| R$'000 |
| Income Statement 2022 |
GET |
Distribuição |
Compagas |
Elejor |
UEG Araucária |
Serviços |
Wind Farms |
FDA |
Bela Vista |
C. Oeste, Marumbi, Uirapuru |
Mercado Livre |
Holding |
Elimination |
Consolidated |
| Geração |
Transmissão |
| NET OPERATING INCOME |
2,511,145 |
1,041,939 |
13,903,300 |
1,297,034 |
194,287 |
98,508 |
8,014 |
588,519 |
743,002 |
30,249 |
103,908 |
4,938,368 |
- |
(4,922,932) |
20,535,341 |
| Electricity sales to final customers |
103 |
- |
5,236,339 |
- |
- |
- |
- |
- |
- |
- |
- |
2,275,872 |
- |
(2,277) |
7,510,037 |
| Electricity sales to distributors |
2,436,222 |
- |
266,991 |
- |
194,052 |
98,508 |
- |
583,222 |
742,981 |
30,249 |
- |
2,620,535 |
- |
(3,158,351) |
3,814,409 |
| Use of the main distribution and transmission grid (TUSD/ TUST) |
- |
898,353 |
4,221,011 |
- |
- |
- |
- |
- |
- |
- |
102,942 |
- |
- |
(393,465) |
4,828,841 |
| Construction revenue |
- |
115,171 |
2,048,022 |
12,024 |
- |
- |
- |
- |
- |
- |
941 |
- |
- |
(12,024) |
2,164,134 |
| Fair value of assets from the indemnity for the concession |
- |
- |
79,169 |
10,772 |
- |
- |
- |
- |
- |
- |
- |
- |
- |
(10,772) |
79,169 |
| Distribution of piped gas |
- |
- |
- |
1,262,658 |
- |
- |
- |
- |
- |
- |
- |
- |
- |
(1,262,658) |
- |
| Sectoral assets and liabilities result |
- |
- |
1,676,936 |
- |
- |
- |
- |
- |
- |
- |
- |
- |
- |
(0) |
1,676,936 |
| Other operating revenues |
74,820 |
28,415 |
374,832 |
11,580 |
235 |
- |
8,014 |
5,297 |
21 |
- |
25 |
41,961 |
- |
(83,385) |
461,815 |
| OPERATING COSTS AND EXPENSES |
(1,553,242) |
(306,202) |
(13,418,798) |
(1,076,181) |
(86,033) |
(365,522) |
(10,864) |
(400,945) |
(398,843) |
(19,493) |
(9,074) |
(4,814,710) |
(553,266) |
4,948,027 |
(18,065,146) |
| Energy purchased for resale |
(341,302) |
- |
(5,980,124) |
- |
(142) |
- |
- |
(14,383) |
(28,632) |
(1,751) |
- |
(4,790,427) |
- |
3,059,851 |
(8,096,910) |
| Charges of the main distribution and transmission grid |
(344,501) |
- |
(2,313,203) |
- |
(23,425) |
(33,129) |
- |
(48,461) |
(148,610) |
(1,296) |
- |
- |
- |
424,628 |
(2,487,997) |
| Personnel and management |
(178,225) |
(122,623) |
(599,121) |
(42,166) |
(4,738) |
(6,791) |
(3,387) |
(13,897) |
(2,790) |
(1,300) |
(905) |
(12,712) |
(38,207) |
48,958 |
(977,904) |
| Private pension and health plans |
(46,283) |
(30,851) |
(169,493) |
(5,366) |
(252) |
(618) |
(2,924) |
(1,452) |
(297) |
(76) |
(97) |
(1,787) |
(6,685) |
5,984 |
(260,197) |
| Materials |
(11,041) |
(5,185) |
(71,302) |
(1,644) |
(630) |
(263) |
(52) |
(440) |
(853) |
(9) |
(112) |
(53) |
(864) |
1,907 |
(90,541) |
| Raw material and supplies - energy production |
(9,349) |
- |
- |
- |
- |
(113,930) |
- |
- |
- |
- |
- |
- |
- |
113,930 |
(9,349) |
| Natural gas and supplies for gas business |
- |
- |
- |
(939,516) |
- |
- |
- |
- |
- |
- |
- |
- |
- |
939,516 |
- |
| Third-party services |
(87,466) |
(36,748) |
(505,407) |
(13,316) |
(16,781) |
(45,902) |
(2,439) |
(82,116) |
(38,785) |
(2,625) |
(6,128) |
(2,665) |
(38,794) |
124,621 |
(754,551) |
| Depreciation and amortization |
(374,150) |
(13,662) |
(454,307) |
(44,190) |
(30,474) |
(23,694) |
(2,085) |
(200,052) |
(134,432) |
(11,164) |
(30) |
(353) |
(2,504) |
58,000 |
(1,233,097) |
| Provisions and reversals |
11,505 |
(3,847) |
(281,895) |
(2,717) |
- |
(110,968) |
59 |
(2,065) |
(7) |
(91) |
(30) |
(1,724) |
(441,160) |
115,409 |
(717,531) |
| Construction cost |
- |
(88,225) |
(2,048,022) |
(12,024) |
- |
- |
- |
- |
- |
- |
(941) |
- |
- |
12,024 |
(2,137,188) |
| Other operating costs and expenses |
(172,430) |
(5,061) |
(185,361) |
(15,242) |
(9,591) |
(30,227) |
(36) |
(38,079) |
(44,437) |
(1,181) |
(831) |
(4,989) |
(25,052) |
43,199 |
(489,318) |
| PROVISION FOR ALLOCATION OF PIS AND COFINS |
- |
- |
(810,563) |
- |
- |
- |
- |
- |
- |
- |
- |
- |
- |
- |
(810,563) |
| EQUITY IN EARNINGS OF SUBSIDIARIES |
307,565 |
547,702 |
- |
- |
- |
- |
- |
75,322 |
- |
- |
- |
- |
1,746,263 |
(2,198,275) |
478,577 |
| EARNINGS BEFORE INCOME TAXES |
1,265,468 |
1,283,439 |
484,502 |
220,853 |
108,254 |
(267,014) |
(2,850) |
262,896 |
344,159 |
10,756 |
94,834 |
123,658 |
1,192,997 |
(2,173,180) |
2,948,772 |
| FINANCIAL RESULTS |
(351,940) |
(217,582) |
(1,169,741) |
28,440 |
(113,102) |
11,407 |
345 |
(92,530) |
24,714 |
1,405 |
3,810 |
32,376 |
(119,717) |
(43,769) |
(2,005,884) |
| Financial income |
104,228 |
51,661 |
593,726 |
56,730 |
19,069 |
19,694 |
1,633 |
111,378 |
25,236 |
1,405 |
6,854 |
32,667 |
57,658 |
(125,526) |
956,413 |
| Financial expenses |
(456,168) |
(269,243) |
(752,097) |
(28,290) |
(132,171) |
(8,287) |
(1,288) |
(203,908) |
(522) |
- |
(3,044) |
(291) |
(177,375) |
81,757 |
(1,950,927) |
| Update of provision for allocation of PIS and Cofins credits |
- |
- |
(1,011,370) |
- |
- |
- |
- |
- |
- |
- |
- |
- |
- |
- |
(1,011,370) |
| OPERATIONAL EXPENSES / INCOME |
913,528 |
1,065,857 |
(685,239) |
249,293 |
(4,848) |
(255,607) |
(2,505) |
170,366 |
368,873 |
12,161 |
98,644 |
156,034 |
1,073,280 |
(2,216,949) |
942,888 |
| INCOME TAX AND SOCIAL CONTRIBUTION ON PROFIT |
(60,605) |
(51,824) |
455,465 |
(70,091) |
4,157 |
(11,885) |
- |
(53,572) |
(123,452) |
(1,421) |
(5,608) |
(47,658) |
164,539 |
83,054 |
281,099 |
| NET INCOME continuing operations |
852,923 |
1,014,033 |
(229,774) |
179,202 |
(691) |
(267,492) |
(2,505) |
116,794 |
245,421 |
10,740 |
93,036 |
108,376 |
1,237,819 |
(2,133,895) |
1,223,987 |
| NET INCOME discontinued operations |
(162,903) |
- |
- |
- |
- |
- |
- |
- |
- |
- |
- |
- |
(125,812) |
214,049 |
(74,666) |
| NET INCOME |
690,020 |
1,014,033 |
(229,774) |
179,202 |
(691) |
(267,492) |
(2,505) |
116,794 |
245,421 |
10,740 |
93,036 |
108,376 |
1,112,007 |
(1,919,845) |
1,149,321 |
| Attributed to shareholders of the parent company - continuing operations |
852,923 |
1,014,033 |
(229,774) |
- |
(484) |
- |
(2,505) |
116,794 |
245,421 |
10,740 |
93,036 |
108,376 |
1,074,915 |
(2,045,657) |
1,237,819 |
| Attributed to the controlling company's shareholders - discontinued operations |
(162,903) |
- |
- |
91,393 |
- |
(217,204) |
- |
- |
- |
- |
- |
- |
37,092 |
125,810 |
(125,812) |
| Attributed to non-controlling shareholders - continuing operations |
- |
- |
- |
- |
(207) |
- |
- |
- |
- |
- |
- |
- |
- |
- |
(207) |
| Attributed to non-controlling shareholders - discontinued operations |
- |
- |
- |
87,809 |
- |
(50,288) |
- |
- |
- |
- |
- |
- |
- |
- |
37,521 |
| EBITDA continuing operations |
1,639,618 |
1,297,101 |
938,809 |
265,043 |
138,728 |
(243,320) |
(765) |
462,948 |
478,591 |
21,920 |
94,864 |
124,011 |
1,195,501 |
(2,231,180) |
4,181,869 |
| Exhibit II- RESULT BY SUBSIDIARY > ASSETS BY COMPANY |
| |
|
|
|
|
|
|
|
|
|
|
|
|
|
R$'000 |
| Assets - December -2023 |
Geração e Transmissão |
Distribuição |
Compagas |
Elejor |
UEG Araucária |
Serviços |
Wind Farms |
FDA |
Bela Vista |
Costa Oeste, Marumbi, Uirapuru |
Mercado Livre |
Holding |
Eliminations |
Consolidated |
| CURRENT |
2,483,103 |
5,153,666 |
240,017 |
209,323 |
36,580 |
13,598 |
1,008,543 |
442,162 |
38,993 |
110,409 |
1,074,359 |
4,820,021 |
(1,915,044) |
13,715,730 |
| Cash and cash equivalents |
1,008,767 |
626,708 |
101,437 |
166,544 |
22,354 |
3,290 |
831,553 |
353,241 |
34,999 |
83,343 |
294,762 |
2,231,413 |
(123,788) |
5,634,623 |
| Bonds and securities |
|
- |
- |
- |
- |
4,670 |
- |
- |
- |
- |
- |
93 |
- |
4,763 |
| Collaterals and escrow accounts |
- |
9 |
211 |
- |
- |
- |
- |
- |
- |
- |
- |
- |
(211) |
9 |
| Customers |
425,448 |
2,973,010 |
83,153 |
21,157 |
- |
- |
115,672 |
84,309 |
3,074 |
7,976 |
382,264 |
- |
(334,893) |
3,761,170 |
| Dividends receivable |
212,944 |
- |
- |
- |
- |
- |
19,883 |
- |
- |
- |
- |
1,942,406 |
(2,079,664) |
95,569 |
| Sectorial financial assets |
|
15,473 |
- |
- |
|
- |
- |
- |
- |
- |
- |
- |
- |
15,473 |
| Account receivable related to concession |
9,354 |
- |
- |
- |
- |
- |
- |
- |
- |
- |
- |
- |
- |
9,354 |
| Contract Assets |
268,260 |
- |
- |
- |
- |
- |
- |
- |
- |
16,356 |
- |
- |
- |
284,616 |
| Other current receivables |
118,627 |
435,619 |
43,950 |
9,398 |
1 |
3,120 |
5,968 |
252 |
- |
653 |
383,243 |
2,431 |
(53,530) |
949,732 |
| Inventories |
37,923 |
131,927 |
5,383 |
264 |
- |
16 |
4,375 |
16 |
- |
205 |
- |
- |
(5,383) |
174,726 |
| Income tax and social contribution |
150,720 |
1,259 |
5,326 |
10,217 |
13,909 |
1,937 |
19,316 |
2,586 |
491 |
1,644 |
13,516 |
113,532 |
(19,235) |
315,218 |
| Other current recoverable taxes |
18,688 |
922,450 |
8 |
- |
- |
565 |
102 |
1,180 |
23 |
- |
333 |
- |
(6) |
943,343 |
| Prepaid expenses |
11,334 |
37,807 |
549 |
1,743 |
316 |
- |
8,631 |
578 |
406 |
232 |
241 |
1,897 |
(865) |
62,869 |
| Related parties |
24,474 |
9,404 |
- |
- |
- |
- |
3,043 |
- |
- |
- |
- |
54 |
(35,639) |
1,336 |
| Assets held for sale |
196,564 |
- |
- |
- |
- |
- |
- |
- |
- |
- |
- |
528,195 |
738,170 |
1,462,929 |
| NON-CURRENT |
20,868,273 |
16,677,461 |
783,607 |
594,827 |
386,787 |
49,078 |
8,125,742 |
452,885 |
196,589 |
491,174 |
750,631 |
20,538,876 |
(27,812,586) |
42,103,344 |
| Long Term Assets |
5,886,631 |
8,229,821 |
73,274 |
83,192 |
98,157 |
593 |
609,417 |
18,922 |
224 |
490,861 |
740,114 |
611,187 |
(498,956) |
16,343,437 |
| Bonds and securities |
136,591 |
1,005 |
- |
- |
- |
- |
330,401 |
16,388 |
- |
4,410 |
1,937 |
- |
- |
490,732 |
| Other temporary investments |
- |
- |
- |
- |
- |
- |
- |
- |
- |
- |
- |
31,728 |
- |
31,728 |
| Customers |
- |
105,259 |
- |
- |
- |
- |
- |
- |
- |
- |
- |
- |
- |
105,259 |
| Judicial deposits |
94,368 |
380,433 |
61 |
- |
41 |
593 |
81 |
- |
218 |
- |
15,647 |
143,371 |
(101) |
634,712 |
| Sectoral financial assets |
- |
15,473 |
- |
- |
|
- |
- |
- |
- |
- |
- |
- |
- |
15,473 |
| Account receivable related to concession |
855,222 |
1,954,679 |
- |
- |
- |
- |
- |
- |
- |
- |
- |
- |
- |
2,809,901 |
| Contract Assets |
4,639,497 |
2,201,958 |
44,039 |
- |
- |
- |
- |
- |
- |
486,451 |
- |
- |
(51,500) |
7,320,445 |
| Other non-current receivables |
81,646 |
44,839 |
29,174 |
2,507 |
- |
- |
44 |
1,859 |
- |
- |
722,423 |
18 |
(29,170) |
853,340 |
| Income tax and social contribution |
508 |
66,123 |
- |
1,301 |
- |
- |
- |
- |
- |
- |
71 |
- |
- |
68,003 |
| Deferred income tax and social contribution |
- |
1,324,670 |
- |
73,533 |
73,066 |
- |
- |
- |
- |
- |
- |
359,485 |
(73,066) |
1,757,688 |
| Other non-current recoverable taxes |
78,799 |
2,135,382 |
- |
- |
25,050 |
- |
178 |
675 |
6 |
- |
36 |
41,078 |
(25,048) |
2,256,156 |
| Related parties |
- |
- |
- |
5,851 |
- |
- |
278,713 |
- |
- |
- |
- |
35,507 |
(320,071) |
- |
| Investments |
8,629,485 |
443 |
- |
- |
- |
- |
2,788,839 |
- |
- |
- |
- |
19,906,237 |
(27,813,207) |
3,511,797 |
| Property, plant and equipment, net |
5,259,216 |
- |
- |
326,291 |
288,602 |
43,881 |
4,676,981 |
318,527 |
191,085 |
247 |
770 |
8,424 |
(288,603) |
10,825,421 |
| Intangible assets |
1,028,600 |
8,317,327 |
699,697 |
184,539 |
28 |
911 |
7,267 |
115,436 |
5,280 |
66 |
5,784 |
6,336 |
798,818 |
11,170,089 |
| Right to use an asset |
64,341 |
129,870 |
10,636 |
805 |
- |
3,693 |
43,238 |
- |
- |
- |
3,963 |
6,692 |
(10,638) |
252,600 |
| TOTAL |
23,351,376 |
21,831,127 |
1,023,624 |
804,150 |
423,367 |
62,676 |
9,134,285 |
895,047 |
235,582 |
601,583 |
1,824,990 |
25,358,897 |
(29,727,630) |
55,819,074 |
| |
|
|
|
|
|
|
|
|
|
|
|
|
|
|
| |
|
|
|
|
|
|
|
|
|
|
|
|
|
|
| Assets - December-2022 |
Geração e Transmissão |
Distribuição |
Compagas |
Elejor |
UEG Araucária |
Serviços |
Wind Farms |
FDA |
Bela Vista |
Costa Oeste, Marumbi, Uirapuru |
Mercado Livre |
Holding |
Eliminations |
Consolidated |
| CURRENT |
1,647,236 |
4,937,240 |
282,714 |
224,833 |
97,587 |
6,075 |
937,476 |
376,804 |
26,828 |
94,931 |
990,867 |
1,180,872 |
(1,476,214) |
9,327,249 |
| Cash and cash equivalents |
380,955 |
430,121 |
61,059 |
185,916 |
64,991 |
3,748 |
755,355 |
284,624 |
22,934 |
71,141 |
217,736 |
199,877 |
- |
2,678,457 |
| Bonds and securities |
- |
- |
- |
- |
- |
- |
- |
- |
- |
- |
- |
93 |
- |
93 |
| Collaterals and escrow accounts |
- |
90 |
67 |
- |
- |
- |
- |
- |
- |
- |
- |
- |
- |
157 |
| Customers |
389,967 |
2,429,434 |
128,589 |
23,272 |
- |
- |
97,594 |
88,764 |
2,997 |
7,184 |
475,170 |
- |
(300,921) |
3,342,050 |
| Dividends receivable |
352,718 |
- |
- |
- |
- |
- |
45,676 |
- |
- |
- |
- |
824,143 |
(1,084,207) |
138,330 |
| Sectorial financial assets |
- |
190,699 |
- |
- |
- |
- |
- |
- |
- |
- |
- |
- |
- |
190,699 |
| Account receivable related to concession |
8,603 |
- |
- |
- |
- |
- |
- |
- |
- |
- |
- |
- |
- |
8,603 |
| Contract Assets |
205,647 |
- |
- |
- |
- |
- |
- |
- |
- |
15,013 |
- |
- |
- |
220,660 |
| Other current receivables |
137,224 |
408,462 |
49,518 |
12,237 |
5 |
2 |
5,616 |
2 |
- |
66 |
292,962 |
977 |
(9,691) |
897,380 |
| Inventories |
30,024 |
158,487 |
5,694 |
195 |
- |
249 |
- |
- |
- |
201 |
- |
- |
- |
194,850 |
| Income tax and social contribution |
102,625 |
95,397 |
8,705 |
3,097 |
12,885 |
1,693 |
16,522 |
1,620 |
250 |
1,129 |
3,619 |
107,523 |
- |
355,065 |
| Other current recoverable taxes |
11,312 |
1,178,192 |
28,505 |
- |
19,705 |
241 |
120 |
1,225 |
16 |
- |
378 |
- |
- |
1,239,694 |
| Prepaid expenses |
13,000 |
37,593 |
577 |
116 |
- |
142 |
5,394 |
569 |
631 |
197 |
1,002 |
855 |
- |
60,076 |
| Related parties |
15,162 |
8,765 |
- |
- |
- |
- |
11,199 |
- |
- |
- |
- |
47,404 |
(81,395) |
1,135 |
| NON-CURRENT |
20,110,117 |
15,601,575 |
800,999 |
623,364 |
236,832 |
16,870 |
6,623,943 |
561,976 |
210,555 |
496,329 |
818,104 |
20,894,673 |
(26,618,884) |
40,376,451 |
| Long Term Assets |
5,924,570 |
8,200,557 |
59,505 |
80,811 |
43,358 |
536 |
476,931 |
15,875 |
15 |
496,232 |
809,498 |
538,071 |
(203,812) |
16,442,145 |
| Bonds and securities |
123,022 |
905 |
- |
- |
- |
- |
286,623 |
14,750 |
- |
3,974 |
1,689 |
- |
- |
430,963 |
| Other temporary investments |
- |
- |
- |
- |
- |
- |
- |
- |
- |
- |
- |
25,619 |
- |
25,619 |
| Customers |
- |
109,472 |
- |
- |
- |
- |
347 |
- |
- |
- |
- |
- |
- |
109,819 |
| Judicial deposits |
87,125 |
384,425 |
69 |
58 |
7,087 |
536 |
49 |
- |
- |
- |
14,362 |
138,747 |
- |
632,458 |
| Sectoral financial assets |
- |
190,699 |
- |
- |
- |
- |
- |
- |
- |
- |
- |
- |
- |
190,699 |
| Account receivable related to concession |
826,871 |
1,442,819 |
- |
- |
- |
- |
- |
- |
- |
- |
- |
- |
- |
2,269,690 |
| Contract Assets |
4,607,214 |
2,332,171 |
30,032 |
- |
- |
- |
- |
- |
- |
490,785 |
- |
- |
(8,183) |
7,452,019 |
| Other non-current receivables |
89,225 |
15,020 |
29,394 |
2,508 |
- |
- |
- |
475 |
- |
1,473 |
793,339 |
18 |
- |
931,452 |
| Income tax and social contribution |
106,729 |
19,723 |
- |
1,301 |
- |
- |
- |
- |
- |
- |
71 |
- |
- |
127,824 |
| Deferred income tax and social contribution |
- |
1,203,057 |
- |
71,094 |
36,271 |
- |
- |
- |
- |
- |
- |
333,877 |
- |
1,644,299 |
| Other non-current recoverable taxes |
84,383 |
2,502,266 |
- |
- |
- |
- |
133 |
649 |
15 |
- |
37 |
39,810 |
- |
2,627,293 |
| Prepaid expenses |
- |
- |
10 |
- |
- |
- |
- |
- |
- |
- |
- |
- |
- |
10 |
| Related parties |
- |
- |
- |
5,851 |
- |
- |
189,779 |
- |
- |
- |
- |
- |
(195,630) |
- |
| Investments |
7,720,268 |
534 |
- |
- |
- |
- |
2,402,494 |
- |
- |
- |
- |
20,339,344 |
(27,136,909) |
3,325,731 |
| Property, plant and equipment, net |
5,278,437 |
- |
- |
345,813 |
193,421 |
1,977 |
3,720,908 |
315,167 |
205,250 |
5 |
541 |
7,948 |
- |
10,069,468 |
| Intangible assets |
1,126,526 |
7,257,827 |
726,107 |
195,778 |
53 |
1,263 |
1,104 |
230,934 |
5,288 |
92 |
6,193 |
4,724 |
721,837 |
10,277,727 |
| Right to use an asset |
60,316 |
142,657 |
15,387 |
962 |
- |
13,094 |
22,506 |
- |
- |
- |
1,872 |
4,586 |
- |
261,380 |
| TOTAL |
21,757,353 |
20,538,815 |
1,083,713 |
848,198 |
334,418 |
22,946 |
7,561,419 |
938,779 |
237,382 |
591,260 |
1,808,971 |
22,075,545 |
(28,095,099) |
49,703,700 |
| Exhibit II- RESULT BY SUBSIDIARY > LIABILITIES BY COMPANY |
| |
|
|
|
|
|
|
|
|
|
|
|
|
|
R$'000 |
| Liabilities - December -23 |
Geração e Transmissão |
Distribuição |
Compagas |
Elejor |
UEG Araucária |
Serviços |
Wind Farms |
FDA |
Bela Vista |
Costa Oeste, Marumbi, Uirapuru |
Mercado Livre |
Holding |
Eliminations |
Consolidated |
| CURRENT |
10,603,209 |
15,048,263 |
508,958 |
840,289 |
105,756 |
8,354 |
3,629,611 |
260,994 |
6,311 |
69,359 |
1,482,784 |
1,472,745 |
(2,409,227) |
31,627,407 |
| Social charges and accruals |
290,601 |
597,160 |
9,452 |
369 |
702 |
- |
64 |
- |
- |
- |
8,736 |
30,608 |
(10,154) |
927,538 |
| Associated companies and parent company |
5,967 |
11,950 |
- |
- |
- |
54 |
30,356 |
865 |
238 |
286 |
379 |
1,841 |
(51,933) |
- |
| Suppliers |
318,600 |
1,605,111 |
58,010 |
3,984 |
5,684 |
3,754 |
68,712 |
23,045 |
586 |
976 |
381,520 |
4,529 |
(320,085) |
2,154,430 |
| Income Tax and Social Contribution payable |
- |
- |
12,876 |
294 |
- |
- |
8,721 |
122,906 |
278 |
596 |
- |
183 |
(12,876) |
132,979 |
| Other taxes |
57,245 |
253,336 |
13,463 |
1,057 |
277 |
208 |
8,611 |
4,871 |
501 |
264 |
19,508 |
474 |
(13,734) |
346,083 |
| Loans and financing |
174,260 |
375,135 |
- |
- |
- |
- |
120,930 |
- |
- |
5,656 |
- |
- |
- |
675,980 |
| Debentures |
607,981 |
569,700 |
81,797 |
- |
- |
- |
47,968 |
- |
- |
- |
- |
- |
(81,797) |
1,225,649 |
| Dividends payable |
1,274,433 |
460,904 |
24,314 |
- |
43,134 |
- |
40,397 |
55,460 |
1,552 |
14,151 |
185,341 |
464,147 |
(2,099,687) |
464,147 |
| Post employment benefits |
22,124 |
59,742 |
- |
- |
- |
- |
- |
- |
- |
- |
125 |
3,842 |
- |
85,833 |
| Customer charges due |
15,248 |
44,789 |
- |
- |
- |
- |
- |
1,177 |
- |
252 |
- |
- |
- |
61,466 |
| Research and development and energy efficiency |
55,130 |
262,444 |
- |
1,672 |
- |
- |
- |
369 |
- |
582 |
- |
- |
- |
320,196 |
| Payables related to concession |
2,170 |
- |
- |
99,806 |
- |
- |
- |
- |
- |
- |
- |
- |
- |
101,976 |
| Sectorial financial liabilities |
- |
476,103 |
- |
- |
- |
- |
- |
- |
- |
- |
- |
- |
- |
476,103 |
| Other accounts payable |
8,364 |
40,083 |
2,601 |
249 |
- |
17 |
487 |
- |
- |
- |
137 |
405 |
(2,601) |
49,742 |
| Other bills to pay |
97,549 |
175,695 |
3,624 |
1,919 |
- |
- |
222,868 |
9,309 |
446 |
41 |
336,491 |
15,135 |
(3,620) |
859,456 |
| PIS and Cofins to be refunded to consumers |
|
558,591 |
|
|
|
|
- |
|
|
- |
|
|
- |
558,591 |
| Provisions for litigation |
- |
- |
- |
- |
- |
- |
- |
- |
- |
- |
- |
336,000 |
- |
336,000 |
| Liabilities associated with assets held for sale |
- |
- |
|
|
|
|
- |
- |
|
- |
|
- |
533,264 |
533,264 |
| NON-CURRENT |
7,673,538 |
9,557,520 |
302,821 |
730,939 |
55,959 |
4,321 |
3,080,497 |
42,991 |
2,710 |
46,556 |
550,547 |
615,580 |
(346,004) |
22,317,974 |
| Associated companies and parent company |
- |
- |
- |
- |
35,616 |
- |
265,157 |
- |
- |
- |
- |
5,851 |
(306,624) |
- |
| Suppliers |
131,143 |
- |
- |
- |
- |
- |
- |
- |
- |
- |
- |
- |
- |
131,143 |
| Deferred income tax and social contribution |
1,207,009 |
- |
21,319 |
1,465 |
- |
- |
24,244 |
35,267 |
865 |
18,733 |
109,736 |
- |
268,156 |
1,686,793 |
| Tax liabilities |
60,756 |
546,184 |
- |
- |
- |
589 |
- |
- |
- |
- |
534 |
4,030 |
- |
612,093 |
| Loans and financing |
2,106,275 |
375,585 |
- |
- |
- |
- |
2,164,987 |
- |
- |
20,390 |
- |
- |
- |
4,667,237 |
| Debentures |
3,160,977 |
4,750,476 |
202,405 |
- |
- |
- |
482,004 |
- |
- |
- |
- |
- |
(202,405) |
8,393,457 |
| Post-employment benefits |
398,594 |
948,724 |
8,608 |
- |
718 |
- |
- |
- |
- |
- |
3,555 |
47,537 |
(9,326) |
1,398,410 |
| Research and development and energy efficiency |
- |
224,996 |
- |
- |
8,690 |
- |
- |
7,724 |
- |
757 |
- |
- |
(8,690) |
233,478 |
| Payables related to the concession |
62,990 |
- |
- |
728,889 |
- |
- |
- |
- |
- |
- |
- |
- |
- |
791,879 |
| Sectorial financial liabilities |
- |
27,888 |
- |
- |
|
- |
- |
- |
- |
- |
- |
- |
- |
27,888 |
| Lease liability |
60,761 |
99,138 |
8,972 |
585 |
- |
3,732 |
45,781 |
- |
- |
- |
4,022 |
6,681 |
(8,972) |
220,700 |
| Other payables |
49,539 |
1,559 |
45,086 |
- |
- |
- |
96,018 |
- |
- |
17 |
431,938 |
25,297 |
(70,384) |
579,070 |
| PIS/Cofins to be refunded to consumers |
|
173,135 |
|
|
|
|
- |
|
|
- |
|
|
- |
173,135 |
| Provision for allocation of PIS and COFINS |
|
1,909,775 |
|
|
|
|
- |
|
|
|
|
|
|
1,909,775 |
| Provisions for litigation |
435,495 |
500,060 |
16,431 |
- |
10,935 |
- |
2,306 |
- |
1,845 |
6,658 |
762 |
526,183 |
(7,759) |
1,492,916 |
| EQUITY |
12,748,166 |
6,782,864 |
514,666 |
(36,139) |
317,611 |
54,322 |
5,504,674 |
634,053 |
229,271 |
532,222 |
342,206 |
23,886,152 |
(27,623,917) |
23,886,153 |
| Attributable to controlling shareholders |
12,748,166 |
6,782,864 |
514,666 |
(36,139) |
317,611 |
54,322 |
5,504,674 |
634,053 |
229,271 |
532,222 |
342,206 |
23,886,152 |
(27,623,917) |
23,886,153 |
| Capital |
6,242,757 |
5,372,206 |
220,966 |
35,503 |
425,662 |
16,685 |
5,157,938 |
409,509 |
223,913 |
275,161 |
237,210 |
12,821,758 |
(18,617,510) |
12,821,758 |
| Advance for Future Capital Increase |
- |
- |
- |
- |
- |
48,950 |
17,681 |
- |
- |
- |
- |
- |
(66,631) |
- |
| Capital reserves |
|
|
|
|
|
|
- |
|
|
- |
|
|
|
|
| Asset valuation adjustments |
498,183 |
(163,951) |
983 |
2,844 |
442 |
(1) |
- |
- |
- |
- |
(1,097) |
307,049 |
(337,403) |
307,050 |
| Legal Reserves |
961,538 |
335,200 |
44,193 |
- |
- |
- |
55,133 |
58,164 |
703 |
27,949 |
28,071 |
1,625,628 |
(1,510,951) |
1,625,628 |
| Profit retention reserve |
5,045,688 |
1,239,409 |
136,905 |
- |
- |
- |
443,457 |
- |
- |
186,658 |
4,377 |
9,000,505 |
(7,056,494) |
9,000,506 |
| Additional proposed dividends |
- |
- |
- |
- |
- |
- |
117,100 |
166,380 |
4,655 |
42,454 |
73,645 |
131,211 |
(404,235) |
131,211 |
| Accumulated profit |
- |
- |
111,619 |
(74,486) |
(108,493) |
(11,312) |
(286,635) |
- |
- |
- |
- |
- |
369,307 |
- |
| Attributable to noncontrolling interests |
- |
- |
- |
- |
- |
- |
- |
- |
- |
- |
- |
- |
305,514 |
305,514 |
| TOTAL |
23,351,376 |
21,831,127 |
1,023,624 |
804,150 |
423,367 |
62,676 |
9,134,285 |
895,047 |
235,582 |
601,582 |
1,824,990 |
25,358,897 |
(29,727,630) |
55,819,074 |
| |
|
|
|
|
|
|
|
|
|
|
|
|
|
|
| |
|
|
|
|
|
|
|
|
|
|
|
|
|
R$'000 |
| Liabilities - December-22 |
Geração e Transmissão |
Distribuição |
Compagas |
Elejor |
UEG Araucária |
Serviços |
Wind Farms |
FDA |
Bela Vista |
Costa Oeste, Marumbi, Uirapuru |
Mercado Livre |
Holding |
Eliminations |
Consolidated |
| CURRENT |
2,077,931 |
3,970,515 |
419,277 |
111,142 |
45,115 |
881 |
490,273 |
297,517 |
4,622 |
34,551 |
790,165 |
390,708 |
(1,476,100) |
7,156,597 |
| Social charges and accruals |
77,637 |
154,982 |
9,892 |
352 |
646 |
- |
51 |
- |
37 |
- |
2,587 |
6,605 |
- |
252,789 |
| Associated companies and parent company |
5,897 |
8,962 |
- |
- |
- |
- |
62,831 |
913 |
241 |
299 |
378 |
1,838 |
(81,359) |
- |
| Suppliers |
312,042 |
1,447,967 |
97,759 |
3,320 |
5,955 |
76 |
41,489 |
23,378 |
1,357 |
883 |
460,957 |
5,373 |
(310,534) |
2,090,022 |
| Income Tax and Social Contribution payable |
- |
- |
12,534 |
- |
- |
- |
7,371 |
130,875 |
254 |
546 |
4,611 |
- |
- |
156,191 |
| Other taxes |
35,711 |
182,308 |
24,641 |
1,345 |
358 |
30 |
6,604 |
5,516 |
248 |
247 |
17,908 |
28,690 |
- |
303,606 |
| Loans and financing |
173,609 |
6,203 |
- |
- |
- |
- |
91,293 |
- |
- |
7,733 |
- |
- |
- |
278,838 |
| Debentures |
923,657 |
373,634 |
- |
- |
- |
- |
49,056 |
- |
- |
- |
- |
- |
- |
1,346,347 |
| Dividends payable |
372,899 |
265,574 |
267,149 |
- |
38,156 |
- |
86,592 |
125,978 |
1,788 |
24,519 |
39,626 |
344,251 |
(1,084,207) |
482,325 |
| Post employment benefits |
18,795 |
51,978 |
- |
- |
- |
- |
- |
- |
- |
- |
84 |
2,957 |
- |
73,814 |
| Customer charges due |
14,914 |
29,032 |
- |
- |
- |
- |
- |
2,343 |
- |
199 |
- |
- |
- |
46,488 |
| Research and development and energy efficiency |
83,566 |
284,305 |
- |
1,467 |
- |
- |
- |
826 |
- |
80 |
- |
- |
- |
370,244 |
| Payables related to concession |
1,918 |
- |
- |
103,085 |
- |
- |
- |
- |
- |
- |
- |
- |
- |
105,003 |
| Sectorial financial liabilities |
- |
433,914 |
- |
- |
- |
- |
- |
- |
- |
- |
- |
- |
- |
433,914 |
| Other accounts payable |
10,777 |
48,882 |
3,580 |
169 |
- |
774 |
145 |
- |
- |
- |
107 |
436 |
- |
64,870 |
| Other bills to pay |
46,509 |
132,247 |
3,722 |
1,404 |
- |
1 |
144,841 |
7,688 |
697 |
45 |
263,907 |
558 |
- |
601,619 |
| PIS and Cofins to be refunded to consumers |
- |
550,527 |
- |
- |
- |
- |
- |
- |
- |
- |
- |
- |
- |
550,527 |
| NON-CURRENT |
6,889,354 |
9,958,028 |
107,306 |
771,897 |
16,322 |
13,431 |
2,174,205 |
78,093 |
3,108 |
52,623 |
600,024 |
867,473 |
(115,986) |
21,415,878 |
| Associated companies and parent company |
- |
- |
- |
- |
- |
- |
189,888 |
- |
- |
- |
- |
5,851 |
(195,739) |
- |
| Suppliers |
125,448 |
- |
- |
- |
- |
- |
- |
- |
- |
- |
- |
- |
- |
125,448 |
| Deferred income tax and social contribution |
1,188,192 |
- |
36,200 |
- |
- |
- |
10,632 |
73,025 |
416 |
17,838 |
99,217 |
- |
92,162 |
1,517,682 |
| Tax liabilities |
55,695 |
566,826 |
- |
- |
6,331 |
536 |
- |
- |
- |
- |
427 |
3,676 |
- |
633,491 |
| Loans and financing |
2,215,315 |
751,805 |
- |
- |
- |
- |
1,378,697 |
- |
- |
25,708 |
- |
- |
- |
4,371,525 |
| Debentures |
2,304,860 |
3,642,973 |
- |
- |
- |
- |
509,675 |
- |
- |
- |
- |
- |
- |
6,457,508 |
| Post-employment benefits |
300,979 |
657,867 |
9,294 |
- |
901 |
- |
- |
- |
- |
- |
3,292 |
23,890 |
- |
996,223 |
| Research and development and energy efficiency |
5,983 |
223,805 |
- |
- |
7,698 |
- |
- |
5,068 |
- |
1,960 |
- |
- |
- |
244,514 |
| Payables related to the concession |
61,437 |
- |
- |
771,102 |
- |
- |
- |
- |
- |
- |
- |
- |
- |
832,539 |
| Sectorial financial liabilities |
- |
49,341 |
- |
- |
- |
- |
- |
- |
- |
- |
- |
- |
- |
49,341 |
| Lease liability |
52,848 |
100,659 |
12,421 |
795 |
- |
12,895 |
23,030 |
- |
- |
- |
1,865 |
4,373 |
- |
208,886 |
| Other payables |
46,169 |
16,006 |
33,223 |
- |
- |
- |
54,340 |
- |
- |
- |
494,641 |
25,241 |
(24,386) |
645,234 |
| PIS/Cofins to be refunded to consumers |
- |
1,444,631 |
- |
- |
- |
- |
- |
- |
- |
- |
- |
- |
- |
1,444,631 |
| Provision for allocation of PIS and Cofins credits |
- |
1,851,257 |
- |
- |
- |
- |
- |
- |
- |
- |
- |
- |
- |
1,851,257 |
| Provisions for litigation |
532,428 |
652,858 |
16,168 |
- |
1,392 |
- |
7,943 |
- |
2,692 |
7,117 |
582 |
804,442 |
11,977 |
2,037,599 |
| EQUITY |
12,790,068 |
6,610,272 |
557,130 |
(34,841) |
272,981 |
8,634 |
4,896,941 |
563,169 |
229,652 |
504,086 |
418,782 |
20,817,364 |
(26,503,013) |
21,131,225 |
| Attributable to controlling shareholders |
12,790,068 |
6,610,272 |
557,130 |
(34,841) |
272,981 |
8,634 |
4,896,941 |
563,169 |
229,652 |
504,086 |
418,782 |
20,817,364 |
(26,816,874) |
20,817,364 |
| Capital |
6,242,757 |
5,359,206 |
220,966 |
35,503 |
425,662 |
15,085 |
4,685,823 |
409,509 |
223,913 |
239,000 |
237,210 |
10,800,000 |
(18,094,634) |
10,800,000 |
| Advance for Future Capital Increase |
- |
- |
- |
- |
- |
1,600 |
1,460 |
- |
- |
- |
- |
- |
(3,060) |
- |
| Capital reserves |
- |
- |
- |
- |
- |
- |
- |
- |
- |
- |
- |
- |
- |
- |
| Equity valuation adjustments |
586,054 |
15,777 |
(363) |
7,050 |
137 |
(1) |
- |
- |
- |
- |
(1,113) |
593,382 |
(607,541) |
593,382 |
| Legal Reserves |
877,479 |
306,744 |
44,193 |
- |
- |
- |
34,835 |
46,488 |
376 |
24,970 |
22,794 |
1,512,687 |
(1,357,879) |
1,512,687 |
| Profit retention reserve |
4,241,625 |
928,545 |
292,334 |
- |
- |
- |
382,719 |
- |
- |
222,819 |
123,934 |
7,911,295 |
(6,191,976) |
7,911,295 |
| Additional proposed dividends |
842,153 |
- |
- |
- |
- |
- |
68,365 |
107,172 |
5,363 |
17,297 |
35,957 |
- |
(1,076,307) |
- |
| Accumulated profit |
- |
- |
- |
(77,394) |
(152,818) |
(8,050) |
(276,261) |
- |
- |
- |
- |
- |
514,523 |
- |
| Attributable to noncontrolling interests |
- |
- |
|
- |
- |
- |
- |
- |
- |
- |
- |
- |
313,861 |
313,861 |
| TOTAL |
21,757,353 |
20,538,815 |
1,083,713 |
848,198 |
334,418 |
22,946 |
7,561,419 |
938,779 |
237,382 |
591,260 |
1,808,971 |
22,075,545 |
(28,095,099) |
49,703,700 |
| Exhibit III - ENERGY MARKET> DISTRIBUTION AND TOTAL MARKET |
| Copel’s Total Market |
|
Number of Customers / Agreements |
|
Energy Sold (GWh) |
| |
Dec-23 |
Dec-22 |
∆% |
|
4Q23 |
4Q22 |
Δ% |
2023 |
2022 |
Δ% |
| |
|
|
|
|
|
|
|
|
|
|
|
| Copel DIS |
|
5,098,389 |
5,011,883 |
1.7 |
|
5,668 |
5,961 |
-4.9 |
22,645 |
23,471 |
-3.5 |
| Captive Market |
|
5,098,006 |
5,011,555 |
1.7 |
|
5,321 |
4,746 |
12.1 |
20,173 |
19,370 |
4.1 |
| Concessionaries and Licensees |
|
2 |
2 |
- |
|
23 |
22 |
4.5 |
89 |
91 |
-2 |
| CCEE (Assigments MCSD EN) |
|
381 |
304 |
25.3 |
|
75 |
80 |
-6.3 |
247 |
239 |
3.3 |
| CCEE (MVE) |
|
- |
22 |
- |
|
- |
177 |
- |
- |
702 |
- |
| CCEE (MCP) 2 |
|
- |
- |
- |
|
249 |
936 |
-73.4 |
2,136 |
3,069 |
-30.4 |
| Copel GeT |
|
360 |
284 |
26.8 |
|
5,600 |
5,060 |
10.7 |
16,532 |
17,344 |
-4.7 |
| CCEAR (Copel DIS) |
|
3 |
3 |
- |
|
93 |
92 |
1.1 |
122 |
123 |
-0.8 |
| CCEAR (other concessionaries) |
|
101 |
101 |
- |
|
2,031 |
1,668 |
21.8 |
3,772 |
2,215 |
70.3 |
| Free Customers |
|
- |
1 |
- |
|
- |
- |
- |
- |
- |
- |
| Bilateral Agreements (Copel Mercado Livre) |
|
252 |
175 |
44 |
|
3,054 |
3,015 |
1.3 |
12,180 |
13,893 |
-12.3 |
| Bilateral Agreements 1 |
|
4 |
4 |
- |
|
43 |
36 |
19.4 |
270 |
259 |
4.2 |
| CCEE (MCP) 2 |
|
- |
- |
- |
|
379 |
249 |
52.2 |
188 |
854 |
-78 |
| Wind Farms Complex |
|
565 |
363 |
55.6 |
|
1,159 |
886 |
30.9 |
4,447 |
3,215 |
38.3 |
| |
|
15 |
6 |
150 |
|
29 |
8 |
262.5 |
111 |
32 |
246.9 |
| CCEAR (other concessionaries) |
|
512 |
328 |
56.1 |
|
575 |
325 |
76.9 |
2,201 |
1,289 |
70.8 |
| CER |
|
10 |
10 |
- |
|
231 |
231 |
- |
916 |
916 |
- |
| Bilateral Agreements (Copel Mercado Livre) |
|
8 |
9 |
-11.1 |
|
148 |
140 |
5.7 |
598 |
374 |
59.9 |
| Bilateral Agreements |
|
20 |
10 |
100 |
|
172 |
148 |
16.7 |
621 |
482 |
28.8 |
| CCEE (MCP) 2 |
|
- |
- |
- |
|
4 |
34 |
-88.2 |
- |
122 |
- |
| Copel Mercado Livre |
|
1,747 |
1,683 |
4.5 |
|
5,726 |
6,209 |
-7.8 |
22,450 |
24,817 |
-9.5 |
| Free Customers |
|
1,624 |
1,490 |
9.3 |
|
3,022 |
2,802 |
7.9 |
11,884 |
11,498 |
3.4 |
| Bilateral Agreements (Group Companies) |
|
- |
16 |
- |
|
- |
309 |
- |
504 |
1,208 |
-58.3 |
| Bilateral Agreements |
|
123 |
177 |
-35.5 |
|
2,704 |
3,051 |
-11.4 |
9,819 |
11,949 |
-17.8 |
| CCEE (MCP) 2 |
|
- |
- |
- |
|
- |
47 |
- |
243 |
162 |
50 |
| Total Copel |
|
5,101,061 |
5,014,213 |
1.7 |
|
18,153 |
18,116 |
0.2 |
66,074 |
68,847 |
-4 |
| Eliminations (operations with Group companies) |
|
|
|
|
|
3,264 |
4,083 |
-20.1 |
10,251 |
11,690 |
-12.3 |
| Total Consolidated Copel |
|
|
|
|
|
14,889 |
14,033 |
6.1 |
55,823 |
57,157 |
-2.3 |
Note: Not considering the energy from MRE (Energy Relocation Mechanism) and the energy from TPP Araucária sold in the CCEE Spot Market.
1 Includes Short Term Sales Agreements and CBR
2 Assured Power allocated in the period, after impact of the GSF.
CCEE: Electric Power Trade Chamber / CCEAR: Energy Purchase Agreements in the Regulated Market / MCP: Short Term Market / CER: Agreements Reserve Energy / MCSD EN - Mechanism for Compensation of Surpluses and Deficits of New Energy / MVE - MVE - Sale of energy to the free market through the Surplus Selling Mechanism. |
| |
|
|
|
|
|
|
|
|
|
|
|
| Copel’s Dis Market |
|
Number of Customers |
|
Consumed Energy (GWh) |
| |
Dec-23 |
Dec-22 |
∆% |
|
4Q23 |
4Q22 |
Δ% |
2023 |
2022 |
Δ% |
| Residential |
|
4,121,397 |
4,127,292 |
2.1 |
|
2,400 |
2,055 |
16.8 |
8,888 |
8,212 |
8.2 |
| Industrial |
|
69,134 |
69,731 |
(0.9) |
|
3,098 |
3,047 |
1.7 |
12,292 |
12,250 |
0.3 |
| Captive |
|
67,858 |
68,618 |
(1.1) |
|
478 |
507 |
(5.7) |
1,942 |
2,102 |
(7.6) |
| Free |
|
1,276 |
1,113 |
14.6 |
|
2,620 |
2,541 |
3.1 |
10,350 |
10,147 |
2.0 |
| Commercial |
|
440,749 |
431,417 |
2.2 |
|
1,787 |
1,518 |
17.7 |
6,734 |
6,256 |
7.7 |
| Captive |
|
439,039 |
429,962 |
2.1 |
|
1,202 |
1,049 |
14.7 |
4,520 |
4,294 |
5.2 |
| Free |
|
1,710 |
1,455 |
17.5 |
|
585 |
470 |
24.5 |
2,215 |
1,961 |
12.9 |
| Rural |
|
323,481 |
331,987 |
(2.6) |
|
643 |
571 |
12.6 |
2,516 |
2,487 |
1.2 |
| Captive |
|
323,408 |
331,938 |
(2.6) |
|
598 |
536 |
11.5 |
2,352 |
2,357 |
(0.2) |
| Free |
|
73 |
49 |
49.0 |
|
45 |
35 |
28.9 |
165 |
130 |
27.1 |
| Others |
|
55,316 |
53,757 |
2.9 |
|
644 |
601 |
7.1 |
2,480 |
2,411 |
2.8 |
| Captive |
|
55,304 |
53,745 |
2.9 |
|
642 |
599 |
7.1 |
2,472 |
2,405 |
2.8 |
| Free |
|
12 |
12 |
- |
|
2 |
2 |
- |
7 |
7 |
- |
| Total Captive Market |
|
5,098,006 |
5,011,555 |
1.7 |
|
5,321 |
4,746 |
12.1 |
20,173 |
19,370 |
4.1 |
| Total Free Market |
|
3,071 |
2,629 |
16.8 |
|
3,252 |
3,047 |
6.7 |
12,737 |
12,244 |
4.0 |
| Supply to Concessionaries |
|
7 |
7 |
- |
|
242 |
224 |
8.0 |
940 |
925 |
1.7 |
| Total Grid Market |
|
5,101,084 |
5,014,191 |
1.7 |
|
8,814 |
8,017 |
10.0 |
33,850 |
32,539 |
4.0 |
| Micro and Mini Distributed Energy Generation |
|
312,775 |
213,179 |
46.7 |
|
(519) |
(339) |
52.9 |
(1,798) |
(1,090) |
65.0 |
| Total Billed Market |
|
|
|
|
|
8,296 |
7,678 |
8.0 |
32,052 |
31,449 |
1.9 |
| Exhibit III - ENERGY MARKET> TARIFFS |
| Supply Tariff (R$/MWh) |
Amount |
Dec-23 |
Dec-22 |
Δ% |
| Average MW |
| Copel Geração e Transmissão |
|
|
|
|
| Auction CCEAR 2011 - 2040 ( HPP Mauá) |
102 |
288.50 |
277.07 |
4.1% |
| Auction CCEAR 2013 - 2042 (SHP Cavernoso II) |
8 |
313.24 |
302.31 |
3.6% |
| Auction - CCEAR 2015 - 2044 (HPP Colíder) |
130 |
220.13 |
211.44 |
4.1% |
| Auction - CCEAR 2018 - 2048 (HPP Baixo Iguaçu) |
38 |
228.94 |
220.04 |
4.0% |
| Auction - CCEAR 2024 - 2053 (HPP Baixo Iguaçu) |
* |
|
|
|
| Auction - CCEAR 2024 - 2053 (SHP Bela Vista) |
* |
|
|
|
| Copel Distribuição |
|
|
|
|
| Concession holders in the State of Paraná |
14 |
273.04 |
262.70 |
3.9% |
| Total / Tariff Weighted Average Supply |
292 |
250.25 |
240.43 |
4.1% |
| Contains PIS and COFINS. Net of ICMS. |
|
|
|
|
*Supply contract from January/2024. Auction prices, updated by IPCA until Dec/23 (Reference Jan/24), for HPP Baixo Iguaçu R$ 202.99 and SHP Bela Vista R$ 261.90. Source: CCEE
|
| |
|
|
|
|
| Purchase Tariff - Copel Distribuição (R$/MWh) |
Amount |
Dec-23 |
Dec-22 |
Δ% |
| Average MW |
| Itaipu 1 |
516.0 |
214.53 |
279.57 |
-23.3% |
| Auction – CCEAR 2010 – H30 |
71.3 |
301.39 |
289.97 |
3.9% |
| Auction – CCEAR 2010 – T15 2 |
60.1 |
256.60 |
185.46 |
38.4% |
| Auction – CCEAR 2011 – H30 |
58.9 |
310.73 |
298.96 |
3.9% |
| Auction – CCEAR 2011 – T15 2 |
54.2 |
298.41 |
229.16 |
30.2% |
| Auction – CCEAR 2012 – T15 2 |
107.5 |
219.98 |
171.88 |
28.0% |
| Auction – CCEAR 2016 – T20 2 |
26.6 |
(790.93) |
207.85 |
-480.5% |
| Angra |
99.5 |
337.00 |
335.41 |
0.5% |
| CCGF 3 |
532.4 |
158.89 |
133.23 |
19.3% |
| Santo Antônio |
140.6 |
192.84 |
185.53 |
3.9% |
| Jirau |
234.0 |
169.67 |
163.25 |
3.9% |
| Others Auctions 4 |
785.0 |
210.83 |
230.95 |
-8.7% |
| Total / Average Purchuse Tariff |
2,686.1 |
199.24 |
212.12 |
-6.1% |
| Contains PIS and COFINS |
|
|
|
|
| 1 Furnas transport charge not included. |
|
|
|
|
| 2 Average auction price restated according as bilateral payment to vendors. It does not include hiring effects recorded by the CCEE. |
|
|
|
|
| 3 Contract of quotas of assured power of those HPPs which concessions were extended pursuant the new rules of Law 12783/13. |
|
|
|
|
| 4 Products average price, does not include PROINFA. |
|
|
|
|
| *The table has been updated for all periods as new calculation methodology for average prices, a result of the 4th phase of the Public Hearing 78/2011 Aneel approved on 03.28.2016. |
| |
|
|
|
|
| Retail Tariff - Copel Distribuição (R$/MWh) |
|
Dec-23 |
Dec-22 |
Δ% |
| |
| Industrial |
|
555.58 |
506.44 |
9.7% |
| Residential |
|
551.81 |
530.23 |
4.1% |
| Commercial |
|
619.93 |
598 |
3.7% |
| Rural |
|
606.40 |
570.28 |
6.3% |
| Other |
|
462.82 |
407.55 |
13.6% |
| Retail Tariff supply average tariff |
|
618.52 |
583.46 |
6.0% |
| Demand average tariff (R$/kW) |
|
38.24 |
29.82 |
28.2% |
| Does not consider tariff flags, Pis/Pasep and net of ICMS. |
|
|
|
|
| Exhibit III - ENERGY MARKET> ELECTRICITY PURCHASED AND CHARGES |
| |
|
|
|
|
|
R$'000 |
| Electricity Purchased for Resale |
4Q23 |
4Q22 |
Δ% |
2023 |
2022 |
Δ% |
| Purchase of energy in the regulated party - CCEAR |
925,266 |
917,953 |
0.8 |
3,658,852 |
3,538,507 |
3.4 |
| Itaipu Binacional |
252,378 |
368,504 |
(31.5) |
980,302 |
1,460,955 |
(32.9) |
| Câmara de Comercialização de Energia - CCEE |
79,778 |
67,738 |
17.8 |
431,303 |
370,207 |
16.5 |
| Micro and mini generators and customer repurchase |
346,162 |
197,863 |
75.0 |
1,125,857 |
675,804 |
66.6 |
| Proinfa |
93,763 |
107,315 |
(12.6) |
370,495 |
437,461 |
(15.3) |
| Bilateral Agreements |
547,379 |
669,906 |
(18.3) |
1,998,640 |
2,609,713 |
(23.4) |
| Fair value in the purchase and sale of energy |
(6,347) |
(4,139) |
53.3 |
- |
- |
- |
| (-) PIS/Pasep and Cofins |
(216,315) |
(252,353) |
(14.3) |
(849,259) |
(995,737) |
(14.7) |
| TOTAL |
2,022,064 |
2,072,787 |
(2.4) |
7,716,190 |
8,096,910 |
(4.7) |
| |
|
|
|
|
|
|
| |
|
|
|
|
|
R$'000 |
| Charges of the main distribution and transmission grid |
4Q23 |
4Q22 |
Δ% |
2023 |
2022 |
Δ% |
| Itaipu transportation charges |
55,063 |
40,529 |
35.9 |
188,817 |
150,158 |
25.7 |
| System Service Charges - ESS |
38,564 |
1,260 |
- |
79,358 |
340,254 |
(76.7) |
| System usage charges |
668,698 |
561,868 |
19.0 |
2,494,191 |
1,982,465 |
25.8 |
| Charge reserve energy - EER |
104,725 |
97,462 |
7.5 |
452,513 |
297,057 |
52.3 |
| System usage charges - Provisions |
(85) |
(73) |
16.8 |
11,595 |
2,031 |
470.7 |
| (-) PIS / Pasep and Cofins taxes on charges for use of power grid |
(88,745) |
(71,777) |
23.6 |
(329,766) |
(283,968) |
16.1 |
| TOTAL |
778,220 |
629,269 |
23.7 |
2,896,708 |
2,487,997 |
16.4 |
| Exhibit III - ENERGY MARKET> ENERGY BALANCE |
| |
|
|
|
|
(average MW) |
| Energy Balance - Copel GET - Dec-23 |
2023 |
2024 |
2025 |
2026 |
2027 |
| Own Resources GeT |
2,099 |
2,111 |
2,088 |
2,090 |
2,078 |
| GeT |
1,488 |
1,507 |
1,487 |
1,489 |
1,469 |
| GPS + Bela Vista + FDA |
611 |
604 |
601 |
601 |
609 |
| Own Resources SPP and Wind Farm |
544 |
544 |
544 |
544 |
544 |
| Purchases |
75 |
59 |
43 |
- |
- |
| TOTAL OWN RESOURCES + SOLD |
2,718 |
2,714 |
2,675 |
2,634 |
2,622 |
| TOTAL SOLD |
2,447 |
2,229 |
2,053 |
1,588 |
1,377 |
| Sales (Regulated) |
884 |
766 |
781 |
781 |
781 |
| Sales (Regulated) % |
33% |
29% |
29% |
30% |
30% |
| Sales (Free Market) |
1,563 |
1,463 |
1,272 |
807 |
596 |
| Sales (Free Market) % |
57% |
55% |
48% |
31% |
22% |
| Total Available |
271 |
485 |
622 |
1046 |
1245 |
| Total Available (%) |
10% |
16% |
23% |
39% |
48% |
| Avarege price of energy sold (R$) |
206.63 |
176.89 |
171.17 |
178.24 |
184.01 |
| Reference: December/23 |
|
|
|
|
|
| Note: Considers Assured Power updated by Ordinance No. 709/2022 for: FDA, Segredo and Salto Caxias. |
|
|
|
| (1) Includes Mauá and Baixo Iguaçu Power Plants (proportional to the stake in the project) and GPS 30% (ex-CCGF). Does not include Elejor and Foz do Chopim. |
| (2) Does not include Voltália Wind Complex. |
|
|
|
|
|


| Exhibit III - ENERGY MARKET> WIND POWER PRICES |
| Wind Farms - Sold |
Auction ¹ |
Price (R$)² |
Amount
MW average/year |
Start of Supply |
End of
Supply |
| São Bento Energia, Invest. e Part. S.A. |
|
|
|
|
|
| GE Boa Vista S.A. |
2º LFA
(08/26/2010) |
300.43 |
5.70 |
01.01.2013 |
12.31.2032 |
| GE Farol S.A. |
291.67 |
9.10 |
| GE Olho D’Água S.A. |
291.67 |
14.90 |
| GE São Bento do Norte S.A. |
291.67 |
14.00 |
| Copel Brisa Potiguar S.A. |
|
|
|
|
|
| Nova Asa Branca I Energias Renováveis S.A. |
2º LFA
(08/26/2010) |
294.79 |
13.20 |
01.01.2013 |
12.31.2032 |
| Nova Asa Branca II Energias Renováveis S.A. |
294.79 |
12.80 |
| Nova Asa Branca III Energias Renováveis S.A. |
294.79 |
12.50 |
| Nova Eurus IV Energias Renováveis S.A. |
294.79 |
13.70 |
| Santa Maria Energias Renováveis S.A. |
4º LER
(08/18/2011) |
207.75 |
15.70 |
07.01.2014 |
06.30.2034 |
| Santa Helena Energias Renováveis S.A. |
207.75 |
16.00 |
| Ventos de Santo Uriel S.A. |
206.14 |
9.00 |
| Cutia |
|
|
|
|
|
| UEE Cutia S.A. |
6º LER
(10/31/2014) |
244.37 |
9.60 |
10.01.2017 |
09.30.2037 |
| UEE Esperança do Nordeste S.A. |
244.37 |
9.10 |
| UEE Guajiru S.A. |
244.37 |
8.30 |
| UEE Jangada S.A. |
244.37 |
10.30 |
| UEE Maria Helena S.A. |
244.37 |
12.00 |
| UEE Paraíso dos Ventos do Nordeste S.A. |
244.37 |
10.60 |
| UEE Potiguar S.A. |
244.37 |
11.30 |
| Bento Miguel |
|
|
|
|
|
| CGE São Bento do Norte I S.A. |
20ª LEN
(11/28/2014) |
231.47 |
9.70 |
01.01.2019 |
12.31.2038 |
| CGE São Bento do Norte II S.A. |
231.47 |
10.00 |
| CGE São Bento do Norte III S.A. |
231.47 |
9.60 |
| CGE São Miguel I S.A. |
231.47 |
8.70 |
| CGE São Miguel II S.A. |
231.47 |
8.40 |
| CGE São Miguel III S.A. |
231.47 |
8.40 |
| Vilas |
|
|
|
|
|
| Vila Ceará I (Antiga Vila Paraíba IV) |
28ª LEN
(08/31/2018) |
124.46 |
8.20 |
01.01.2024 |
12.31.2043 |
| Vila Maranhão I |
124.46 |
8.30 |
| Vila Maranhão II |
124.46 |
8.30 |
| Vila Maranhão III (Antiga Vila Paraíba III) |
124.46 |
8.20 |
| Vila Mato Grosso (Antiga Vila Alagoas III) |
29ª LEN
(06/28/2019) |
103.83 |
3.30 |
01.01.2023 |
12.31.2042 |
| Jandaira |
|
|
|
|
|
| Jandaira I |
30ª LEN
(10/18/2019) |
126.97 |
1.60 |
01.01.2025 |
12.31.2044 |
| Jandaira II |
126.97 |
4.10 |
| Jandaira III |
126.97 |
4.40 |
| Jandaira IV |
126.97 |
4.30 |
| Aventura |
|
|
|
|
|
| Aventura II |
26º LEN
(20/12/2017) |
134.22 |
11.70 |
01.01.2023 |
12.31.2042 |
| Aventura III |
134.22 |
12.80 |
| Aventura IV |
134.22 |
14.10 |
| Aventura V |
134.22 |
15.00 |
| Santa Rosa & Mundo Novo |
|
|
|
|
|
| Santa Rosa & Mundo Novo I |
26º LEN
(20/12/2017) |
136.99 |
16.50 |
01.01.2023 |
12.31.2042 |
| Santa Rosa & Mundo Novo II |
136.99 |
17.00 |
| Santa Rosa & Mundo Novo III |
136.99 |
18.00 |
| Santa Rosa & Mundo Novo IV |
136.99 |
7.50 |
| Santa Rosa & Mundo Novo V |
136.99 |
8.10 |
| Voltália3 |
|
|
|
|
|
| Carnaúbas |
04ª LER
(08/18/2011) |
201.52 |
13.10 |
07.01.2014 |
06.30.2034 |
| Reduto |
201.52 |
13.90 |
| Santo Cristo |
201.52 |
14.80 |
| São João |
201.52 |
14.30 |
| ¹LFA - Alternative Sources Auction/LER - Reserve Energy Auction/LEN - New Energy Auction. |
|
|
|
|
|
| ² Price updated by IPCA until dec/2023 (Reference jan/24). Source: CCEE |
|
|
|
|
|
| 3 Values presented refer to 100% of the Complex. Copel has a 49% stake in the project. |
|
|
|
|
|
| Exhibit III - ENERGY MARKET> ENERGY FLOW |
| |
|
|
|
|
|
|
|
|
|
|
|
GWh |
| Energy Flow |
COPEL DIS |
COPEL GET
+ FDA + BELA VISTA |
WIND POWER |
COPEL COM |
ELIMINATIONS |
CONSOLIDATED |
| 4Q23 |
4Q22 |
4Q23 |
4Q22 |
4Q23 |
4Q22 |
4Q23 |
4Q22 |
4Q23 |
4Q22 |
4Q23 |
4Q22 |
| Own Generation |
|
|
6,995 |
6,979 |
1,092 |
887 |
|
|
|
|
8,087 |
7,866 |
| Purchased energy |
6,122 |
6,455 |
151 |
370 |
- |
- |
5,726 |
6,209 |
3,264 |
3,884 |
8,735 |
9,150 |
| Copel Mercado Livre |
|
|
- |
309 |
- |
- |
|
|
- |
309 |
- |
- |
| Companies of the group |
60 |
39 |
|
|
- |
|
3,204 |
3,536 |
3,264 |
3,575 |
- |
- |
| Itaipu |
1,200 |
1,329 |
|
|
|
|
- |
|
|
|
1,200 |
1,329 |
| Auction – CCEAR |
3,352 |
3,130 |
|
|
|
|
- |
|
|
|
3,352 |
3,130 |
| CCEE (MCP) |
- |
- |
- |
- |
|
|
6 |
|
|
|
6 |
- |
| Angra |
220 |
234 |
|
|
|
|
|
|
|
|
220 |
234 |
| CCGF |
1,159 |
1,505 |
|
|
|
|
|
|
|
|
1,159 |
1,505 |
| Proinfa |
113 |
119 |
|
|
|
|
|
|
|
|
113 |
119 |
| Other (1) |
18 |
99 |
|
|
- |
- |
2,504 |
2,673 |
|
|
2,522 |
2,772 |
| Elejor |
|
|
|
|
|
|
12 |
- |
|
|
12 |
- |
| Dona Francisca |
|
|
34 |
34 |
|
|
|
|
|
|
34 |
34 |
| MRE Receipt |
|
|
117 |
27 |
|
|
|
|
|
|
117 |
27 |
| Avaiable |
6,122 |
6,455 |
7,146 |
7,349 |
1,092 |
887 |
5,726 |
6,209 |
3,264 |
3,940 |
16,822 |
16,959 |
| Captive Market |
5,321 |
4,746 |
|
|
|
|
|
|
|
|
5,321 |
4,746 |
| Concessionaires (2) |
23 |
22 |
|
|
|
|
|
|
|
|
23 |
22 |
| CCEE concessionaire supply (3) |
|
|
43 |
36 |
|
|
|
|
|
|
43 |
36 |
| CCEE (MCSD EN Assignments) (4) |
75 |
80 |
|
|
|
|
|
|
|
|
75 |
80 |
| CCEE (MVE) (5) |
- |
177 |
|
|
|
|
|
|
|
|
- |
177 |
| CCEE (MCP) (6) |
249 |
936 |
379 |
249 |
5 |
34 |
- |
47 |
|
|
633 |
1,266 |
| Free Customers |
|
|
- |
- |
|
|
3,022 |
2,802 |
|
|
3,022 |
2,802 |
| Bilateral Agreements |
|
|
- |
- |
172 |
148 |
2,704 |
3,051 |
|
|
2,876 |
3,199 |
| Auction – CCEAR (7) |
|
|
583 |
566 |
575 |
325 |
|
|
|
|
1,158 |
891 |
| MRE assignment (8) |
|
|
3,054 |
3,015 |
|
|
|
|
|
|
3,054 |
3,015 |
| CER (9) |
|
|
|
|
231 |
231 |
|
|
|
|
231 |
231 |
| Copel Mercado Livre |
|
|
3,056 |
3,452 |
148 |
140 |
|
|
3,204 |
3,592 |
- |
- |
| Companies of the group |
|
|
31 |
31 |
29 |
8 |
- |
309 |
60 |
348 |
- |
- |
| Losses and Differences (10) |
454 |
493 |
|
|
-68 |
1 |
|
|
|
|
386 |
494 |
| |
|
|
|
|
|
|
|
|
|
|
|
|
| Energy Flow |
COPEL DIS |
COPEL GET
+ FDA + BELA VISTA |
WIND POWER |
COPEL COM |
ELIMINATIONS |
CONSOLIDATED |
| 2023 |
2022 |
2023 |
2022 |
2023 |
2022 |
2023 |
2022 |
2023 |
2022 |
2023 |
2022 |
| Own Generation |
- |
- |
21,845 |
21,936 |
3,952 |
2,785 |
0 |
- |
- |
- |
25,797 |
24,721 |
| Purchased energy |
24,072 |
25,443 |
1,048 |
3,064 |
127 |
108 |
22,450 |
24,817 |
13,515 |
15,574 |
34,182 |
37,858 |
| Copel Mercado Livre |
- |
- |
398 |
1,208 |
106 |
- |
- |
- |
504 |
1,208 |
- |
- |
| Companies of the group |
233 |
155 |
- |
- |
- |
- |
12,778 |
14,211 |
13,011 |
14,366 |
- |
- |
| Itaipu |
4,761 |
5,272 |
- |
- |
- |
- |
- |
- |
- |
- |
4,761 |
5,272 |
| Auction – CCEAR |
13,142 |
12,354 |
- |
- |
- |
- |
- |
- |
- |
- |
13,142 |
12,354 |
| CCEE (MCP) |
- |
- |
296 |
63 |
- |
- |
91 |
12 |
- |
- |
387 |
75 |
| Angra |
872 |
928 |
- |
- |
- |
- |
- |
- |
- |
- |
872 |
928 |
| CCGF |
4,568 |
5,901 |
- |
- |
- |
- |
- |
- |
- |
- |
4,568 |
5,901 |
| Proinfa |
427 |
441 |
- |
- |
- |
- |
- |
- |
- |
- |
427 |
441 |
| Other (1) |
69 |
392 |
- |
- |
21 |
108 |
9,537 |
10,594 |
- |
- |
9,627 |
11,094 |
| Elejor |
- |
- |
- |
- |
- |
- |
44 |
- |
- |
- |
44 |
- |
| Dona Francisca |
- |
- |
134 |
134 |
- |
- |
- |
- |
- |
- |
134 |
134 |
| MRE Receipt |
- |
- |
220 |
1,659 |
- |
- |
- |
- |
- |
- |
220 |
1,659 |
| Avaiable |
24,072 |
25,443 |
22,893 |
25,000 |
4,079 |
2,893 |
22,450 |
24,817 |
13,515 |
15,630 |
59,979 |
62,521 |
| Captive Market |
20,173 |
19,370 |
- |
- |
- |
- |
- |
- |
- |
- |
20,173 |
19,370 |
| Concessionaires (2) |
89 |
91 |
- |
- |
- |
- |
- |
- |
- |
- |
89 |
91 |
| CCEE concessionaire supply (3) |
- |
- |
164 |
150 |
- |
- |
- |
- |
- |
- |
164 |
150 |
| CCEE (MCSD EN Assignments) (4) |
247 |
239 |
- |
- |
- |
- |
- |
- |
- |
- |
247 |
239 |
| CCEE (MVE) (5) |
- |
702 |
- |
- |
- |
- |
- |
- |
- |
- |
- |
702 |
| CCEE (MCP) (6) |
2,136 |
3,069 |
188 |
854 |
-2 |
122 |
243 |
162 |
- |
- |
2,565 |
4,207 |
| Free Customers |
- |
- |
- |
- |
- |
- |
11,884 |
11,498 |
- |
- |
11,884 |
11,498 |
| Bilateral Agreements |
- |
- |
106 |
108 |
621 |
482 |
9,819 |
11,949 |
- |
- |
10,546 |
12,539 |
| Auction – CCEAR (7) |
- |
- |
3,772 |
2,215 |
2,201 |
1,289 |
- |
- |
- |
- |
5,973 |
3,504 |
| MRE assignment (8) |
- |
- |
6,361 |
7,657 |
- |
- |
- |
- |
- |
- |
6,361 |
7,657 |
| CER (9) |
- |
- |
- |
- |
916 |
916 |
- |
- |
- |
- |
916 |
916 |
| Copel Mercado Livre |
- |
- |
12,180 |
13,893 |
598 |
374 |
- |
- |
12,778 |
14,267 |
- |
- |
| Companies of the group |
- |
- |
122 |
123 |
111 |
32 |
504 |
1,208 |
737 |
1,363 |
- |
- |
| Losses and Differences (10) |
1,427 |
1,969 |
- |
- |
-366 |
-322 |
- |
- |
- |
- |
1,061 |
1,648 |
| |
|
|
|
|
|
|
|
|
|
|
|
|
| (1) Others: Energy purchased by Copel Comercialização. Includes MCSD EM Assignments of Copel Distribuição (purchase) |
|
|
|
|
|
|
|
|
| (2) Energy supply to concessionaires and licensees with their own market below 500GWh/year |
|
|
|
|
|
|
|
|
|
| (3) Supply of energy to CCEE's agent distributor, through a Regulated Bilateral Contract Agreement - CBR |
|
|
|
|
|
|
|
|
|
| (4) Assignments MCSD EN - Contractual assignments to other distributors through the New Energy Surplus and Deficit Compensation Mechanism |
|
|
|
|
|
|
|
| (5) CCEE (MVE): Financial settlement of energy surpluses from the distributor to the free market through the Surplus Sale Mechanism |
|
|
|
|
|
|
|
|
| (6) CCEE (MCP): Electric Energy Commercialization Chamber (Spot Market). |
|
|
|
|
|
|
|
|
|
|
| (7) CCEAR: Energy Trading Agreement in the Regulated Environment. |
|
|
|
|
|
|
|
|
|
|
|
| (8) MRE: Energy Reallocation Mechanism. |
|
|
|
|
|
|
|
|
|
|
|
|
| (9) CER: Reserve Energy Contract. |
|
|
|
|
|
|
|
|
|
|
|
|
| (10) Considers the effects of Mini and Micro Distributed Generation (MMGD). |
|
|
|
|
|
|
|
|
|
|
| (11) CG: Submarket Center of Gravity (difference between billed and received energy at the CG). |
|
|
|
|
|
|
|
|
|
| It does not consider the energy produced by UTE Araucária sold on the spot market (MCP). |
|
|
|
|
|
|
|
|
|
|
| Exhibit III - ENERGY MARKET> ENERGY FLOW |
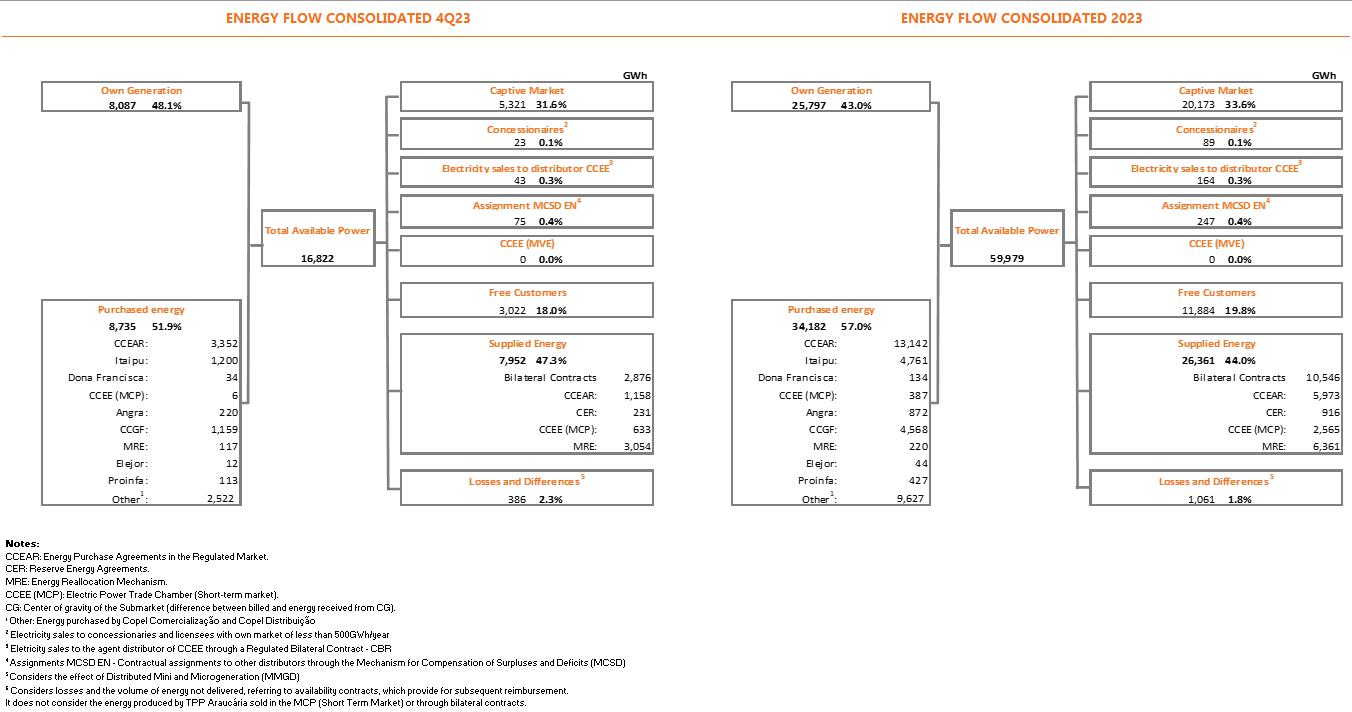
| Exhibit IV - OPERATIONAL DATA> INDICATORS SUMMARY |
| MANAGEMENT |
|
|
|
|
|
|
| Copel Staff List |
2018 |
2019 |
2020 |
2021 |
2022 |
Dec-23 |
| Geração e Transmissão |
1,660 |
1,620 |
1,533 |
1,523 |
1,487 |
1,477 |
| Distribuição |
5,364 |
4,964 |
4,641 |
4,430 |
4,257 |
4,203 |
| Telecomunicações |
478 |
412 |
355 |
- |
- |
- |
| Holding |
75 |
61 |
96 |
169 |
84 |
83 |
| Comercialização |
34 |
38 |
42 |
44 |
47 |
41 |
| Serviços |
- |
- |
- |
217 |
- |
- |
| TOTAL |
7,611 |
7,095 |
6,667 |
6,383 |
5,875 |
5,804 |
| |
|
|
|
|
|
|
| Cotrolated Staff List |
2018 |
2019 |
2020 |
2021 |
2022 |
Dec-23 |
| Compagás |
159 |
148 |
142 |
133 |
132 |
129 |
| UEG Araucária |
17 |
16 |
17 |
15 |
15 |
7 |
| Elejor |
7 |
7 |
7 |
7 |
7 |
14 |
| |
|
|
|
|
|
|
| GENERATION |
|
|
|
|
|
|
| Copel GET |
Amount |
Installed
Capacity (MW) |
Assured Power
(Average MW) |
| Hydroelectric |
18 |
|
4,868.5 |
|
2,067.9 |
|
| Thermoelectric |
1 |
|
20.0 |
|
17.7 |
|
| Wind |
43 |
|
1,130.2 |
|
561.3 |
|
Copel GET
(Interest) |
|
Proportional installed
capacity (MW) |
Proporcional Assured Power
(Average MW) |
| Hydroelectric |
3 |
|
299.6 |
|
155.2 |
|
| Thermoelectric |
1 |
|
294.8 |
|
162.6 |
|
| Total Copel GET |
|
|
6,613.1 |
|
2,964.7 |
|
| Other Interest Copel |
|
Proportional installed
capacity (MW) |
Proporcional Assured Power
(Average MW) |
| Hydroelectric |
5 |
|
201.3 |
|
109.7 |
|
| Thermoelectric |
1 |
|
98.3 |
|
54.2 |
|
| Wind |
4 |
|
53.2 |
|
28.0 |
|
| Solar |
1 |
|
1.1 |
|
- |
|
| Total Other Interest |
11 |
|
353.9 |
|
191.9 |
|
| TOTAL Copel Group |
|
|
6,967.0 |
|
3,156.6 |
|
| |
|
|
|
|
|
|
| TRANSMISSION |
|
|
|
|
|
|
| Copel GeT |
Amount |
|
APR (R$ million) |
| Transmission Lines (km) |
|
3,705 |
|
1,049.2 |
| Substation (amount) |
|
45 |
|
| Interest |
Amount |
|
Proporcional APR (R$ million) |
| Transmission Lines (km) |
|
5,980 |
|
512.8 |
| Substation (amount) |
|
8 |
|
| TOTAL |
TL |
9,685 |
|
1,562.0 |
| Substation |
53 |
|
| |
|
|
|
|
|
|
| DISTRIBUTION |
|
|
|
|
|
|
| Distribution lines (km) |
211,318 |
|
|
Captive customers |
5,098,006 |
|
| Substations |
394 |
|
|
Customers by distribution employee |
1,213 |
|
| Installed power substations (MVA) |
11,799 |
|
|
DEC (in hundredths of an hour and minute) |
7.86 |
|
| Municipalities served |
395 |
|
|
FEC (number of outages) |
5.21 |
|
| Locations served |
1,068 |
|
|
|
|
|
| |
|
|
|
|
|
|
| MERCADO LIVRE |
|
|
|
|
|
|
| Number of contracts |
1,747 |
|
|
|
|
|
| Energy sold (GWh) |
5,726 |
|
|
|
|
|
| Exhibit IV - OPERATIONAL DATA> GENERATION |
| COPEL GET |
|
|
|
|
| |
Installed
Capacity (MW) |
Assured Power
(Average MW) |
Generation 2023
(GWh)* |
Concession Expires |
| Hydroelectric Power Plants |
4,868.5 |
2,067.9 |
21,027.0 |
|
| Large hydroelectric power plant (HPP) |
4,772.0 |
2,006.8 |
20,519.8 |
|
| Gov. Bento Munhoz da Rocha Netto (Foz do Areia)(5) |
1,676.0 |
575.3 |
6,315.1 |
12.21.2024 |
| Gov. Ney Aminthas de B. Braga (Segredo)(5) |
1,260.0 |
558.3 |
5,952.4 |
09.25.2032 |
| Gov. José Richa (Salto Caxias)(5) |
1,240.0 |
575.4 |
5,829.2 |
03.20.2033 |
| Gov. Parigot de Souza (1)(5) |
260.0 |
103.6 |
1,080.6 |
01.03.2053 |
| - Regime de Cotas (70%) |
182.0 |
72.5 |
756.4 |
| - Copel GeT(30%) |
78.0 |
31.1 |
324.2 |
| Colíder(5) |
300.0 |
178.1 |
1,171.4 |
01.30.2046 |
| Guaricana(5) |
36.0 |
16.1 |
171.1 |
07.21.2028 |
| Small hydroelectric power station (SHP) |
86.9 |
55.9 |
470.7 |
|
| Bela Vista(2) |
29.8 |
18.6 |
141.4 |
01.02.2041 |
| Cavernoso (5) |
1.3 |
1.0 |
1.3 |
06.23.2033 |
| Cavernoso II(5) |
19.0 |
10.6 |
98.9 |
12.06.2050 |
| Chaminé (5) |
18.0 |
11.6 |
103.4 |
08.02.2028 |
| Apucaraninha (5) |
10.0 |
6.7 |
62.3 |
01.27.2027 |
| Derivação do Rio Jordão (5) |
6.5 |
5.9 |
49.5 |
06.21.2032 |
| São Jorge (5) |
2.3 |
1.5 |
14.0 |
07.24.2026 |
| hydroelectric power plant (HPP) |
9.6 |
5.2 |
36.5 |
|
| Marumbi |
4.8 |
2.4 |
22.3 |
(6) |
| Chopim I |
2.0 |
1.5 |
1.2 |
(3) |
| Melissa |
1.0 |
0.6 |
4.9 |
(3) |
| Salto do Vau |
0.9 |
0.6 |
5.5 |
(3) |
| Pitangui |
0.9 |
0.1 |
2.6 |
(3) |
| Thermal Power Plant |
20.0 |
17.7 |
40.1 |
|
| Figueira |
20.0 |
17.7 |
40.1 |
03.27.2019 |
| Wind Power Plants |
1,130.2 |
561.3 |
4,055.7 |
|
| Eólica de Palmas (4) |
2.5 |
0.4 |
2.29 |
09.29.2029 |
| São Bento Energia, Invest. e Part. S.A. |
94.0 |
38.1 |
286.9 |
|
| GE Boa Vista S.A. |
14.0 |
5.2 |
34.4 |
04.28.2046 |
| GE Farol S.A. |
20.0 |
8.8 |
61.5 |
04.20.2046 |
| GE Olho D’Água S.A. |
30.0 |
12.8 |
98.5 |
06.01.2046 |
| GE São Bento do Norte S.A. |
30.0 |
11.3 |
92.5 |
05.19.2046 |
| Copel Brisa Potiguar S.A. |
183.6 |
89.4 |
562.6 |
|
| Nova Asa Branca I Energias Renováveis S.A. |
27.0 |
12.1 |
79.2 |
04.25.2046 |
| Nova Asa Branca II Energias Renováveis S.A. |
27.0 |
11.9 |
76.8 |
05.31.2046 |
| Nova Asa Branca III Energias Renováveis S.A. |
27.0 |
12.3 |
64.3 |
05.31.2046 |
| Nova Eurus IV Energias Renováveis S.A. |
27.0 |
12.4 |
84.4 |
04.27.2046 |
| Santa Maria Energias Renováveis S.A. |
29.7 |
15.7 |
95.6 |
05.08.2047 |
| Santa Helena Energias Renováveis S.A. |
29.7 |
16.0 |
105.8 |
04.09.2047 |
| Ventos de Santo Uriel S.A. |
16.2 |
9.0 |
56.5 |
04.09.2047 |
| Complexo Eólico Cutia |
180.6 |
71.4 |
591.9 |
|
| UEE Cutia S.A. |
23.1 |
9.6 |
82.7 |
01.05.2042 |
| UEE Esperança do Nordeste S.A. |
27.3 |
9.1 |
69.4 |
05.11.2050 |
| UEE Guajiru S.A. |
21.0 |
8.3 |
66.0 |
01.05.2042 |
| UEE Jangada S.A. |
27.3 |
10.3 |
96.7 |
01.05.2042 |
| UEE Maria Helena S.A. |
27.3 |
12.0 |
94.5 |
01.05.2042 |
| UEE Paraíso dos Ventos do Nordeste S.A. |
27.3 |
10.6 |
91.9 |
05.11.2050 |
| UEE Potiguar S.A. |
27.3 |
11.5 |
90.8 |
05.11.2050 |
| Complexo Eólico Bento Miguel |
132.3 |
58.7 |
425.7 |
|
| CGE São Bento do Norte I S.A. |
23.1 |
10.1 |
79.6 |
08.04.2050 |
| CGE São Bento do Norte II S.A. |
23.1 |
10.8 |
86 |
08.04.2050 |
| CGE São Bento do Norte III S.A. |
23.1 |
10.2 |
71.9 |
08.04.2050 |
| CGE São Miguel I S.A. |
21.0 |
9.3 |
63 |
08.04.2050 |
| CGE São Miguel II S.A. |
21.0 |
9.1 |
63.1 |
08.04.2050 |
| CGE São Miguel III S.A. |
21.0 |
9.2 |
62.1 |
08.04.2050 |
| Complexo Eólico Vilas (8) |
186.7 |
98.6 |
610.8 |
|
| Vila Ceará I (Antiga Vila Paraíba IV) |
32.0 |
17.8 |
100.8 |
01.14.2054 |
| Vila Maranhão I |
32.0 |
17.8 |
113.4 |
01.11.2054 |
| Vila Maranhão II |
32.0 |
17.8 |
112.8 |
01.14.2054 |
| Vila Maranhão III (Antiga Vila Paraíba III) |
32.0 |
16.6 |
103.6 |
01.14.2054 |
| Vila Mato Grosso (Antiga Vila Alagoas III) |
58.9 |
28.6 |
180.2 |
12.06.2054 |
| Complexo Jandaira |
90.1 |
46.9 |
346.6 |
|
| Jandaira I |
10.4 |
5.6 |
45.97 |
04.02.2055 |
| Jandaira II |
24.3 |
12.3 |
100.38 |
04.02.2055 |
| Jandaira III |
27.7 |
14.8 |
99.52 |
04.02.2055 |
| Jandaira IV |
27.7 |
14.2 |
100.76 |
04.02.2055 |
| Aventura 9 |
105.0 |
65.0 |
496.7 |
|
| Aventura II |
21.0 |
13.1 |
99.3 |
06.05.2053 |
| Aventura III |
25.2 |
15.5 |
117.6 |
06.11.2053 |
| Aventura IV |
29.4 |
18.5 |
142.5 |
06.05.2053 |
| Aventura V |
29.4 |
17.9 |
137.3 |
06.05.2053 |
| Santa Rosa e Mundo Novo 9 |
155.4 |
92.8 |
732.2 |
|
| Santa Rosa e Mundo Novo I |
33.6 |
17.3 |
132.47 |
06.04.2053 |
| Santa Rosa e Mundo Novo II |
29.4 |
17.2 |
147.23 |
06.04.2053 |
| Santa Rosa e Mundo Novo III |
33.6 |
21.5 |
171.55 |
06.04.2053 |
| Santa Rosa e Mundo Novo IV |
33.6 |
21.0 |
170.16 |
06.01.2053 |
| Santa Rosa e Mundo Novo V |
25.2 |
15.8 |
110.78 |
06.01.2053 |
| TOTAL |
6,018.7 |
2,646.9 |
25,122.8 |
|
(1) RAG of R$160.9 million, updated by Aneel's Resolution No. 3,225, of July 18, 2023.
(2) In partial operation, entry into commercial operation of the fourth generating unit scheduled for 2022.
(3) Power plants exempted from concession, are only registered with ANEEL.
(4) Assured power considered the average wind generation.
(5) Extension of Grant according to REH 2919/2021, 2932/2021 and 3.242/2023.
(6) Under approval by ANEEL. |
(7) Assured Power updated by Ordinance N°709/2022 for: FDA, Segredo, Salto Caxias and GPS, effective from January/2023.
(8) Started up in test operation on 04/25/2022, according to ANEEL Dispatch No. 1047/2022. In commercial operation since 12/07/2022, by ANEEL order No. 2502/2022.
(9) Complexes Aventura and Santa Rosa & Novo Mundo joined the Company's portfolio in Jan/23.
* Considers internal consumption of generators and generation in commercial operation.
** Plant do not participate in the MRE. |
| Exhibit IV - OPERATIONAL DATA > GENERATION |
| INTEREST |
|
|
|
|
|
|
| Enterprise |
Partners |
Installed
Capacity (MW) |
Assured Power 1
(Average MW) |
Proportional installed capacity (MW) |
Proporcional Assured Power
(Average MW) |
Concession Expires |
| Hydroelectric Power Plants |
|
1,111.7 |
586.8 |
500.9 |
264.9 |
|
| Large hydroelectric power plant (HPP) |
|
1,076.5 |
561.5 |
486.2 |
254.2 |
|
HPP Gov. Jayme Canet Junior (Mauá) 6
(Consórcio Energético Cruzeiro do Sul) |
COPEL GeT - 51%
Eletrosul - 49% |
361.0 |
188.5 |
184.1 |
96.1 |
06.28.2049 |
HPP Baixo Iguaçu
(Consórcio Empreendedor Baixo Iguaçu) |
COPEL GeT - 30%
Geração Céu Azul - 70% |
350.2 |
172.4 |
105.1 |
51.7 |
12.03.2049 |
HPP Santa Clara
(Elejor) |
COPEL - 70%
Paineira Participações - 30% |
120.2 |
66.0 |
84.2 |
46.2 |
05.10.2040 |
HPP Fundão
(Elejor) |
COPEL - 70%
Paineira Participações - 30% |
120.2 |
62.1 |
84.1 |
43.5 |
06.11.2040 |
HPP Dona Francisca
(DFESA) |
COPEL - 23,03%
Gerdau - 51,82%
Celesc - 23,03%
Statkraft - 2,12% |
125.0 |
72.5 |
28.8 |
16.7 |
09.21.2037 |
| Small hydroelectric power station (SHP) |
|
29.1 |
20.4 |
10.4 |
7.3 |
|
SHP Arturo Andreoli 6
(Foz do Chopim) |
COPEL GeT - 35,77%
Silea Participações - 64,23% |
29.1 |
20.4 |
10.4 |
7.3 |
07.07.2034 |
| hydroelectric power plant (HPP) |
|
6.1 |
4.9 |
4.3 |
3.4 |
|
SHP Santa Clara I
(Elejor) |
COPEL - 70%
Paineira Participações - 30% |
3.6 |
2.8 |
2.5 |
2.0 |
(2) |
SHP Fundão I
(Elejor) |
COPEL - 70%
Paineira Participações - 30% |
2.5 |
2.1 |
1.7 |
1.5 |
(2) |
| Thermal Power Plant |
|
484.2 |
267.0 |
393.1 |
216.8 |
|
TPP Araucária 3
(UEG Araucária) |
COPEL - 20,3%
COPEL GeT - 60,9%
Petrobras - 18,8% |
484.2 |
267.0 |
393.1 |
216.8 |
12.23.2029 |
| Wind Power Plants |
|
108.0 |
57.1 |
52.9 |
28.0 |
|
Voltalia - São Miguel
do Gostoso (5 parques) |
COPEL- 49%
Voltalia- 51% |
108.0 |
57.1 |
52.9 |
28.0 |
(4) |
| Solar |
|
2.3 |
- |
1.1 |
- |
|
| Solar Paraná 5 |
COPEL - 49%
|
2.3 |
- |
1.1 |
- |
09.15.2046 |
| TOTAL |
|
1,706.2 |
910.9 |
948.0 |
509.7 |
|
| 1 Assured power updated by Ordinance No. 709/2022 of: HPP Mauá, Santa Clara, Fundão and Dona Francisca, effective from January/2023. |
| 2 Elejor requested the reclassification of its Small Hydroelectric Power Plants - (SHPs) Fundão I and Santa Clara I to Hydroelectric Generating Centers (CGHs), as amended by Art. 8 of Law 9074/1995. This was formalized through ANEEL Authorizing Resolutions 14,744 and 14,745 of 06/20/2023, with the plants exempted from concession, having only registration with ANEEL. |
| 3 Since February 1, 2014, the plant’s operation has been under the responsibility of UEGA. The Araucária TPP does not have availability agreements and operates under the merchant model. The most recent data from SIGA/ANEEL indicate a Assured power of 267 MW, however, there is no Assured power for the operation of the plant under the terms of MME Ordinance No. 64/2023. |
| 4 The Concession Expires of the wind farm concessions are respectively: Carnaúbas (04.09.2047), Reduto (04.16.2047), Santo Cristo (04.18.2047), São João (03.26.2047). |
| 5 Holding of 6 SCPs operating in the field of distributed generation (photovoltaic plants): Pharma Solar II, Pharma Solar III, Pharma Solar IV, in commercial operation, e Bandeirantes Solar I, Bandeirantes Solar II e Bandeirantes Solar III, in pre-operational. |
| 6 Extension of Grant according to REH 3.242/2023. |
| Exhibit IV - OPERATIONAL DATA > TRANSMISSION |
| Subsidiary / SPC |
Contract |
Enterprise |
TL |
|
APR ¹ (R$ milhões) |
Concession Expiration |
| Extension (km)2 |
Amount |
MVA |
| Copel GeT |
060/20013 |
Several |
2,129 |
35 |
12,590 |
661.3 |
01.01.2043 |
| Copel GeT |
075/20014 |
TL Bateias - Jaguariaiva |
138 |
- |
- |
16.8 |
08.17.2031 |
| Copel GeT |
006/2008 |
TL Bateias - Pilarzinho |
32 |
- |
- |
3.5 |
03.17.2038 |
| Copel GeT |
027/2009 |
TL Foz - Cascavel Oeste |
117 |
- |
- |
16.0 |
11.19.2039 |
| Copel GeT |
010/2010 |
TL Araraquara II — Taubaté |
334 |
- |
- |
43.6 |
10.06.2040 |
| Copel GeT |
015/2010 |
SE Cerquilho III |
- |
1 |
300 |
7.0 |
10.06.2040 |
| Copel GeT |
022/2012 |
TL Foz do Chopim - Salto Osório
LT Londrina - Figueira |
102 |
- |
- |
7.8 |
08.27.2042 |
| Copel GeT |
002/2013 |
TL Assis — Paraguaçu Paulista II |
83 |
1 |
150 |
12.2 |
02.25.2043 |
| Copel GeT |
005/2014 |
TL Bateias - Curitiba Norte |
31 |
1 |
300 |
12.9 |
01.29.2044 |
| Copel GeT |
021/2014 |
TL Foz do Chopim - Realeza |
52 |
1 |
300 |
13.0 |
09.05.2044 |
| Copel GeT |
022/2014 |
TL Assis – Londrina |
122 |
- |
- |
27.1 |
09.05.2044 |
| Copel GeT |
006/165 |
Lot E: TL Baixo Iguaçu - Realeza; TL Uberaba - Curitiba Centro; TL Curitiba Leste - Blumenau; SE Medianeira; SE Curitiba Centro; SE Andirá leste; Other Sections |
255 |
4 |
900 |
154.8 |
04.07.2046 |
Costa Oeste
Copel Get - 100% |
001/2012 |
TL Cascavel Norte - Cascavel Oeste
TL Cascavel Norte - Umuarama Sul
SE Umuarama Sul |
159 |
1 |
300 |
19.0 |
01.12.2042 |
Marumbi
Copel GeT - 100% |
008/2012 |
TL Curitiba - Curitiba Leste |
29 |
1 |
672 |
27.3 |
05.10.2042 |
Uirapuru Transmissora
Copel GeT - 100% |
002/20056 |
TL Ivaiporã - Londrina |
122 |
- |
- |
26.9 |
03.04.2035 |
| Subtotal Copel GeT 7 |
|
|
3,705 |
45 |
15,512 |
1,049.2 |
|
Caiuá Transmissora
Copel GeT - 49%
Elecnor - 51% |
007/2012 |
TL Guaíra - Umuarama Sul
TL Cascavel Norte - Cascavel Oeste
SE Santa Quitéria / SE Cascavel Norte |
142 |
2 |
700 |
16.4 |
05.10.2042 |
Integração Maranhense
Copel GeT - 49%
Elecnor - 51% |
011/2012 |
TL Açailandia - Miranda II |
365 |
- |
- |
24.7 |
05.10.2042 |
Matrinchã
Copel GeT - 49%
State Grid - 51% |
012/2012 |
TL Paranaíta - Ribeirãozinho |
2,033 |
4 |
800 |
133.7 |
05.10.2042 |
Guaraciaba
Copel GeT - 49%
State Grid - 51% |
013/2012 |
TL Ribeirãozinho - Marimbondo |
930 |
1 |
- |
69.0 |
05.10.2042 |
Paranaíba
Copel GeT - 24,5%
Furnas - 24,5%
State Grid - 51% |
007/2012 |
TL Barreiras II - Pirapora II |
967 |
- |
- |
44.5 |
05.02.2043 |
Cantareira
Copel GeT - 49%
Elecnor - 51% |
19/2014 |
TL Estreito - Fernão Dias |
656 |
- |
- |
68.1 |
09.05.2044 |
Mata de Santa Genebra
Copel GeT - 50,1%
Furnas - 49,9% |
001/14 |
TL Araraquara II - Bateias |
887 |
1 |
3,600 |
156.4 |
05.14.2044 |
| Subtotal SPCs 8 |
|
|
5,980 |
8 |
5,100 |
512.8 |
|
| Total |
|
|
9,685 |
53 |
20,612 |
1,562.0 |
|
1 Proportional to Copel's interest in the project. Values referring to the 2023/2024 cycle, effective from July 1, 2023, according to REH 3.216/2023 - Technical Note No. 39/2023 – STR/ANEEL, of December 30, 2023. Considers investments that came into operation until 12/31/2023.
² Considers double circuit sections (circuits that share the same transmission tower).
³ Contract renewed according to Law 12,783/13. The O&M portion is part of the RBSE, under the terms of the Law. It will be received until the end of the concession (Jan/2043). The value of the APR for the 2023-2024 cycle, excluding the RBSE, according to REH 3,216/2023, is R$ 146.1 million. This amount refers to additional RAP for reinforcements and improvements, in effect when REH 3,216/2023 was published.
4 As of 10.31.2018, the APR was reduced by 50%.
5 The construction of 38 km of sectioning lines was foreseen in the implementation of the Andirá Leste and Medianeira SEs, 2 km of which for Contract 060/2001 and 36 km for LTs that do not belong to Copel GeT, which, despite being included in the APR, in reason for the investment made, will not be added to Copel's assets.
6 As of 07/09/2021, the APR was reduced by 50%.
7 Consolidated Result.
8 Equity Income. |
| Exhibit IV - OPERATIONAL DATA > DISTRIBUTION |
| OPERATIONAL DATA |
|
|
|
|
|
|
| |
|
|
|
|
|
|
| Number of Consumers |
Locations served |
Cities served |
Voltage |
Number of Substations |
MVA |
Km of lines |
| 5,101,084 |
1,068 |
395 |
13,8 kV |
0 |
5 |
112,871 |
| 34,5 kV |
236 |
1,685 |
90,902 |
| 69 kV |
36 |
2,477 |
778 |
| 138 kV |
122 |
7,632 |
6,767 |
| |
|
|
|
394 |
11,799 |
211,318 |
| |
|
|
|
|
|
|
| Consumer-to-employee ratio DIS |
2018 |
2019 |
2020 |
2021 |
2022 |
Dec-23 |
Captive Consumers |
4,637,804 |
4,713,240 |
4,835,852 |
4,926,608 |
5,011,555 |
5,098,006 |
| Copel Dis employees |
5,364 |
4,964 |
4,641 |
4,430 |
4,257 |
4,203 |
| Consum/Emp |
865 |
949 |
1,042 |
1,112 |
1,177 |
1,213 |
| |
|
|
|
|
|
|
| QUALITY OF SUPPLY |
|
|
|
|
|
|
| |
|
|
|
|
|
|
| |
Year |
DEC ¹
(hours) |
FEC ²
(outages) |
|
|
|
| |
2019 |
9.11 |
6.02 |
|
|
|
| |
2020 |
7.83 |
5.61 |
|
|
|
| |
2021 |
7.20 |
4.76 |
|
|
|
| |
2022 |
7.98 |
5.29 |
|
|
|
| |
2023 |
7.86 |
5.21 |
|
|
|
¹ DEC measured in hours and hundredths of an hour
² FEC expressed in number of interruptions and hundredths of a number of interruptions year to date
* Values of the last 12 months |
|
|
|
| Period |
Technical Loss |
Non-Technical Loss |
Total loss |
| Regulatory (1) |
Real (2) |
Regulatory (3) |
Calculated (4) |
Regulatory (5) |
Total (6) |
| Dec-19 |
6.05% |
5.97% |
4.70% |
2.77% |
8.14% |
7.28% |
| Dec-20 |
6.05% |
6.03% |
4.70% |
3.92% |
8.14% |
7.80% |
| Dec-21 |
5.79% |
5.84% |
4.56% |
4.58% |
7.72% |
7.73% |
| Dec-22 |
5.79% |
5.72% |
4.47% |
4.62% |
7.60% |
7.66% |
| Dec-23 |
5.79% |
5.90% |
4.47% |
4.54% |
7.78% |
7.81% |
| (1) Percentage established in the tariff review; |
| (2) Technical loss calculated and reported monthly to Aneel; |
| (3) Percentage established in the tariff review; |
| (4) Difference between reported total losses and technical losses calculated as a percentage established in the review and the total injected energy, also reported monthly to Aneel; |
| (5) (Regulatory percentage of PNT x informed BT Market + technical losses calculated as a percentage established in the review and the total energy injected) / Injected energy; |
| (6) Total loss on injected energy. |
| NOTE: In the calculation of the distributor's total losses, energy losses inherent to the electric power system (technical losses), commercial losses (mainly due to fraud, theft) and differences related to the shift in the billing schedule and the effects of the portion of mini and micro generation distributed in the Company's networkS |
SIGNATURE
Pursuant to the requirements of the Securities
Exchange Act of 1934, the registrant has duly caused this report to be signed on its behalf by the undersigned, thereunto duly
authorized.
Date February 29, 2024
| COMPANHIA PARANAENSE DE ENERGIA – COPEL |
| |
|
|
| By: |
/S/
Daniel Pimentel Slaviero
|
|
| |
Daniel Pimentel Slaviero
Chief Executive Officer |
|
FORWARD-LOOKING STATEMENTS
This press release may contain forward-looking statements.
These statements are statements that are not historical facts, and are based on management's current view and estimates of future
economic circumstances, industry conditions, company performance and financial results. The words "anticipates", "believes",
"estimates", "expects", "plans" and similar expressions, as they relate to the company, are intended
to identify forward-looking statements. Statements regarding the declaration or payment of dividends, the implementation of principal
operating and financing strategies and capital expenditure plans, the direction of future operations and the factors or trends
affecting financial condition, liquidity or results of operations are examples of forward-looking statements. Such statements reflect
the current views of management and are subject to a number of risks and uncertainties. There is no guarantee that the expected
events, trends or results will actually occur. The statements are based on many assumptions and factors, including general economic
and market conditions, industry conditions, and operating factors. Any changes in such assumptions or factors could cause actual
results to differ materially from current expectations.
Companhia Parana De Energ (NYSE:ELP)
Gráfico Histórico do Ativo
De Jan 2025 até Fev 2025

Companhia Parana De Energ (NYSE:ELP)
Gráfico Histórico do Ativo
De Fev 2024 até Fev 2025

