false
FY
0001156041
P10Y
P10Y
P10Y
P10Y
0001156041
2024-01-01
2024-12-31
0001156041
2024-12-31
0001156041
2025-02-21
0001156041
2023-12-31
0001156041
2023-01-01
2023-12-31
0001156041
us-gaap:CommonStockMember
2022-12-31
0001156041
us-gaap:AdditionalPaidInCapitalMember
2022-12-31
0001156041
us-gaap:RetainedEarningsMember
2022-12-31
0001156041
2022-12-31
0001156041
us-gaap:CommonStockMember
2023-12-31
0001156041
us-gaap:AdditionalPaidInCapitalMember
2023-12-31
0001156041
us-gaap:RetainedEarningsMember
2023-12-31
0001156041
us-gaap:CommonStockMember
2023-01-01
2023-12-31
0001156041
us-gaap:AdditionalPaidInCapitalMember
2023-01-01
2023-12-31
0001156041
us-gaap:RetainedEarningsMember
2023-01-01
2023-12-31
0001156041
us-gaap:CommonStockMember
2024-01-01
2024-12-31
0001156041
us-gaap:AdditionalPaidInCapitalMember
2024-01-01
2024-12-31
0001156041
us-gaap:RetainedEarningsMember
2024-01-01
2024-12-31
0001156041
us-gaap:CommonStockMember
2024-12-31
0001156041
us-gaap:AdditionalPaidInCapitalMember
2024-12-31
0001156041
us-gaap:RetainedEarningsMember
2024-12-31
0001156041
us-gaap:OilAndGasMember
2024-01-01
2024-12-31
0001156041
us-gaap:OilAndGasMember
2023-01-01
2023-12-31
0001156041
us-gaap:OfficeEquipmentMember
2020-01-01
0001156041
us-gaap:OfficeEquipmentMember
2024-12-31
0001156041
us-gaap:OfficeEquipmentMember
2023-12-31
0001156041
us-gaap:WarrantMember
2024-01-01
2024-12-31
0001156041
us-gaap:WarrantMember
2023-01-01
2023-12-31
0001156041
us-gaap:EmployeeStockOptionMember
2024-01-01
2024-12-31
0001156041
us-gaap:EmployeeStockOptionMember
2023-01-01
2023-12-31
0001156041
HUSA:OilSalesMember
2024-01-01
2024-12-31
0001156041
HUSA:OilSalesMember
2023-01-01
2023-12-31
0001156041
HUSA:NaturalGasSalesMember
2024-01-01
2024-12-31
0001156041
HUSA:NaturalGasSalesMember
2023-01-01
2023-12-31
0001156041
HUSA:NaturalGasLiquidsSalesMember
2024-01-01
2024-12-31
0001156041
HUSA:NaturalGasLiquidsSalesMember
2023-01-01
2023-12-31
0001156041
country:US
2024-12-31
0001156041
srt:SouthAmericaMember
2024-12-31
0001156041
country:US
2023-12-31
0001156041
srt:SouthAmericaMember
2023-12-31
0001156041
HUSA:TwoThousandAndEightEquityIncentivePlanMember
srt:MaximumMember
2008-12-31
0001156041
HUSA:TwoThousandAndSeventeenEquityIncentivePlanMember
srt:MaximumMember
2017-12-31
0001156041
HUSA:TwoThousandAndTwentyOneEquityIncentivePlanMember
srt:MaximumMember
2021-12-31
0001156041
HUSA:DirectorsMember
2023-06-01
2023-06-30
0001156041
HUSA:DirectorsMember
2023-06-30
0001156041
HUSA:DirectorsMember
2024-06-01
2024-06-30
0001156041
HUSA:DirectorsMember
2024-06-30
0001156041
srt:ChiefExecutiveOfficerMember
2024-11-01
2024-11-30
0001156041
srt:ChiefExecutiveOfficerMember
2024-11-30
0001156041
srt:ChiefExecutiveOfficerMember
2024-12-31
0001156041
srt:ChiefExecutiveOfficerMember
2024-12-01
2024-12-31
0001156041
HUSA:SalesAgreementTwoThousandTwentyTwoATMOfferingMember
HUSA:WestParkCapitalLLCMember
srt:MaximumMember
2022-11-01
2022-11-30
0001156041
HUSA:SalesAgreementTwoThousandTwentyTwoATMOfferingMember
2023-01-01
2023-12-31
0001156041
HUSA:SalesAgreementTwoThousandTwentyTwoATMOfferingMember
2024-01-01
2024-12-31
0001156041
HUSA:TwoThousandTwentyOneATMOfferingMember
2024-01-01
2024-12-31
0001156041
HUSA:BridgeLoanWarrantsMember
2019-09-01
2019-09-30
0001156041
HUSA:BridgeLoanWarrantsMember
2019-09-30
0001156041
srt:MinimumMember
2024-01-01
2024-12-31
0001156041
srt:MaximumMember
2024-01-01
2024-12-31
0001156041
HUSA:OperatingLeaseAgreementMember
2024-01-01
2024-12-31
0001156041
HUSA:OperatingLeaseAgreementMember
2024-12-31
0001156041
us-gaap:GeneralAndAdministrativeExpenseMember
2024-01-01
2024-12-31
0001156041
us-gaap:GeneralAndAdministrativeExpenseMember
2023-01-01
2023-12-31
0001156041
2013-08-01
2013-08-31
0001156041
country:CO
HUSA:CurrentDirectorMember
2024-01-01
2024-12-31
0001156041
srt:NorthAmericaMember
srt:ReportableGeographicalComponentsMember
2024-01-01
2024-12-31
0001156041
srt:NorthAmericaMember
srt:ReportableGeographicalComponentsMember
2024-12-31
0001156041
srt:NorthAmericaMember
srt:ReportableGeographicalComponentsMember
2023-01-01
2023-12-31
0001156041
srt:NorthAmericaMember
srt:ReportableGeographicalComponentsMember
2023-12-31
0001156041
srt:ReportableGeographicalComponentsMember
srt:SouthAmericaMember
2024-01-01
2024-12-31
0001156041
srt:SouthAmericaMember
srt:ReportableGeographicalComponentsMember
2024-12-31
0001156041
srt:ReportableGeographicalComponentsMember
srt:SouthAmericaMember
2023-01-01
2023-12-31
0001156041
srt:SouthAmericaMember
srt:ReportableGeographicalComponentsMember
2023-12-31
0001156041
us-gaap:SubsequentEventMember
HUSA:ShareExchangeAgreementMember
2025-02-20
2025-02-20
0001156041
us-gaap:SubsequentEventMember
HUSA:ShareExchangeAgreementMember
2025-02-20
0001156041
us-gaap:SubsequentEventMember
2025-01-01
2025-01-31
0001156041
srt:ChiefExecutiveOfficerMember
us-gaap:SubsequentEventMember
2025-01-01
2025-01-31
0001156041
HUSA:BoardMember
us-gaap:SubsequentEventMember
2025-01-01
2025-01-31
0001156041
srt:ChiefExecutiveOfficerMember
us-gaap:SubsequentEventMember
2025-02-01
2025-02-28
0001156041
srt:NorthAmericaMember
2024-01-01
2024-12-31
0001156041
srt:NorthAmericaMember
2023-01-01
2023-12-31
0001156041
srt:SouthAmericaMember
2024-01-01
2024-12-31
0001156041
srt:SouthAmericaMember
2023-01-01
2023-12-31
0001156041
country:US
srt:NaturalGasReservesMember
2022-12-31
0001156041
country:US
srt:OilReservesMember
2022-12-31
0001156041
country:US
srt:NaturalGasLiquidsReservesMember
2022-12-31
0001156041
country:US
srt:NaturalGasReservesMember
2023-01-01
2023-12-31
0001156041
country:US
srt:OilReservesMember
2023-01-01
2023-12-31
0001156041
country:US
srt:NaturalGasLiquidsReservesMember
2023-01-01
2023-12-31
0001156041
country:US
srt:NaturalGasReservesMember
2023-12-31
0001156041
country:US
srt:OilReservesMember
2023-12-31
0001156041
country:US
srt:NaturalGasLiquidsReservesMember
2023-12-31
0001156041
country:US
srt:NaturalGasReservesMember
2024-01-01
2024-12-31
0001156041
country:US
srt:OilReservesMember
2024-01-01
2024-12-31
0001156041
country:US
srt:NaturalGasLiquidsReservesMember
2024-01-01
2024-12-31
0001156041
country:US
srt:NaturalGasReservesMember
2024-12-31
0001156041
country:US
srt:OilReservesMember
2024-12-31
0001156041
country:US
srt:NaturalGasLiquidsReservesMember
2024-12-31
0001156041
country:US
2024-01-01
2024-12-31
0001156041
srt:SouthAmericaMember
2022-12-31
0001156041
country:US
2023-01-01
2023-12-31
0001156041
country:US
2022-12-31
iso4217:USD
xbrli:shares
iso4217:USD
xbrli:shares
xbrli:pure
utr:bbl
utr:Mcf
utr:gal
UNITED
STATES
SECURITIES
AND EXCHANGE COMMISSION
Washington,
D.C. 20549
FORM
10-K
(Mark
One)
☒
ANNUAL REPORT UNDER SECTION 13 OR 15(d) OF THE SECURITIES EXCHANGE ACT OF 1934
For
the Fiscal Year Ended December 31, 2024
☐
TRANSITION REPORT UNDER SECTION 13 OR 15(d) OF THE SECURITIES EXCHANGE ACT OF 1934
For
the transition period from to
Commission
File No. 1-32955
HOUSTON
AMERICAN ENERGY CORP.
(Exact
name of registrant specified in its charter)
| Delaware |
|
76-0675953 |
(State
or other jurisdiction of
incorporation
or organization) |
|
(I.R.S.
Employer
Identification
No.) |
801
Travis Street, Suite 1425, Houston, Texas 77002
(Address
of principal executive offices)(Zip code)
Issuer’s
telephone number, including area code: (713) 222-6966
Securities
registered pursuant to Section 12(b) of the Act:
Title
of each class
|
|
Trading
Symbol |
|
Name
of each exchange on which registered
|
| Common
Stock, $0.001 par value |
|
HUSA |
|
NYSE
American |
Securities
registered pursuant to Section 12(g) of the Act:
None
(Title
of Class)
Indicate
by check mark if the registrant is a well-known seasoned issuer, as defined in Rule 405 of the Securities Act. Yes ☐ No
☒
Indicate
by check mark if the registrant is not required to file reports pursuant to Section 13 or 15(d) of the Exchange Act. Yes ☐ No
☒
Indicate
by check mark whether the registrant: (1) has filed all reports required to be filed by Section 13 or 15(d) of the Securities Exchange
Act of 1934 during the preceding 12 months (or for such shorter period that the registrant was required to file such reports); and (2)
has been subject to such filing requirements for the past 90 days. Yes ☒ No ☐
Indicate
by check mark whether the registrant has submitted electronically every Interactive Data File required to be submitted pursuant to Rule
405 of Regulation S-T (§232.405 of this chapter) during the preceding 12 months (or for such shorter period that the registrant
was required to submit such files). Yes ☒ No ☐
Indicate
by check mark whether the registrant is a large accelerated filer, an accelerated filer, a non-accelerated filer, a smaller reporting
company or an emerging growth company. See definition of “accelerated filer,” “large accelerated filer,” “smaller
reporting company” and “emerging growth company” in Rule 12b-2 of the Exchange Act.
| Large
accelerated filer |
☐ |
Accelerated
filer |
☐ |
Non-accelerated
filer |
☒ |
| Smaller
reporting company |
☒ |
Emerging
growth company |
☐ |
|
|
If
an emerging growth company, indicate by check mark if the registrant has elected not to use the extended transition period for complying
with any new or revised financial accounting standards provided pursuant to Section 13(a) of the Exchange Act. ☐
Indicate
by check mark whether the registrant has filed a report on and attestation to its management’s assessment of the effectiveness
of its internal control over financial reporting under Section 404(b) of the Sarbanes-Oxley Act (15 U.S.C. 7262(b)) by the registered
public accounting firm that prepared or issued its audit report. ☐
If
securities are registered pursuant to Section 12(b) of the Act, indicate by check mark whether the financial statements of the registrant
included in the filing reflect the correction of an error to previously issued financial statements ☐
Indicate
by check mark whether any of those error corrections are restatements that required a recovery analysis of incentive-based compensation
received by any of the registrant’s executive officers during the relevant recovery period pursuant to o § 240.10D-1(b). ☐
Indicate
by check mark whether the registrant is a shell company (as defined in Rule 12b-2 of the Exchange Act). Yes ☐ No ☒
The
aggregate market value of the voting and non-voting common equity held by non-affiliates of the registrant on December 31, 2024, based on
the closing sales price of the registrant’s common stock on that date, was $17,666,820. Shares of common stock held by each current
executive officer and director and by each person known by the registrant to own 10% or more of the outstanding common stock have been
excluded from this computation in that such persons may be deemed to be affiliates.
The
number of shares of the registrant’s common stock, $0.001 par value, outstanding as of February 21, 2025 was 15,686,533.
DOCUMENTS
INCORPORATED BY REFERENCE
Portions
of the Company’s Proxy Statement for its 2025 Annual Meeting are incorporated by reference into Part III of this Report.
TABLE
OF CONTENTS
FORWARD-LOOKING
STATEMENTS
This
annual report on Form 10-K contains forward-looking statements within the meaning of the federal securities laws. These forwarding-looking
statements include without limitation statements regarding our expectations and beliefs about the market and industry, our goals, plans,
and expectations regarding our properties and drilling activities and results, our intentions and strategies regarding future acquisitions
and sales of properties, our intentions and strategies regarding the formation of strategic relationships, our beliefs regarding the
future success of our properties, our expectations and beliefs regarding competition, competitors, the basis of competition and our ability
to compete, our beliefs and expectations regarding our ability to hire and retain personnel, our beliefs regarding period to period results
of operations, our expectations regarding revenues, our expectations regarding future growth and financial performance, our beliefs and
expectations regarding the adequacy of our facilities, and our beliefs and expectations regarding our financial position, ability to
finance operations and growth and the amount of financing necessary to support operations. These statements are subject to risks and
uncertainties that could cause actual results and events to differ materially. See “Item 1A. Risk Factors” for a discussion
of certain risk factors. We undertake no obligation to update forward-looking statements to reflect events or circumstances occurring
after the date of this annual report on Form 10-K.
As
used in this annual report on Form 10-K, unless the context otherwise requires, the terms “we,” “us,” “the
Company,” and “Houston American” refer to Houston American Energy Corp., a Delaware corporation.
PART
I
General
Houston
American Energy Corp is an independent oil and gas company focused on the development, exploration, exploitation, acquisition, and production
of natural gas and crude oil properties. Our principal properties, and operations, are in the U.S. Permian Basin and the South American
country of Colombia. Additionally, we have properties in the Louisiana U.S. Gulf Coast region.
We
focus on early identification of, and opportunistic entrance into, existing and emerging resource plays. We do not operate properties
but typically seek to partner with, or invest along-side, larger operators in the development of resources or retain interests, with
or without contribution on our part, in prospects identified, packaged and promoted to larger operators. By entering these plays earlier,
identifying stranded blocks and partnering with, investing along-side or promoting to, larger operators, we believe we can capture larger
resource potential at lower cost and minimize our exposure to drilling risks and costs and ongoing operating costs.
We,
along with our partners, actively manage our resources through opportunistic acquisitions and divestitures where reserves can be identified,
developed, monetized and financial resources redeployed with the objective of growing reserves, production and shareholder value.
Properties
Our
exploration and development projects are focused on existing property interests in the Texas Permian Basin, the South American country
of Colombia and the onshore Louisiana Gulf Coast region.
Each
of our property interests differ in scope and character and consists of one or more types of assets, such as 3-D seismic data, owned
mineral interests, leasehold positions, lease options, working interests in leases, partnership or limited liability company interests,
corporate equity interests or other mineral rights. Our percentage interest in each property represents the portion of the interest in
the property we share with other partners in the property. Because each property consists of a bundle of assets that may or may not include
a working interest in the project, our stated interest in a property simply represents our proportional ownership in the bundle of assets
that constitute the property. Therefore, our interest in a property should not be confused with the working interest that we will own
when a given well is drilled. Each of our exploration and development projects represents a negotiated transaction between the project
partners relating to one or more properties. Our working interest may be higher or lower than our stated interest.
The
following table sets forth information relating to our principal properties as of December 31, 2024:
| | |
| |
| |
| |
| |
2024 Net Production |
| | |
Net
acreage | |
Average
working
interest % | |
Gross
producing
wells | |
Net proved
reserves
(boe)(1) | |
Oil
(bbls)(1) | |
Natural Gas
(mcf)(1) | |
Natural
Gas Liquids (gallons) |
| Texas | |
| 98 | | |
| 6.8 | % | |
| 4 | | |
| 159,875 | | |
| 5,992 | | |
| 53,476 | | |
| 159,680 | |
| Louisiana | |
| 582 | | |
| 23.4 | % | |
| — | | |
| — | | |
| — | | |
| — | | |
| — | |
| Total U.S. | |
| 680 | | |
| 15.1 | % | |
| 4 | | |
| 159,875 | | |
| 5,992 | | |
| 53,476 | | |
| 159,680 | |
| Colombia(2) | |
| 572 | | |
| 16 | % | |
| 4 | | |
| — | | |
| — | | |
| — | | |
| — | |
| Total | |
| 1,252 | | |
| 16 | % | |
| 8 | | |
| 159,875 | | |
| 5,992 | | |
| 53,476 | | |
| 159,680 | |
| |
(1) |
All reserve and production information excludes wells operated
by Hupecol Meta in Colombia. |
| |
|
|
| |
(2) |
Net acreage and average working interest in Colombia are held
through our investment in Hupecol Meta, and are subject to pending approvals of (i) the proposed relinquishment of a portion of the acreage
within the Venus Exploration Area of the CPO-11 block; and (ii) the acquisition of the remaining 50% interest in the balance of the CPO-11
block previously farmed out to Parex Resources. See “Colombian Properties – CPO-11” below. |
-
United States Properties:
In
the United States, our principal properties and operations are located in the on-shore Permian Basin and Gulf Coast region of Louisiana.
Texas
Properties – Permian Basin
Reeves
County. We hold a 18.1% average working interest in 320 gross acres in Reeves County, Texas, consisting of (1) the 160 gross acre
Johnson Lease, in which we hold a 25% working interest, subject to a proportionate 5% back-in after payout, and (2) the 160 gross acre
O’Brien Lease, in which we hold an average 11.2% working interest. Our Reeves County acreage lies within the Delaware sub-basin
of the Permian Basin, with resource potential in the Wolfcamp, Bone Spring and Avalon formations. During 2017, we drilled and completed
our initial wells on both lease blocks, the Johnson State #1H well and the O’Brien #3H well, both horizontally drilled and hydraulically
fractured wells in the Wolfcamp A formation. The Johnson #1H well and O’Brien #3H well were both placed on gas lift during 2021
and were producing at December 31, 2024. For the year ended December 31, 2024, our production in Reeves County totaled 3,468 barrels
of oil and 53,476 mcf of natural gas.
In
June 2024, we participated in the drilling of six wells in the State Finkle Unit on the O’Brien Lease. All six wells are expected
to commence production in March, 2025
As
of December 31, 2024, no additional development or drilling operations are planned with respect to our Reeves County acreage.
Yoakum
County. We hold a 15.9% average working interest, subject to a proportionate 10% back-in after payout, in an approximately 360 gross
acre block in Yoakum County, Texas. Our Yoakum County acreage lies within the Midland sub-basin of the Permian Basin.
During
2019, we drilled the Frost #1H well, the first well on our Yoakum County acreage. The well was horizontally drilled, hydraulically fractured
in the San Andres Formation and completed and commenced production in mid-2019. A second well on our Yoakum County acreage, the Frost
#2H well, was horizontally drilled, hydraulically fractured in the San Andres Formation and completed and commenced production during
the third quarter of 2020. For the year ended December 31, 2024, our production in Yoakum County totaled 2,524 barrels of oil.
As
of December 31, 2024, no additional development or drilling operations are planned with respect to our Yoakum County acreage.
Louisiana
Properties
Our
sole property in Louisiana consists of a 23.4% mineral interest in 2,485 gross acres in East Baton Rouge Parish.
There
are no present wells, or plans to conduct drilling operations, on our Louisiana acreage.
-
Colombian Properties:
At
December 31, 2024, we held interests in a single block, through our equity investment in Hupecol Meta, LLC, operated by Hupecol Operating
and affiliates, in Colombia covering 639,405 gross acres. We identify our Colombian prospect as the Venus Exploration Area within the
CPO-11 block and remainder of the CPO-11 block.
The
following table sets forth information relating to our interests in prospects in Colombia at December 31, 2024:
Property
| |
Operator
| | |
Ownership
Interest
| | |
Total
Gross Acres
| | |
Total
Gross Developed Acres
| | |
Gross
Productive Wells
| |
| CPO-11 – Venus Exploration Area | |
Hupecol | | |
| 16.0 | % | |
| 3,573 | | |
| 1,332 | | |
| 4 | |
| | |
| | |
| | | |
| | | |
| | | |
| | |
| Total | |
| | |
| | | |
| 3,573 | | |
| 1,332 | | |
| 4 | |
The
CPO-11 concession, including the Venus Exploration Area, is located in the Llanos Basin and is owned and operated by Hupecol Meta.
CPO-11
During
2019, we acquired a two percent ownership interest in Hupecol Meta, LLC (“Hupecol Meta”). Hupecol Meta owns the 639,405 gross
acre CPO-11 block in the Llanos Basin in Colombia. The CPO-11 block is comprised of the 69,128 acre Venus Exploration area and 570,277
acres which was 50% farmed out by Hupecol to Parex Resources. In 2021, Hupecol Meta increased its ownership interest in the CPO-11 block
and we agreed to contribute $99,716. In 2022, we acquired additional interests in Hupecol Meta for an aggregate of $657,638. As a result
of our acquisition of additional interests in 2021 and 2022, our ownership interest in Hupecol Meta was approximately 18% at December
31, 2024. Through our ownership interest in Hupecol Meta, at December 31, 2024, we hold an approximately 16% interest in the Venus Exploration
Area and an approximately 8% interest in the remainder of the CPO-11 block.
The
CPO-11 block covers almost 1,000 square miles. During 2023, in the Venus Exploration Area, Hupecol Meta drilled and completed the Venus
1-H horizontal well and the Venus 2-H ST1 well. At December 31, 2024, the Saturno ST1 and Venus 2A wells, both vertical wells, and the
Venus 1-H and Venus 2-H ST1 wells, both horizontal wells, were on production in the Venus Exploration Area of the CPO-11 block.
Hupecol
Meta has (i) proposed to relinquish approximately 62,139 gross acres within the Venus Exploration Area, decreasing its holding within
that area to approximately 7,157 gross, and 1,145 net, acres; and (ii) agreed to acquire the 50% interest in the CPO-11 block farmed
out to Parex Resources, which would increase Hupecol Meta’s net acreage position in the block to 91,244 acres. The relinquishment
of such acreage and acquisition of the Parex interest are both subject to approval of the Colombian hydrocarbons agency, or ANH.
Our
equity investment in Hupecol Meta is accounted for at cost and, accordingly, this report does not include any reserves, production and
operating results of Hupecol Meta.
In
late 2023, Hupecol advised that it intends to evaluate potential monetization of its assets in Colombia, including the interest in the
CPO-11 block held by Hupecol Meta. Pending the outcome of Hupecol’s evaluation of, and potential efforts regarding, monetization
of the CPO-11 block, we have no planned drilling operations, or other planned operations, in Colombia. There is no assurance as to the
timing or outcome of Hupecol’s potential monetization of assets.
As
of December 31, 2024, the Company determined it was necessary to take an impairment charge for our investment in Hupecol Meta due to indications
that its earnings performance has deteriorated, and the investment is no longer viewed as viable. We determined that we are unlikely to
receive any substantial amount of proceeds upon the sale of Hupecol Meta, rendering the value of the investment fully impaired.
Drilling
Activity
The
following table summarizes the number of wells drilled through Hupecol Meta, during 2024, 2023 and 2022, excluding any wells drilled
under farmout agreements, royalty interest ownership, or any other wells in which we do not have a working interest (direct or indirect).
| | |
Year Ended December 31, | |
| | |
2024 | | |
2023 | | |
2022 | |
| | |
Gross
| | |
Net
| | |
Gross
| | |
Net
| | |
Gross
| | |
Net
| |
| Development wells, completed as: | |
| | | |
| | | |
| | | |
| | | |
| | | |
| | |
| Productive | |
| — | | |
| — | | |
| 2 | | |
| 0.32 | | |
| — | | |
| — | |
| Non-productive | |
| — | | |
| — | | |
| — | | |
| — | | |
| — | | |
| — | |
| Total development wells | |
| — | | |
| — | | |
| 2 | | |
| 0.32 | | |
| — | | |
| — | |
| | |
| | | |
| | | |
| | | |
| | | |
| | | |
| | |
| Exploratory wells, completed as: | |
| | | |
| | | |
| | | |
| | | |
| | | |
| | |
| Productive | |
| — | | |
| — | | |
| — | | |
| — | | |
| 1 | | |
| 0.16 | |
| Non-productive | |
| 1 | | |
| 0.16 | | |
| — | | |
| — | | |
| 1 | | |
| 0.16 | |
| Total exploratory wells | |
| — | | |
| — | | |
| | | |
| | | |
| 2 | | |
| 0.32 | |
Productive
wells are wells that are found to be capable of producing hydrocarbons in sufficient quantities such that proceeds from the sale of the
production exceed production expenses and taxes. During 2024, the operator of the O’Brien Lease, EOG, decided to drill six new
wells on the Finkle State Unit. We decided to participate in the drilling of those wells. We anticipate production from those wells to
begin in March, 2025. .
Hupecol
Meta drilled a well in 2024 which turned out to be non-productive. Through our investment in Hupecol Meta, we own approximately 16%
of the block on which the well was drilled.
Productive
Wells
Productive
wells consist of producing wells and wells capable of production, including shut-in wells. A well bore with multiple completions is counted
as only one well. As of December 31, 2024, we owned interests in 14 gross wells (including indirect interests in wells in Colombia through
our equity interest in Hupecol Meta). As of December 31, 2024, we had interests in productive wells, categorized by geographic area,
as follows:
| | |
Oil Wells | | |
Gas Wells | |
| United States | |
| | | |
| | |
| Gross | |
| 10 | | |
| — | |
| Net | |
| 0.7022 | | |
| — | |
| Colombia | |
| | | |
| | |
| Gross | |
| 4 | | |
| — | |
| Net | |
| 0.64 | | |
| — | |
| Total | |
| | | |
| | |
| Gross | |
| 14 | | |
| — | |
| Net | |
| 1.3422 | | |
| — | |
Volume,
Prices and Production Costs
The
following table sets forth certain information regarding the production volumes, average prices received and average production costs
associated with our sales of gas and oil, categorized by geographic area (excluding our production, prices and costs attributable to
wells operated by Hupecol Meta), for each of the three years ended December 31, 2024, 2023, and 2022:
| | |
Year Ended December 31, | |
| | |
2024 | | |
2023 | | |
2022 | |
| Net Production: | |
| | | |
| | | |
| | |
| Gas (Mcf): | |
| | | |
| | | |
| | |
| United States | |
| 53,476 | | |
| 57,360 | | |
| 73,635 | |
| Colombia | |
| — | | |
| — | | |
| — | |
| Total | |
| 53,476 | | |
| 57,360 | | |
| 73,635 | |
| | |
| | | |
| | | |
| | |
| Natural Gas Liquids (Gallons) | |
| | | |
| | | |
| | |
| United States | |
| 159,680 | | |
| 179,506 | | |
| 248,506 | |
| Colombia | |
| — | | |
| — | | |
| — | |
| Total | |
| 159,680 | | |
| 179,506 | | |
| 248,506 | |
| | |
| | | |
| | | |
| | |
| Oil (Bbls): | |
| | | |
| | | |
| | |
| United States | |
| 5,992 | | |
| 7,971 | | |
| 10,688 | |
| Colombia | |
| — | | |
| — | | |
| — | |
| Total | |
| 5,992 | | |
| 7,971 | | |
| 10,688 | |
| | |
| | | |
| | | |
| | |
| Average sales price: | |
| | | |
| | | |
| | |
| Gas ($ per Mcf) | |
| | | |
| | | |
| | |
| United States | |
$ | 0.17 | | |
$ | 1.38 | | |
$ | 5.13 | |
| Colombia | |
| — | | |
| — | | |
| — | |
| Total | |
$ | 0.17 | | |
$ | 1.38 | | |
$ | 5.13 | |
| | |
| | | |
| | | |
| | |
| Natural Gas Liquids ($ per Gallon) | |
| | | |
| | | |
| | |
| United States | |
$ | 0.71 | | |
$ | 0.69 | | |
$ | 1.07 | |
| Colombia | |
| — | | |
| — | | |
| — | |
| Total | |
$ | 0.71 | | |
$ | 0.69 | | |
$ | 1.07 | |
| | |
| | | |
| | | |
| | |
| Oil ($ per Bbl) | |
| | | |
| | | |
| | |
| United States | |
| 73.08 | | |
$ | 74.08 | | |
$ | 93.10 | |
| Colombia | |
| — | | |
| — | | |
| — | |
| | |
| | | |
| | | |
| | |
| Total | |
| 73.08 | | |
$ | 74.08 | | |
$ | 93.10 | |
| | |
| | | |
| | | |
| | |
| Average production costs ($ per BOE): | |
| | | |
| | | |
| | |
| United States | |
| 42.85 | | |
$ | 27.03 | | |
$ | 27.48 | |
| Colombia | |
| — | | |
| — | | |
| — | |
| | |
| | | |
| | | |
| | |
| Total | |
| 42.85 | | |
$ | 27.03 | | |
$ | 27.48 | |
Average production costs per BOE in 2024 increased to $42.85 per BOE from
$27.03 in 2023 due to inflation-related increases in expenses and workover costs incurred in early 2024 related to two of our US wells.
Natural
Gas and Oil Reserves
Reserve
Estimates
The
following tables set forth, by country and as of December 31, 2024, our estimated net proved oil and natural gas reserves, and the estimated
present value (discounted at an annual rate of 10%) of estimated future net revenues before future income taxes (“PV-10”)
and after future income taxes (“Standardized Measure”) of our proved reserves, each prepared in accordance with assumptions
prescribed by the Securities and Exchange Commission (“SEC”). The below table excludes reserve and other information pertaining
to assets operated by Hupecol Meta.
The
PV-10 value is a widely used measure of value of oil and natural gas assets and represents a pre-tax present value of estimated cash
flows discounted at ten percent. PV-10 is considered a non-GAAP financial measure as defined by the SEC. We believe that our PV-10 presentation
is relevant and useful to our investors because it presents the discounted future net cash flows attributable to our proved reserves
before taking into account the related future income taxes, as such taxes may differ among various companies because of differences in
the amounts and timing of deductible basis, net operating loss carry forwards and other factors. We believe investors and creditors use
our PV-10 as a basis for comparison of the relative size and value of our proved reserves to the reserve estimates of other companies.
PV-10 is not a measure of financial or operating performance under GAAP and is not intended to represent the current market value of
our estimated oil and natural gas reserves. PV-10 should not be considered in isolation or as a substitute for the standardized measure
of discounted future net cash flows as defined under GAAP.
These
calculations were prepared using standard geological and engineering methods generally accepted by the petroleum industry and in accordance
with SEC financial accounting and reporting standards.
| | |
| | |
Reserves (1) | |
| | |
Oil | | |
Natural Gas | | |
Natural Gas Liquids | | |
Total (2) | |
| | |
(bbls) | | |
(mcf) | | |
(gal) | | |
(boe) | |
| Reserve category | |
| | | |
| | | |
| | | |
| | |
| Proved Developed Producing | |
| | | |
| | | |
| | | |
| | |
| United States | |
| 29,380 | | |
| 339,210 | | |
| 959,650 | | |
| 108,764 | |
| Colombia(3) | |
| — | | |
| — | | |
| — | | |
| — | |
| Total Proved Developed Producing Reserves | |
| 29,380 | | |
| 339,210 | | |
| 959,650 | | |
| 108,764 | |
| Proved Non-Producing | |
| | | |
| | | |
| | | |
| | |
| United States | |
| 17,010 | | |
| 78,980 | | |
| 502,600 | | |
| 42,140 | |
| Colombia(3) | |
| — | | |
| — | | |
| — | | |
| — | |
| Total Proved Non-Producing Reserves | |
| 17,010 | | |
| 78,980 | | |
| 502,600 | | |
| 42,140 | |
| Total Proved Reserves | |
| 46,390 | | |
| 418,190 | | |
| 1,462,250 | | |
| 150,904 | |
| | |
Proved Developed | | |
Proved Non-Producing | | |
Total Proved | |
| PV-10 (1) | |
$ | 537,870 | | |
$ | 585,400 | | |
$ | 1,123,270 | |
| Standardized measure (4) | |
$ | 537,870 | | |
$ | 585,400 | | |
$ | 1,123,270 | |
| |
(1) |
In accordance with
applicable financial accounting and reporting standards of the SEC, the estimates of our proved reserves and the PV-10 set forth
herein reflect estimated future gross revenue to be generated from the production of proved reserves, net of estimated production
and future development costs, using prices and costs under existing economic conditions at December 31, 2024. For purposes of
determining prices, we used the unweighted arithmetical average of the prices on the first day of each month within the 12-month
period ended December 31, 2024. The average prices utilized for purposes of estimating our proved reserves were $71.96 per barrel of
oil, $0.52 per MMBTu of natural gas, and $0.71 per gallon of natural gas liquids for our US properties, adjusted by property for
energy content, quality, transportation fees and regional price differentials. The prices should not be interpreted as a prediction
of future prices. The amounts shown do not give effect to non-property related expenses, such as corporate general administrative
expenses and debt service, future income taxes or to depreciation, depletion and amortization. |
| |
|
|
| |
(2) |
Natural gas is converted on the basis of six Mcf of gas per
one barrel of oil equivalent. |
| |
|
|
| |
(3) |
As an equity investment accounted for at cost, we do not report
any reserves attributable to our investment in Hupecol Meta. |
| |
|
|
| |
(4) |
The Standard Measure differs from PV-10 only in that the Standard
Measure reflects estimated future income taxes. |
Due
to the inherent uncertainties and the limited nature of reservoir data, proved reserves are subject to change as additional information
becomes available. The estimates of reserves, future cash flows and present value are based on various assumptions, including those prescribed
by the SEC, and are inherently imprecise. Although we believe these estimates are reasonable, actual future production, cash flows, taxes,
development expenditures, operating expenses and quantities of recoverable oil and natural gas reserves may vary substantially from these
estimates.
Reserve
Estimation Process, Controls and Technologies
The
reserve estimates, including PV-10 and Standard Measure estimates, set forth above were prepared by Russell K. Hall & Associates,
Inc. for our Permian Basin, Texas reserves.
The reserves as of December 31, 2024 were determined in accordance with
standard industry practices and SEC regulations by the licensed independent petroleum engineering firm. The calculations were prepared
using standard geological and engineering methods generally accepted by the petroleum industry.
Our
year-end reserve reports are prepared by reserve engineering firms based upon a review of property interests being appraised, production
from such properties, current costs of operation and development, current prices for production, agreements relating to current and future
operations and sale of production, geosciences and engineering data, and other information provided to them by our management team. Upon
analysis and evaluation of data provided, the reserve engineering firms issue a preliminary appraisal report of our reserves. The preliminary
appraisal report and changes in our reserves are reviewed by our President and board for reasonableness of the results obtained. Once
any questions have been addressed, the reserve engineering firms issue final appraisal reports, reflecting their conclusions.
Russell
K. Hall & Associates is an independent Midland, Texas based professional engineering firm providing reserve evaluation services to
the oil and gas industry. Their report was prepared under the direction of Russell K. Hall, founder and President of Russell K. Hall
& Associates. Mr. Hall holds a BS in Mechanical Engineering from the University of Oklahoma, is a registered professional engineer
and a member of the Society of Petroleum Engineers, the Society of Independent Professional Earth Scientists and the West Texas Geological
Society. Mr. Hall has more than 30 years of experience in reserve evaluation for the oil and gas industry and the oil and gas finance
industry. Russell K. Hall & Associates, and its employees, have no interest in our company or our properties and were objective in
determining our reserves.
The
SEC’s rules with respect to technologies that a company can use to establish reserves allows use of techniques that have been proved
effective by actual production from projects in the same reservoir or an analogous reservoir or by other evidence using reliable technology
that establishes reasonable certainty. Reliable technology is a grouping of one or more technologies (including computational methods)
that have been field tested and have been demonstrated to provide reasonably certain results with consistency and repeatability in the
formation being evaluated or in an analogous formation.
Our
reserve engineering firm used a combination of production and pressure performance, simulation studies, offset analogies, seismic data
and interpretation, geophysical logs and core data to calculate our reserves estimates.
Proved
Undeveloped Reserves
We
had no proved undeveloped reserves at either December 31, 2023 or December 31, 2024.
Developed
and Non-Producing Acreage
The
following table sets forth the gross and net developed and non-producing acreage (including both leases and concessions, but
excluding acreage in which we hold a royalty interest but no working interest), categorized by geographical area, which we held as of
December 31, 2024:
| | |
Developed | | |
Non-Producing | |
| | |
Gross
| | |
Net
| | |
Gross
| | |
Net
| |
| United States | |
| 3,040 | | |
| 98 | | |
| 2,485 | | |
| 582 | |
| Colombia | |
| 1,332 | | |
| 213 | | |
| 2,241 | | |
| 359 | |
| Total | |
| 4,372 | | |
| 311 | | |
| 4,726 | | |
| 941 | |
Developed
acreage is comprised of leased acres that are within an area spaced by or assignable to a productive well and acreage in which we hold
a direct or indirect mineral interest with no potential development related lease expirations. Non-producing acreage is comprised
of leased acres that are within an areas assigned to a well which is not yet producing, in which we hold a direct or indirect mineral
interest.
As
is customary in the oil and natural gas industry, we can generally retain our interest in undeveloped acreage by drilling activity that
establishes commercial production sufficient to maintain the leases or by paying delay rentals during the remaining primary term of leases.
The oil and natural gas leases in which we have an interest are for varying primary terms and, if production under a lease continues
from our developed lease acreage beyond the primary term, we are entitled to hold the lease for as long as oil or natural gas is produced.
Title
to Properties
Title
to properties is subject to royalty, overriding royalty, carried working, net profits, working and other similar interests and contractual
arrangements customary in the gas and oil industry, liens for current taxes not yet due and other encumbrances. As is customary in the
industry in the case of undeveloped properties, little investigation of record title is made at the time of acquisition (other than preliminary
review of local records).
Investigation,
including a title opinion of local counsel, generally is made before commencement of drilling operations.
Marketing
At
December 31, 2024, we had no contractual agreements to sell our gas and oil production and all production was sold on spot markets.
Human
Capital
As
of December 31, 2024, we had 2 full-time employees and no part-time employees. The employees are not covered by a collective bargaining
agreement, and we do not anticipate that any of our future employees will be covered by such agreements.
Competition
We
encounter intense competition from other oil and gas companies in all areas of our operations, including the acquisition of producing
properties and undeveloped acreage. Our competitors include major integrated oil and gas companies, numerous independent oil and gas
companies and individuals. Many of our competitors are large, well-established companies with substantially larger operating staffs and
greater capital resources and have been engaged in the oil and gas business for a much longer time than our Company. These companies
may be able to pay more for productive oil and gas properties, exploratory prospects and to define, evaluate, bid for and purchase a
greater number of properties and prospects than our financial or human resources permit. Our ability to acquire additional properties
and to discover reserves in the future will be dependent upon our ability to evaluate and select suitable properties and to consummate
transactions in this highly competitive environment.
Regulatory
Matters
Regulation
of Oil and Gas Production, Sales and Transportation
The
oil and gas industry is subject to regulation by numerous national, state and local governmental agencies and departments. Compliance
with these regulations is often difficult and costly and noncompliance could result in substantial penalties and risks. Most jurisdictions
in which we operate also have statutes, rules, regulations or guidelines governing the conservation of natural resources, including the
unitization or pooling of oil and gas properties, minimum well spacing, plugging and abandonment of wells and the establishment of maximum
rates of production from oil and gas wells. Some jurisdictions also require the filing of drilling and operating permits, bonds and reports.
The failure to comply with these statutes, rules and regulations could result in the imposition of fines and penalties and the suspension
or cessation of operations in affected areas.
Environmental
Regulation
Various
federal, state and local laws and regulations relating to the protection of the environment, including the discharge of materials into
the environment, may affect our exploration, development and production operations and the costs of those operations. These laws and
regulations, among other things, govern the amounts and types of substances that may be released into the environment, the issuance of
permits to conduct exploration, drilling and production operations, the discharge and disposition of generated waste materials and waste
management, the reclamation and abandonment of wells, sites and facilities, financial assurance and the remediation of contaminated sites.
These laws and regulations may impose substantial liabilities for noncompliance and for any contamination resulting from our operations
and may require the suspension or cessation of operations in affected areas.
The
environmental laws and regulations applicable to our U.S. operations include, among others, the following United States federal laws
and regulations:
| |
● |
Clean Air Act, and its amendments, which govern air emissions; |
| |
|
|
| |
● |
Clean Water Act, which governs discharges into waters of the
United States; |
| |
|
|
| |
● |
Comprehensive Environmental Response, Compensation and Liability
Act, which imposes liability where hazardous releases have occurred or are threatened to occur (commonly known as “Superfund”); |
| |
|
|
| |
● |
Resource Conservation and Recovery Act, which governs the management
of solid waste; |
| |
|
|
| |
● |
Oil Pollution Act of 1990, which imposes liabilities resulting
from discharges of oil into navigable waters of the United States; |
| |
|
|
| |
● |
Emergency Planning and Community Right-to-Know Act, which requires
reporting of toxic chemical inventories; |
| |
|
|
| |
● |
Safe Drinking Water Act, which governs the underground injection
and disposal of wastewater; and |
| |
|
|
| |
● |
U.S. Department of Interior regulations, which impose liability
for pollution cleanup and damages. |
Colombia
has similar laws and regulations designed to protect the environment.
We
routinely obtain permits for our facilities and operations in accordance with these applicable laws and regulations on an ongoing basis.
There are no known issues that have a significant adverse effect on the permitting process or permit compliance status of any of our
facilities or operations.
The
ultimate financial impact of these environmental laws and regulations is neither clearly known nor easily determined as new standards
are enacted and new interpretations of existing standards are rendered. Environmental laws and regulations are expected to have an increasing
impact on our operations. In addition, any non-compliance with such laws could subject us to material administrative, civil or criminal
penalties, or other liabilities. Potential permitting costs are variable and directly associated with the type of facility and its geographic
location. Costs, for example, may be incurred for air emission permits, spill contingency requirements, and discharge or injection permits.
These costs are considered a normal, recurring cost of our ongoing operations and not an extraordinary cost of compliance with government
regulations.
Although
we do not operate the properties in which we hold interests, noncompliance with applicable environmental laws and regulations by the
operators of our oil and gas properties could expose us, and our properties, to potential costs and liabilities associated with such
environmental laws. While we exercise no oversight with respect to any of our operators, we believe that each of our operators is committed
to environmental protection and compliance. However, since environmental costs and liabilities are inherent in our operations and in
the operations of companies engaged in similar businesses and since regulatory requirements frequently change and may become more stringent,
there can be no assurance that material costs and liabilities will not be incurred in the future. Such costs may result in increased
costs of operations and acquisitions and decreased production.
Hydraulic
Fracturing Regulation
Hydraulic
fracturing, or “fracking”, is a common practice used to stimulate production of oil and natural gas from tight formations,
including shales. Fracking involves the injection of fluids—usually consisting mostly of water but typically including small amounts
of chemical additives—as well as sand into a well under high pressure in order to create fractures in the rock that allow oil or
gas to flow more freely to the wellbore.
Except
as applies to federal lands, fracking generally is exempt from regulation under many federal environmental rules and is generally regulated
at the state level.
For
example, in Texas, the Texas Railroad Commission administers regulations related to oil and gas operations, including regulations pertaining
to protection of water resources in connection with those operations. The Texas Legislature adopted new legislation requiring oil and
gas operators to publicly disclose the chemicals used in the hydraulic fracturing process, effective as of September 1, 2011. The Texas
Railroad Commission has adopted rules and regulations implementing this legislation that apply to all wells for which the Railroad Commission
issues an initial drilling permit after February 1, 2012. This law requires that the well operator disclose the list of chemical ingredients
subject to the requirements of the federal Occupational Safety and Health Act (“OSHA”) for disclosure on an internet website
and also file the list of chemicals with the Texas Railroad Commission with the well completion report. The total volume of water used
to hydraulically fracture a well must also be disclosed to the public and filed with the Texas Railroad Commission.
There
is public controversy regarding fracking with regard to the use of fracking fluids, impacts on drinking water supplies, use of water
and the potential for impacts to surface water, groundwater and the environment generally. Lawsuits and enforcement actions have been
initiated across the country implicating hydraulic fracturing practices. If new laws or regulations restricting hydraulic fracturing
are adopted, such laws could make it more difficult or costly to perform fracturing to stimulate production from tight formations as
well as make it easier to initiate legal proceedings based on allegations that specific chemicals used in the fracturing process could
adversely affect groundwater. In addition, if hydraulic fracturing is further regulated at the federal or state level, fracturing activities
could become subject to additional permitting and financial assurance requirements, more stringent construction specifications, increased
monitoring, reporting and recordkeeping obligations, plugging and abandonment requirements and also to attendant permitting delays and
potential increases in costs. Such legislative changes could cause operators to incur substantial compliance costs, and compliance or
the consequences of any failure to comply could have a material adverse effect on well operations and economics.
We
do not operate wells but contract well operations to third party operators. Operators of our wells may perform fracking operations, or
contract third parties to perform such operations, on wells in which we participate. Many newer wells would not be economical without
the use of fracking to stimulate production from the well. At this time, it is not possible to estimate the impact on our business of
newly enacted or potential federal or state legislation governing hydraulic fracturing.
Climate
Change Legislation and Greenhouse Gas Regulation
Federal,
state and local laws and regulations are increasingly being enacted to address concerns about the effects the emission of “greenhouse
gases” may have on the environment and climate. These effects are widely referred to as “climate change.” Since its
December 2009 endangerment finding regarding the emission of greenhouse gases, the Environmental Protection Agency (the “EPA”)
has begun regulating sources of greenhouse gas emissions under the federal Clean Air Act. Among several regulations requiring reporting
or permitting for greenhouse gas sources, the EPA finalized its “tailoring rule” in May 2010 that determines which stationary
sources of greenhouse gases are required to obtain permits to construct, modify or operate on account of, and to implement the best available
control technology for, their greenhouse gases. The EPA’s final greenhouse gas reporting requirements pertain to certain oil and
gas production facilities.
Moreover,
the U.S. Congress has considered establishing a cap-and-trade program to reduce U.S. emissions of greenhouse gases. Under past proposals,
the EPA would issue or sell a capped and steadily declining number of tradable emissions allowances to certain major sources of greenhouse
gas emissions so that such sources could continue to emit greenhouse gases into the atmosphere. These allowances would be expected to
escalate significantly in cost over time. The net effect of such legislation, if ever adopted, would be to impose increasing costs on
the combustion of carbon-based fuels such as crude oil, refined petroleum products, and natural gas. In addition, while the prospect
for such cap-and-trade legislation by the U.S. Congress remains uncertain, several states have adopted, or are in the process of adopting,
similar cap-and-trade programs.
As
a crude oil and natural gas company, the debate on climate change is relevant to our operations because the regulatory response is designed
to reduce demand for, and use of, our products, oil and gas, in favor of alternative forms of energy. We cannot presently predict the
ultimate impact of existing or future climate change initiatives on our company or our industry although we do anticipate that, at a
minimum, we will incur additional operating and other costs to respond to such initiatives.
Web
Site Access to Reports
Our
Web site address is www.houstonamerican.com. We make available, free of charge on our Web site, our annual report on Form 10-K,
quarterly reports on Form 10-Q and current reports on Form 8-K, and all amendments to these reports as soon as reasonably practicable
after such material is electronically filed with, or furnished to, the United States Securities and Exchange Commission. Information
contained on our website is not incorporated by reference into this report and you should not consider information contained on our website
as part of this report.
Our
business activities and the value of our securities are subject to significant hazards and risks, including those described below. If
any of such events should occur, our business, financial condition, liquidity and/or results of operations could be materially harmed,
and holders and purchasers of our securities could lose part or all of their investments.
Company
and Organization Risks
We
have experienced recurring operating losses and may not attain profitability; attainment of profitability will require successful drilling
and development operations to support substantial increases in production and revenues.
We
have incurred losses from operations in each year since 2011 and, at December 31, 2024, had an accumulated deficit of $85,215,109. While
we have implemented cost control initiatives that have brought down our overhead in recent years and distributions of our share of profits
from Hupecol Meta have improved overall profitability, our ability to attain profitability is substantially dependent upon our other
oil and gas assets. In order to increase production and revenues, we will need to successfully drill new wells on our existing acreage
at a pace, and with results, significantly greater than in recent years. If, for any reason, we are unable to substantially increase
our production and revenues and sustain or grow our profitability, while controlling drilling costs and overhead, we may never attain,
or sustain, profitability. Our ability to so increase production and revenues and attain profitability is subject to all of the other
risks of oil and gas operations as well as our ability to fund our share of drilling and development operations.
Our
ability to operate profitably and our financial condition are highly dependent on energy prices. A substantial or extended decline in
oil and natural gas prices may adversely affect our business, financial condition or results of operations and our ability to meet our
capital expenditure obligations and financial commitments.
The
price we receive for our oil and natural gas production heavily influences our revenue, profitability, access to capital and future rate
of growth. Oil and natural gas are commodities and, therefore, their prices are subject to wide fluctuations in response to relatively
minor changes in supply and demand. Historically, the markets for oil and natural gas have been volatile. These markets will likely continue
to be volatile in the future. The prices we receive for our production depend on numerous factors beyond our control. These factors include,
but are not limited to, the following:
| |
● |
changes
in global supply and demand for oil and natural gas, including changes in demand resulting from general and specific economic conditions
relating to the business cycle and other factors (e.g., global health pandemics such as COVID-19); |
| |
|
|
| |
● |
the
actions of the Organization of Petroleum Exporting Countries, or OPEC; |
| |
|
|
| |
● |
the
price and quantity of imports of foreign oil and natural gas; |
| |
|
|
| |
● |
political
conditions, including embargoes, in or affecting other oil-producing activity; |
| |
|
|
| |
● |
the
level of global oil and natural gas exploration and production activity; |
| |
|
|
| |
● |
the
level of global oil and natural gas inventories; |
| |
|
|
| |
● |
weather
conditions; |
| |
|
|
| |
● |
technological
advances affecting energy consumption, including renewable energy initiatives that result in energy consumption transitioning away
from fossil fuels; and |
| |
|
|
| |
● |
the
price and availability of alternative fuels. |
Global
economic growth drives demand for energy from all sources, including fossil fuels. Should the U.S. and global economies experience weakness,
demand for energy may decline. Similarly, should growth in global energy production outstrip demand, excess supplies may arise. Declines
in demand and excess supplies may result in accompanying declines in commodity prices and deterioration of our financial position along
with our ability to operate profitably and our ability to obtain financing to support operations.
With
respect to our business, we have experienced periodic declines in demand thought to be associated with slowing economic growth in certain
markets, including the effects of the COVID-19 pandemic, coupled with new oil and gas supplies coming on line and other circumstances
beyond our control that resulted in oil and gas supply exceeding global demand which, in turn, resulted in steep declines in prices of
oil and natural gas.
Past
declines in prices reduced, and any declines that may occur in the future can be expected to reduce, our revenues and profitability as
well as the value of our reserves. Such declines adversely affect well and reserve economics and may reduce the amount of oil and natural
gas that we can produce economically, resulting in deferral or cancellation of planned drilling and related activities until such time,
if ever, as economic conditions improve sufficiently to support such operations. Any extended decline in oil or natural gas prices may
materially and adversely affect our future business, financial condition, results of operations, liquidity or ability to finance planned
capital expenditures.
Supply
chain challenges, such as those arising in the wake of the COVID-19 pandemic, may adversely affect our operations.
Supply
and demand imbalances, such as those arising from the COVID-19 pandemic, have resulted, and may result, in shortages, backlogs and delayed
deliveries of a wide array of products and services, including products and services critical to oil and gas operations. Any future outbreaks
of infectious disease, or other development, may result in supply chain challenges, in which case we may experience unavailability, or
delay in delivery, of products and services that are critical to our well operations. Any such delays may result in deferral or reduction
of revenues and increased costs, any of which could materially adversely affect our profitability.
Competition
in the oil and natural gas industry is intense, which may adversely affect our ability to compete.
We
operate in a highly competitive environment for acquiring properties, marketing oil and natural gas and securing trained personnel. Many
of our competitors possess and employ financial, technical and personnel resources substantially greater than ours, which can be particularly
important in the areas in which we operate. Those companies may be able to pay more for productive oil and natural gas properties and
exploratory prospects and to evaluate, bid for and purchase a greater number of properties and prospects than our financial or personnel
resources permit. Our ability to acquire additional prospects and to find and develop reserves in the future will depend on our ability
to evaluate and select suitable properties and to consummate transactions in a highly competitive environment. Also, there is substantial
competition for capital available for investment in the oil and natural gas industry. We may not be able to compete successfully in the
future in acquiring prospective reserves, developing reserves, marketing hydrocarbons, attracting and retaining quality personnel and
raising additional capital.
Our
ability to acquire additional mineral acreage and to drill and develop our existing acreage as well as other acreage that may be acquired
is subject to availability of financing on satisfactory terms.
Our
financial resources are limited and may not be adequate to fully drill and develop our acreage or to consummate any meaningful
acquisition. Our available funds as of February 2025 are expected to be adequate to fund our share of current existing well
expenses. However, our funds on hand are not expected to be adequate to support a long-term drilling and development plan with
respect to our existing acreage holdings, should such a plan be implemented.
We
may continue to seek to access the capital markets to support planned drilling operations or acquisitions through sales of equity securities
or may seek debt financing to support such capital requirements. We do not presently have any commitments to provide equity or debt financing
to support any future drilling operations or acquisitions and there can be no assurance that such financing will be available if and
when needed on acceptable terms or at all. If we are unable to fund our share of drilling and completion costs of future wells, we may
experience flat and declining production and revenues and decreased profitability and may be subject to penalties with respect to our
interest in acreage.
Our
ability to utilize our common stock to finance future capital needs, or for other purposes, is limited by our authorized shares available
for issuance.
As
of February 2025, we had authority to issue a total of 20 million shares of common stock, of which approximately 16 million shares had
been issued and 1 million shares were reserved for issuance pursuant to outstanding stock options and warrants.
We
have historically utilized “at-the-market” sales of our common stock to provide financing to support growth and operations.
With the limited shares of common stock presently available for issuance, our ability to secure additional funding through the sale of
common stock is limited. Absent an increase in the shares of common stock authorized to be issued, we will be limited to other financing
structures in the event additional financing is required. Such alternative structures may be less favorable or unavailable in which case
we may be forced to forego opportunities or required to downsize operations due to lack of funding.
We
may be unable to make attractive acquisitions and any acquisitions may be subject to substantial risks that could adversely affects our
business.
Acquisitions
of additional mineral acreage at favorable prices is part of our strategy to increase and diversify our holdings and grow our production
and revenues. We expect to focus our acquisition efforts in the Permian Basin with an emphasis on partnering with proven
operators in the area to acquire positions at favorable prices. Competition for mineral acreage in the Permian Basin is intense. Other
operators, particularly large operators, have historically paid substantially higher prices for Permian Basin acreage than we have paid.
There can be no assurance that we will be able to successfully acquire additional acreage in the Permian Basin, or elsewhere
at favorable prices or at all. Even if we are successful in acquiring additional acreage on favorable terms, it is possible that such
acreage (i) will be more speculative than higher priced acreage, (ii) may face challenges or limitations in drilling and operations such
as lack of, or limited access to, critical infrastructure, or (iii) may prove uneconomical.
Our
success depends on our staff, which is small in size and limited in technical capabilities, and third party consultants, the loss of
any of whom could disrupt our business operations.
Our
success will depend on our ability to attract and retain key staff members. Our staff is extremely small in size and possesses limited
technical capabilities. We do not presently maintain any significant internal technical capabilities but rely on the engineering, geological
and other technical skills of our board and third party consultants. If members of our staff should resign or we
are unable to attract the necessary personnel, our business operations could be adversely affected.
Our
charter and bylaws, as well as provisions of Delaware law, could make it difficult for a third party to acquire our company and also
could limit the price that investors are willing to pay in the future for shares of our common stock.
Delaware
corporate law and our charter and bylaws contain provisions that could delay, deter or prevent a change in control of our Company or
our management. These provisions could also discourage proxy contests and make it more difficult for our stockholders to elect directors
and take other corporate actions without the concurrence of our management or board of directors. These provisions:
| |
● |
authorize
our board of directors to issue “blank check” preferred stock, which is preferred stock that can be created and issued
by our board of directors, without stockholder approval, with rights senior to those of our common stock; |
| |
|
|
| |
● |
provide
for a staggered board of directors and three-year terms for directors, so that no more than one-third of our directors could be replaced
at any annual meeting; |
| |
|
|
| |
● |
provide
that directors may be removed only for cause; and |
| |
|
|
| |
● |
establish
advance notice requirements for submitting nominations for election to the board of directors and for proposing matters that can
be acted upon by stockholders at a meeting. |
We
are also subject to anti-takeover provisions under Delaware law, which could also delay or prevent a change of control. Taken together,
these provisions of our charter, bylaws, and Delaware law may discourage transactions that otherwise could provide for the payment of
a premium over prevailing market prices of our common stock and also could limit the price that investors are willing to pay in the future
for shares of our common stock.
Oil
and Gas Operating Risks
Drilling
for and producing oil and natural gas are high risk activities with many uncertainties that could adversely affect our business, financial
condition or results of operations.
Our
future success will depend on the success of our exploitation, exploration, development and production activities. Our oil and natural
gas exploration and production activities are subject to numerous risks beyond our control, including the risk that drilling will not
result in commercially viable oil or natural gas production. Our decisions to purchase, explore, develop or otherwise exploit prospects
or properties will depend in part on the evaluation of data obtained through geophysical and geological analyses, production data and
engineering studies, the results of which are often inconclusive or subject to varying interpretations. Please read “Reserve estimates
depend on many assumptions that may turn out to be inaccurate” (below) for a discussion of the uncertainty involved in these processes.
Our cost of drilling, completing and operating wells is often uncertain before drilling commences. Overruns in budgeted expenditures
are common risks that can make a particular project uneconomical. Further, many factors may curtail, delay or cancel drilling, including
the following:
| |
● |
delays
imposed by or resulting from compliance with regulatory requirements; |
| |
|
|
| |
● |
pressure
or irregularities in geological formations; |
| |
|
|
| |
● |
shortages
of or delays in obtaining equipment and qualified personnel; |
| |
|
|
| |
● |
equipment
failures or accidents; |
| |
|
|
| |
● |
adverse
weather conditions; |
| |
|
|
| |
● |
reductions
in oil and natural gas prices; |
| |
|
|
| |
● |
title
problems; and |
| |
|
|
| |
● |
limitations
in the market for oil and natural gas. |
Cost
overruns, curtailments, delays and cancellations of operations as a result of the above factors and other factors common in our industry
may materially adversely affect our operating results and financial position and our ability to maintain our interests in prospects.
We
are dependent upon third party operators of our oil and gas properties.
Under
the terms of the operating agreements related to our oil and gas properties, third parties act as the operator of each of our oil and
gas wells and control the drilling and operating activities to be conducted on our properties. Therefore, we have limited control over
certain decisions related to activities on our properties, which could affect our results of operations. Decisions over which we have
limited control include:
| |
● |
the
timing and amount of capital expenditures; |
| |
|
|
| |
● |
the
timing of initiating the drilling and recompleting of wells; |
| |
|
|
| |
● |
the
extent of operating costs; and |
| |
|
|
| |
● |
the
level of ongoing production. |
Decisions
made by our operators may be different than those we would make reflecting priorities different than our priorities and may materially
adversely affect our operating results and financial position, including potential declines in production and revenues from properties,
declines in value of properties and lease expirations, among other potential consequences.
Prospects
that we decide to drill may not yield oil or natural gas in commercially viable quantities.
Our
prospects are properties on which we have identified what we believe, based on available seismic and geological information, to be indications
of oil or natural gas potential. Our prospects are in various stages of evaluation, ranging from a prospect that is ready to drill to
a prospect that will require substantial seismic data processing and interpretation. There is no way to predict in advance of drilling
and testing whether any particular prospect will yield oil or natural gas in sufficient quantities to recover drilling or completion
costs or to be economically viable. The use of seismic data and other technologies and the study of producing fields in the same area
will not enable us to know conclusively prior to drilling whether oil or natural gas will be present or, if present, whether oil or natural
gas will be present in commercial quantities. We cannot assure that the analogies we draw from available data from other wells, more
fully explored prospects or producing fields will be applicable to our drilling prospects.
Our
operations are expected to involve use of horizontal drilling and completion techniques, which involve risks and uncertainties in their
application.
Our
operations, in most instances, are expected to involve utilizing some of the latest drilling and completion techniques as developed by
our service providers, including horizontal drilling and completion techniques. Risks that we face while drilling horizontal wells include,
but are not limited to, the following:
| |
● |
landing
the wellbore in the desired drilling zone; |
| |
|
|
| |
● |
staying
in the desired drilling zone while drilling horizontally through the formation; |
| |
|
|
| |
● |
running
casing the entire length of the wellbore; and |
| |
|
|
| |
● |
being
able to run tools and other equipment consistently through the horizontal wellbore. |
Risks
that we face while completing wells include, but are not limited to, the following:
| |
● |
the
ability to fracture stimulate the planned number of stages; |
| |
|
|
| |
● |
the
ability to run tools the entire length of the wellbore during completion operations; and |
| |
|
|
| |
● |
The
ability to successfully clean out the wellbore after completion of the final fracture stimulation stage. |
Horizontal
drilling in emerging areas with little or no history of use of such techniques is more uncertain than drilling in areas that are more
developed and have a longer history of established horizontal drilling operations. If our horizontal drilling fails to adequately address
the risks described, we may incur costs overruns, underperformance by wells or non-productive wells.
The
unavailability or high cost of drilling rigs, equipment, supplies, personnel, water disposal and oil field services could adversely affect
our ability to execute on a timely basis our exploration and development plans within our budget and operate profitably.
Shortages
or the high cost of drilling rigs, equipment, supplies or personnel, including shortages or unavailability of personnel, supplies and
equipment, could delay or adversely affect our development and exploration operations. If the price of oil and natural gas increases,
the demand for production equipment and personnel will likely also increase, potentially resulting, at least in the near-term, in shortages
of equipment and personnel. In addition, larger producers may be more likely to secure access to such equipment by virtue of offering
drilling companies more lucrative terms. In particular, high levels of horizontal drilling and hydraulic fracturing operations in the
Permian Basin have, from time to time, created increased demand, and higher costs, for associated drilling and completion services, water
supply, handling and disposal and access to production handling and transportation infrastructure, each of which have resulted in higher
than anticipated prices with respect to our initial Reeves County wells. If we are unable to acquire access to such resources, or can
obtain access only at higher prices, not only would this potentially delay our ability to convert our reserves into cash flow but could
also significantly increase the cost of producing those reserves, thereby negatively impacting anticipated net income.
We
may not be able to obtain access on commercially reasonable terms or otherwise to pipelines and storage facilities, gathering systems
and other transportation, processing, fractionation and refining facilities to market our oil and gas production; we rely on a limited
number of purchasers of our products.
The
marketing of oil and gas production depends in large part on the availability, proximity and capacity of pipelines and storage facilities,
gathering systems and other transportation, processing, fractionation and refining facilities, as well as the existence of adequate markets.
If there were insufficient capacity available on these systems, if these systems were unavailable to us, or if access to these systems
were to become commercially unreasonable, the price offered for our production could be significantly depressed, or we could be forced
to shut in some production or delay or discontinue drilling plans and commercial production following a discovery of hydrocarbons while
we construct our own facility or await the availability of third party facilities. We rely on facilities developed and owned by third
parties in order to store, process, transport, fractionate and sell our oil and gas production. Our plans to develop and sell our oil
and gas reserves could be materially and adversely affected by the inability or unwillingness of third parties to provide sufficient
transportation, storage or processing and fractionation facilities to us, especially in areas of planned expansion where such facilities
do not currently exist.
The
amount of oil and gas that can be produced is subject to limitations in certain circumstances, such as pipeline interruptions due to
scheduled and unscheduled maintenance, excessive pressure, physical damage to the gathering, transportation, refining or processing facilities,
or lack of capacity on such facilities. Curtailments arising from these and similar circumstances may last from a few days to several
months, resulting in lost or curtailed production and revenues.
We
may operate in areas with limited or no access to pipelines, thereby necessitating delivery by other means, such as trucking, or requiring
compression facilities. This may be particularly true with respect to our Colombian acreage where infrastructure is limited or, in some
cases, non-existent. Such restrictions on our ability to sell our oil or natural gas could have several adverse effects, including higher
transportation costs, fewer potential purchasers (thereby potentially resulting in a lower selling price) or, in the event we were unable
to market and sustain production from a particular lease for an extended time, possibly causing us to lose a lease due to lack of production.
To
the extent that we enter into transportation contracts with pipelines that are subject to FERC regulation, we are subject to FERC requirements
related to use of such capacity. Any failure on our part to comply with FERC’s regulations and policies or with an interstate pipeline’s
tariff could result in the imposition of civil and criminal penalties.
A
limited number of companies purchase a majority of our production. The loss of a significant purchaser could have a material adverse
effect on our ability to sell production.
Our
oil and gas holdings and operations are concentrated, and we are dependent upon the results of drilling and production operations on
a small number of prospects and wells. If those properties and wells perform below expectations, we may experience production, revenues
and profitability below expectations.
We
have historically been focused on development of a small number of geographically concentrated prospects. Accordingly, we lack diversification
with respect to the nature and geographic location of our holdings. As a result, we are exposed to higher dependence on individual resource
plays and may experience substantial losses should a single individual prospect prove unsuccessful. At December 31, 2024, we owned interests
in 3,040 net acres and 98 net wells in the United States and, through properties owned and/or operated by Hupecol entities, 572 net acres
and 0.64 net wells in Colombia. While we continually evaluate potential prospects in operations in diverse regions, our production, revenues
and profitability for the foreseeable future are expected to be highly dependent upon the results of existing and future wells we may
drill in the Permian Basin. In order to grow our revenues and improve profitability, we must continue to drill productive wells. If existing
wells, or future wells we may drill, perform below expectations, we may experience flat or declining production and revenues and may
be unable to attain profitability.
Unless
we replace our oil and natural gas reserves, our reserves and production will decline, which would adversely affect our cash flows and
income.
Unless
we conduct successful development, exploitation and exploration activities or acquire properties containing proved reserves, our proved
reserves will decline as those reserves are produced. Producing oil and natural gas reservoirs generally are characterized by declining
production rates that vary depending upon reservoir characteristics and other factors. Our future oil and natural gas reserves and production,
and, therefore our cash flow and income, are highly dependent on our success in efficiently developing and exploiting our current reserves
and economically finding or acquiring additional recoverable reserves. If we are unable to develop, exploit, find or acquire additional
reserves to replace our current and future production, our cash flow and income will decline as production declines, until our existing
properties would be incapable of sustaining commercial production.
A
substantial percentage of our properties are unproven and undeveloped; therefore, the cost of proving and developing our properties and
risk associated with our success is greater than would be the case if the majority of our properties were categorized as proved developed
producing.
Because
a substantial percentage of our properties are unproven and/or undeveloped, we require significant capital to prove and develop such
properties before they may become productive. Because of the inherent uncertainties associated with drilling for oil and gas, some of
these properties may never be successfully drilled and developed to the extent that they result in positive cash flow. Even if we are
successful in our drilling and development efforts, it could take several years for a significant portion of our unproven properties
to be converted to positive cash flow.
We
may incur substantial uninsured losses and be subject to substantial liability claims as a result of our oil and natural gas operations.
We
are not insured against all risks. Losses and liabilities arising from uninsured and underinsured events could materially and adversely
affect our business, financial condition or results of operations. Our oil and natural gas exploration and production activities are
subject to all of the operating risks associated with drilling for and producing oil and natural gas, including the possibility of:
| |
● |
environmental
hazards, such as uncontrollable flows of oil, natural gas, brine, well fluids, toxic gas or other pollution into the environment,
including groundwater and shoreline contamination; |
| |
|
|
| |
● |
abnormally
pressured formations; |
| |
|
|
| |
● |
mechanical
difficulties, such as stuck oil field drilling and service tools and casing collapse; |
| |
|
|
| |
● |
fires
and explosions; |
| |
|
|
| |
● |
personal
injuries and death; and |
| |
|
|
| |
● |
natural
disasters. |
Any
of these risks could adversely affect our ability to conduct operations or result in substantial losses to our company. We may elect
not to obtain insurance if we believe that the cost of available insurance is excessive relative to the risks presented. In addition,
pollution and environmental risks generally are not fully insurable. The occurrence of a significant accident or other event that is
not fully covered by insurance could have a material adverse effect on our business, results of operations or financial condition.
If
oil and natural gas prices decrease, we may be required to take write-downs of the carrying values of our oil and natural gas properties.
Accounting
rules require that we review periodically the carrying value of our oil and natural gas properties for possible impairment. Based on
specific market factors and circumstances at the time of prospective impairment reviews, and the continuing evaluation of development
plans, production data, economics and other factors, we have written down the carrying value of our oil and natural gas properties periodically
and may be required to further write down the carrying value of oil and gas properties in the future. A write-down would constitute a
non-cash charge to earnings. It is likely the cumulative effect of a write-down could also negatively impact the trading price of our
securities.
Reserve
estimates depend on many assumptions that may turn out to be inaccurate. Any material inaccuracies in these reserve estimates or underlying
assumptions will materially affect the quantities and present value of our reserves.
The
process of estimating oil and natural gas reserves is complex, requiring interpretations of available technical data and many assumptions,
including assumptions relating to economic factors. Any significant inaccuracies in these interpretations or assumptions could materially
affect the estimated quantities and present value of reserves reported.
In
order to prepare our estimates, we must project production rates and timing of development expenditures. We must also analyze available
geological, geophysical, production and engineering data. The extent, quality and reliability of this data can vary. The process also
requires economic assumptions about matters such as oil and natural gas prices, drilling and operating expenses, capital expenditures,
taxes and availability of funds. Therefore, estimates of oil and natural gas reserves are inherently imprecise.
Actual
future production, oil and natural gas prices, revenues, taxes, development expenditures, operating expenses and quantities of recoverable
oil and natural gas reserves most likely will vary from our estimates. Any significant variance could materially affect the estimated
quantities and present value of our reserves. In addition, we may adjust estimates of proved reserves to reflect production history,
results of exploration and development activities, prevailing oil and natural gas prices and other factors, many of which are beyond
our control.
The
present value of future net revenues from our proved reserves, as reported from time to time, should not be assumed to be the current
market value of our estimated oil and natural gas reserves. In accordance with SEC requirements, we generally base the estimated discounted
future net cash flows from our proved reserves on costs on the date of the estimate and average prices over the preceding twelve months.
Actual future prices and costs may differ materially from those used in the present value estimate. If future prices decline or costs
increase it could negatively impact our ability to finance operations, and individual properties could cease being commercially viable,
affecting our decision to continue operations on producing properties or to attempt to develop properties. All of these factors would
have a negative impact on earnings and net income, and most likely the trading price of our securities.
Our
operations will be subject to environmental and other government laws, regulations and policies that are costly, could potentially subject
us to substantial liabilities and potentially result in decreased demand for products.
Crude
oil and natural gas exploration and production operations in the United States and in Colombia are subject to extensive federal, state
and local laws and regulations. Oil and gas companies are subject to laws and regulations addressing, among others, land use and lease
permit restrictions, bonding and other financial assurance related to drilling and production activities, spacing of wells, unitization
and pooling of properties, environmental and safety matters, plugging and abandonment of wells and associated infrastructure after production
has ceased, operational reporting and taxation. Failure to comply with such laws and regulations can subject us to governmental sanctions,
such as fines and penalties, as well as potential liability for personal injuries and property and natural resources damages. We may
be required to make significant expenditures to comply with the requirements of these laws and regulations, and future laws or regulations,
or any adverse change in the interpretation of existing laws and regulations, could increase such compliance costs. Regulatory requirements
and restrictions could also delay or curtail our operations and could have a significant impact on our financial condition or results
of operations.
Our
oil and gas operations are subject to stringent laws and regulations relating to the release or disposal of materials into the environment
or otherwise relating to environmental protection. These laws and regulations:
| |
● |
require
the acquisition of a permit before drilling commences; |
| |
|
|
| |
● |
restrict
the types, quantities and concentration of substances that can be released into the environment in connection with drilling and production
activities; |
| |
|
|
| |
● |
limit
or prohibit drilling activities on certain lands lying within wilderness, wetlands and other protected areas; and |
| |
|
|
| |
● |
impose
substantial liabilities for pollution resulting from operations. |
Failure
to comply with these laws and regulations may result in:
| |
● |
the
imposition of administrative, civil and/or criminal penalties; |
| |
|
|
| |
● |
incurring
investigatory or remedial obligations; and |
| |
|
|
| |
● |
the
imposition of injunctive relief. |
Changes
in environmental laws and regulations occur frequently, and any changes that result in more stringent or costly waste handling, storage,
transport, disposal or cleanup requirements could require us to make significant expenditures to attain and maintain compliance and may
otherwise have a material adverse effect on our industry in general and on our own results of operations, competitive position or financial
condition. Although we intend to be in compliance in all material respects with all applicable environmental laws and regulations, we
cannot assure you that we will be able to comply with existing or new regulations. In addition, the risk of accidental spills, leakages
or other circumstances could expose us to extensive liability.
We
are unable to predict the effect of additional environmental laws and regulations that may be adopted in the future, including whether
any such laws or regulations would materially adversely increase our cost of doing business or affect operations in any area.
Under
certain environmental laws that impose strict, joint and several liability, we may be required to remediate our contaminated properties
regardless of whether such contamination resulted from the conduct of others or from consequences of our own actions that were or were
not in compliance with all applicable laws at the time those actions were taken. In addition, claims for damages to persons or property
may result from environmental and other impacts of our operations. Moreover, new or modified environmental, health or safety laws, regulations
or enforcement policies could be more stringent and impose unforeseen liabilities or significantly increase compliance costs. Therefore,
the costs to comply with environmental, health or safety laws or regulations or the liabilities incurred in connection with them could
significantly and adversely affect our business, financial condition or results of operations.
In
addition, many countries as well as several states and regions of the U.S. have agreed to regulate emissions of “greenhouse gases”
and have adopted policies to actively promote alternative energy “green energy” sources that are specifically designed to
replace fossil fuels. Methane, a primary component of natural gas, and carbon dioxide, a byproduct of burning of natural gas and oil,
are greenhouse gases. Regulation of greenhouse gases could adversely impact some of our operations and “green energy” initiatives
could substantially reduce demand for our products in the future.
Increased
regulation, or limitations on the use, of hydraulic fracturing could increase our cost of operations and reduce profitability.
Our
existing Permian Basin wells have been hydraulically fractured and future wells that we may drill in the Permian Basin are expected to
be economically viable only if hydraulic fracturing is utilized to increase flows of oil and natural gas, particularly in shale formations.
The use of hydraulic fracturing has been the subject of much scrutiny and debate in recent years with many activists and state and federal
legislators and regulators actively pushing for most stringent regulation of such operations or even the ban of such operations.
In
the event that state or federal regulation of hydraulic fracturing is increased or hydraulic fracturing is substantially curtailed or
prohibited through law or regulation, our cost of drilling and operating wells may increase substantially. In some cases, increased costs
associated with increased regulation of hydraulic fracturing, or the prohibition of hydraulic fracturing, may result in wells being uneconomical
to drill and operate that would otherwise be economical to drill and operate in the absence of such regulations or prohibitions. Should
wells be determined to be uneconomical as a result of increasing regulation of hydraulic fracturing, we may be required to write-down
or abandon oil and gas properties that are determined to be uneconomical to drill and develop. Additionally, potential litigation arising
from alleged harm resulting from hydraulic fracturing may materially adversely affect our financial results and position regardless of
whether we prevail on the merits of such litigation.
International
Operations Risks
Our
operations in Colombia are controlled by operators which may carry out transactions affecting our Colombian assets and operations without
our consent.
Our
operations in Colombia are subject to a substantial degree of control by the operators of the properties in which we hold indirect interests
in Colombia. We have been an investor in a number of ventures operated by Hupecol, including our current holdings in the CPO-11 block,
which represents all of our current assets in Colombia. In the past, Hupecol sold its interest in multiple concessions and entities holding
multiple concessions each representing, at the time, the largest prospect(s) in terms of reserves and revenues in which we then held
an interest. Additionally, Hupecol has, on occasion, temporarily shut-in production from our Colombian properties. Hupecol advised us,
in late 2023, that it intends to evaluate monetization of the CPO-11 block. Our management intends to closely monitor the nature and
progress of Hupecol’s efforts to monetize the block in order to protect our interests. However, we have no effective ability to
alter or prevent a transaction and are unable to predict whether or not any such transactions will in fact occur or the nature or timing
of any such transaction.
As
of December 31, 2024, the Company determined it was necessary to take an impairment charge for our investment in Hupecol Meta due to
indications that its earnings performance has deteriorated, and the investment is no longer viewed as viable. We determined that we are
unlikely to receive any substantial amount of proceeds upon the sale of Hupecol Meta, rendering the value of the investment fully impaired.
We
may be exposed to additional expenses and losses arising from the financial position of our joint interest partners in Colombia.
Our
Colombian properties are developed under financial arrangements with various joint interest partners. In 2022, we acquired a portion
of a joint interest partner’s interest in Hupecol Meta, which operates the CPO-11 block, when the joint interest partner was unable
to fund its portion of development costs. As a result of such acquisition, while we did increase our ownership interest in the prospect,
we assumed an increased portion of the prospect’s development costs. If other joint interest partners are unable, or unwilling,
to satisfy their various obligations relating to prospects, we may be required to pay a proportionately higher share of development costs
on those prospects or the prospect may be inadequately capitalized to achieve optimal results.
We
may be exposed to substantial fines and penalties if we or our partners fail to comply with laws and regulations associated with our
activities in foreign countries, including Colombia, regarding U.S. laws such as the Foreign Corrupt Practices Act and local laws prohibiting
corrupt payments to governmental officials and other corrupt practices.
Third
parties act as the operator of each of our oil and gas wells and control all drilling and operating activities conducted with respect
to our Colombian properties. Therefore, we have limited control over decisions related to activities on our properties, and we cannot
provide assurance that our partners or their employees, contractors or agents will not take actions in violation of applicable anti-corruption
laws and regulations. In the course of conducting business in Colombia, we have relied primarily on the representations and warranties
made by our operating and non-operating partners in the farmout and joint operating agreements which govern our respective project interests
to the effect that:
| |
● |
each
party has not and will not offer or make payments to any person, including a government official, that would violate the laws of
the country of operations, the country of formation of any of the partners or the principals described in the Convention on Combating
Bribery of Foreign Public Officials in International Business Transactions; and |
| |
|
|
| |
● |
each
party will maintain adequate internal controls, properly record and report all transactions and comply with the laws applicable to
the transaction. |
While
we periodically inquire as to the continuing accuracy of these representations, as a minority non-operator, we are limited in our ability
to assure compliance. Consequently, we cannot provide assurance that the procedural safeguards, if any, adopted by our partners or the
representations and warranties contained in these agreements and our reliance on them will protect us from liability should a violation
occur. Any violations of the anti-bribery, accounting controls or books and records provisions of the Foreign Corrupt Practices Act by
us or our partners could subject us and, where deemed appropriate, individuals, in certain cases, to a broad range of civil and criminal
penalties, including but not limited to, imprisonment, injunctive relief, disgorgement, substantial fines or penalties, prohibitions
on our ability to offer our products in one or more countries, imposed modifications to business practices and compliance programs, including
retention of an independent monitor to oversee compliance, and could also materially damage our reputation, our business and our operating
results.
Stock
Related Risks
The
price of our common stock may fluctuate significantly, and this may make it difficult to resell common stock when, or at prices, desired.
The
price of our common stock constantly changes. We expect that the market price of our common stock will continue to fluctuate.
Our
stock price may fluctuate as a result of a variety of factors, many of which are beyond our control. These factors include:
| |
● |
quarterly
variations in our operating results; |
| |
|
|
| |
● |
operating
results that vary from the expectations of management, securities analysts and investors; |
| |
|
|
| |
● |
changes
in expectations as to our future financial performance; |
| |
● |
announcements
by us, our partners or our competitors of leasing and drilling activities; |
| |
|
|
| |
● |
the
operating and securities price performance of other companies that investors believe are comparable to us; |
| |
|
|
| |
● |
future
sales of our equity or equity-related securities; |
| |
|
|
| |
● |
changes
in general conditions in our industry and in the economy, the financial markets and the domestic or international political situation; |
| |
|
|
| |
● |
fluctuations
in oil and gas prices; |
| |
|
|
| |
● |
departures
of key personnel; and |
| |
|
|
| |
● |
regulatory
considerations. |
The
stock market periodically experiences extreme price and volume fluctuations. This volatility has had a significant effect on the market
price of securities issued by many companies for reasons often unrelated to their operating performance. These broad market fluctuations
may adversely affect our stock price, regardless of our operating results.
The
sale of a substantial number of shares of our common stock may affect our stock price.
We
may require additional capital to support our future drilling plans and may issue additional shares of our common stock or equity-related
securities to secure such capital. Future sales of substantial amounts of our common stock or equity-related securities in the public
market or privately, or the perception that such sales could occur, could adversely affect prevailing trading prices of our common stock
and could impair our ability to raise capital through future offerings of equity or equity-related securities. No prediction can be made
as to the effect, if any, that future sales of shares of common stock or the availability of shares of common stock for future sale will
have on the trading price of our common stock.
| Item
1B. |
Unresolved Staff Comments |
Not
applicable.
We do not presently maintain any formal processes for assessing, identifying and managing material risks from cybersecurity threats.
We
engage a consultant to maintain our website, email, financial record keeping and related internet capabilities, including, as necessary,
addressing any cybersecurity incidents. To date we have not experienced any material cybersecurity incidents. Given the nature of our
operations (single location, minimal customer interface, no gathering of customer digital data, etc.), we do not believe that we are
reasonably likely to face any material cybersecurity risks.
Our
audit committee is tasked with oversight of risks from cybersecurity threats. Our audit committee interfaces with our consultant periodically
to assess vulnerability to cybersecurity threats and determine actions to be taken in response to such threats. In the event risks are identified and actions are recommended by our consultant, our audit committee will communicate the same to our chief executive officer
who is charged with interfacing with our consultant in addressing any identified cybersecurity threats. Similarly, if our officers become
aware of material cybersecurity threats, they are charged with communicating the same to our audit committee.
We
currently lease approximately 3,080 square feet of office space in Houston, Texas as our executive offices. Management anticipates that
our space will be sufficient for the foreseeable future. The average monthly rental under the lease, which expires on October 31, 2025,
is approximately $7,200. A description of our interests in oil and gas properties is included in “Item 1. Business.”
| Item
3. |
Legal Proceedings |
We
may from time to time be a party to lawsuits incidental to our business. As of February 20, 2025, we were not aware of any current, pending
or threatened litigation or proceedings that could have a material adverse effect on our results of operations, cash flows or financial
condition.
| Item
4. |
Mine Safety Disclosures |
Not
applicable.
PART
II
| Item
5. |
Market for Registrant’s Common Equity, Related Stockholder
Matters and Issuer Purchases of Equity Securities |
Market
Information
Our
common stock is listed on the NYSE American under the symbol “HUSA.”
Holders
As of February 21, 2025, there were approximately 873 shareholders of record
of our common stock.
Securities
Authorized for Issuance Under Equity Compensation Plans
The
following table provides information as of December 31, 2024 with respect to the shares of our common stock that may be issued under
our existing equity compensation plans.
| Plan Category | |
Number of securities to be issued upon exercise of outstanding options, warrants and rights (a) | | |
Weighted-average exercise price of outstanding options, warrants and rights (b) | | |
Number of securities remaining available for future issuance under equity compensation plans (excluding securities reflected in column (a)) | |
| Equity compensation plans approved by security holders (1) | |
| 916,987 | | |
$ | 2.09 | | |
| 87,680 | |
| Equity compensation plans not approved by security holders | |
| — | | |
| — | | |
| — | |
| | |
| | | |
| | | |
| | |
| | |
| 916,987 | | |
$ | 2.09 | | |
| 87,680 | |
| (1) |
Consists of shares (a) reserved for issuance pursuant to outstanding
options granted and (b) shares remaining available for future issuance; under the Houston American Energy Corp. 2021 Equity Incentive
Plan. |
| Item
6. |
Selected Financial Data |
Not
applicable.
| Item
7. |
Management’s Discussion and Analysis of Financial
Condition and Results of Operations |
General
We
are an independent energy company focused on the development, exploration, exploitation, acquisition, and production of natural gas and
crude oil properties with principal holdings in the U.S. Permian Basin, the South American country of Colombia and additional holdings
in the U.S. Gulf Coast region.
Our
mission is to deliver outstanding net asset value per share growth to our investors via attractive oil and gas investments. Our strategy
is to focus on early identification of, and opportunistic entrance into, existing and emerging resource plays. We do not operate wells
but typically seek to partner with larger operators in development of resources or retain interests, with or without contribution on
our part, in prospects identified, packaged and promoted to larger operators. By entering these plays earlier, identifying stranded blocks
and partnering with, or promoting to, larger operators, we believe we can capture larger resource potential at lower cost and minimize
our exposure to drilling risks and costs and ongoing operating costs.
We,
along with our partners, actively manage our resources through opportunistic acquisitions and divestitures where reserves can be identified,
developed, monetized and financial resources redeployed with the objective of growing reserves, production and shareholder value.
Generally,
we generate nearly all our revenues and cash flows from the sale of produced natural gas and crude oil, whether through royalty interests,
working interests or other arrangements. We may also realize gains and additional cash flows from the periodic divestiture of assets.
Recent
Developments
Lease
Activity
Colombia.
In 2023, we released our interest in the last of our legacy non-Hupecol Meta properties in Colombia, formally terminating our interests
in the Picachos and Macaya blocks. We recognized a loss on disposal of oil and gas properties of $2,343,126
as a result of this transaction.
At
December 31, 2024, our sole holdings in Colombia consisted of our interest in Hupecol Meta which holds a working interest in the 639,405
gross acre CPO-11 block in the Llanos Basin in Colombia, comprised of the 69,128 acre Venus Exploration Area and 570,277 acres, which
was 50% farmed out by Hupecol Meta. Through our ownership interest in Hupecol Meta, we hold an approximately 16% interest in the Venus
Exploration Area and an approximately 8% interest in the remainder of the block.
Hupecol
Meta has (i) proposed to relinquish approximately 62,139 gross acres within the Venus Exploration Area, decreasing its holding within
that area to approximately 7,157 gross, and 1,145 net, acres; and (ii) agreed to acquire the 50% interest in the CPO-11 block farmed
out to Parex Resources, which would increase Hupecol Meta’s net acreage position in the block to 91,244 acres. The relinquishment
of such acreage and acquisition of the Parex interest are both subject to approval of the Colombian hydrocarbons agency, or ANH.
As of December 31, 2024, the company
determined it was necessary to take an impairment charge for our investment in Hupecol Meta due to indications that its earnings performance
has deteriorated, and the investment is no longer viewed as viable. We determined that we are unlikely to receive any substantial amount
of proceeds upon the sale of Hupecol Meta, rendering the value of the investment fully impaired.
United
States. During 2023, we experienced lease expirations in Yoakum County, Texas (46 net acres).
Drilling
Activity and Well Operations
Colombia.
During 2023, Hupecol Meta drilled and completed, and production commenced on, two wells in Colombia, the Venus 1-H horizontal well
and the Venus 2-H ST1 horizontal well. The Saturno 1ST-1 vertical well, drilled in 2022, was shut-in during the third quarter
of 2023 and brought back onto production in late 2023. The legacy well Venus 2A was in production through 2023. At December 31, 2024,
Hupecol Meta had 4 wells on production.
United
States. During 2023, we drilled no wells on our U.S. properties. During 2024, the operator of the O’Brien Lease, EOG, decided
to drill six new wells on the Finkle State Unit. We decided to participate in the drilling of those wells. We anticipate production from
those wells to begin in the second quarter of 2025.
At
December 31, 2024, we had 4 wells on production in the U.S. Permian Basin.
Capital
Investments
During
2024, our capital investment expenditures for acreage acquisitions, drilling, completion and related operations, as well as investments
relating to Hupecol Meta, totaled $1,887,516, all of which was attributable to direct investments in Hupecol Meta to fund our share of
drilling and operating costs.
Distributions
from Equity Investment
During
2024, we received distributions, totaling $922,719, from Hupecol Meta, representing our share of distributable net income and reflected
as “Other Income” on our Statement of Operations.
Impairment
of Hupecol Meta Investment
Hupecol
has advised that it intends to evaluate potential monetization of its assets in Colombia, including the interest in the CPO-11 block
held by Hupecol Meta. Pending the outcome of Hupecol’s evaluation of, and potential efforts regarding, monetization of the CPO-11
block, we have no planned drilling operations, or other planned operations, in Colombia and we expect to continue to operate our existing
wells on the CPO-11 block. There is no assurance as to the timing or outcome of Hupecol’s potential monetization of assets.
As of December 31, 2024, the Company
determined it was necessary to take an impairment charge for our investment in Hupecol Meta due to indications that its earnings performance
has deteriorated, and the investment is no longer viewed as viable. We determined that we are unlikely to receive any substantial amount
of proceeds upon the sale of Hupecol Meta, rendering the value of the investment fully impaired.
Financing
Activities
In
November 2022, we entered into an At-the-Market Sales Agreement (the “Sales Agreement”) with Univest Securities, LLC (“Univest”)
pursuant to which we could sell (the “2022 ATM Offering”), at our option, up to an aggregate of $3.5 million in shares of
common stock through Univest, as sales agent. Sales of shares under the Sales Agreement (the “2022 ATM Offering”) were made,
in accordance with placement notices delivered to Univest, which notices set parameters under which shares could be sold. The 2022 ATM
Offering was made pursuant to a shelf registration statement by methods deemed to be “at the market,” as defined in Rule
415 promulgated under the Securities Act of 1933. We pay Univest a commission in cash equal to 3% of the gross proceeds from the sale
of shares in the 2022 ATM Offering. We reimbursed Univest for $25,000 of expenses incurred in connection with the 2022 ATM Offering.
During
2023, we sold an aggregate of 578,707 shares in connection with the 2022 ATM Offering and received proceeds, net of commissions and expenses,
of $1,652,000.
In
2024, we sold 2,180,180 shares of our common stock in a private placement for net proceeds of $2,325,000.
In
January 2025, we sold 2,600,000 shares of our common stock in a registered direct offering for net proceeds of $3,897,000.
Executive
Compensation Changes
In
November 2024, we entered into an agreement with John Terwilliger, our then Chief Executive Officer, to pay Mr. Terwilliger $800,000
in exchange for terminating his change of control agreement with the Company. Mr. Terwilliger retired as a director on December 31,
2025 and remains an advisor to the Company for $2,500 per month.
Impairment
Charge
During
2024, we incurred an impairment charge of $6,668,634. The impairment charge was attributable to the conclusion to write
down our investment in Hupecol Meta ($6,392,874) and impairment of our US assets ($275,760) attributable to declines in energy prices
and production relating to our Reeves County properties, partially offset by our proved non-producing properties.
Planned
Acquisitions
On
December 12, 2024, the Company entered into two non-binding letters of intent relating to the acquisition of Abundia Global Impact Group,
LLC (“AGIG”) and RPD Technologies, LLC (“RPD”).
On
February 20, 2025, the Company entered into a Share Exchange Agreement with the members of Abundia Global Impact Group, LLC
(“AGIG”). In the Share Exchange Agreement, the Company has agreed to issue to the members of AGIG a number of shares of
our common stock equal to 94% of the Company’s issued and outstanding shares (after taking into account such issuance). As a
result of entering into the Share Exchange Agreement, we will acquire all of the issued and outstanding units of AGIG, and AGIG will
become a wholly-owned subsidiary of the Company. Under the Share Exchange Agreement, the Company is obligated to obtain shareholder
approval for the amendment of our Certificate of Incorporation to increase the number of authorized shares of common stock to 300,000,000 shares
and for the issuance of approximately 246,000,000 shares to the members of AGIG. The Company expects the AGIG
acquisition to close early in the second quarter. The acquisition is subject to shareholder approval and standard closing conditions.
On
February 7, 2025, the Company amended the non-binding letter of intent for the acquisition of RPD. Under the amended letter of
intent, the Company will acquire all of the assets of RPD. Upon entering into this letter of intent, the Company paid RPD a
refundable deposit of $160,000, which will be applied toward the purchase price. The Company expects the RPD acquisition to close in the second
quarter.
As
a result of the AGIG and RPD transactions, the Company will focus on developing a production plant for plastics and petrochemicals in
the Houston area. The acquisition supports a strategy that will diversify the Company’s portfolio into the energy transition
sector.
Critical
Accounting Estimates and Policies
The
following describes the critical accounting policies used in reporting our financial condition and results of operations. In some cases,
accounting standards allow more than one alternative accounting method for reporting. Such is the case with accounting for oil and gas
activities described below. In those cases, our reported results of operations would be different should we employ an alternative accounting
method.
Full
Cost Method of Accounting for Oil and Gas Activities. We follow the full cost method of accounting for oil and gas property acquisition,
exploration and development activities. Under this method, all productive and nonproductive costs incurred in connection with the exploration
for and development of oil and gas reserves are capitalized. Capitalized costs include lease acquisition, geological and geophysical
work, delay rentals, costs of drilling, completing and equipping successful and unsuccessful oil and gas wells and related internal costs
that can be directly identified with acquisition, exploration and development activities, but does not include any cost related to production,
general corporate overhead or similar activities. Gain or loss on the sale or other disposition of oil and gas properties is not recognized
unless significant amounts of oil and gas reserves are involved. No corporate overhead has been capitalized as of December 31, 2024.
The capitalized costs of oil and gas properties, plus estimated future development costs relating to proved reserves, are amortized on
a units-of-production method over the estimated productive life of the reserves. Unevaluated oil and gas properties are excluded from
this calculation. The capitalized oil and gas property costs, less accumulated amortization, are limited to an amount (the ceiling limitation)
equal to the sum of: (a) the present value of estimated future net revenues from the projected production of proved oil and gas reserves,
calculated using the average oil and natural gas sales price received by the company as of the first trading day of each month over the
preceding twelve months (such prices are held constant throughout the life of the properties) and a discount factor of 10%; (b) the cost
of unproved and unevaluated properties excluded from the costs being amortized; (c) the lower of cost or estimated fair value of unproved
properties included in the costs being amortized; and (d) related income tax effects. Costs in excess of this ceiling are charged to
proved properties impairment expense.
Revenue
recognition. On January 1, 2018, we adopted the new revenue guidance using the modified retrospective method for contracts that were
not complete at December 31, 2017. ASU 2014-09, “Revenue from Contracts with Customers (Topic 606)”. Topic 606 requires
an entity to recognize revenue when it transfers promised goods or services to customers in an amount that reflects the consideration
the entity expects to be entitled to in exchange for those goods or services. We adopted Topic 606 on January 1, 2018, using the modified
retrospective method applied to contracts that were not completed as of January 1, 2018. Under the modified retrospective method, prior
period financial positions and results are not adjusted. The cumulative effect adjustment recognized in the opening balances included
no significant changes as a result of this adoption. While our 2018 net earnings were not materially impacted by revenue recognition
timing changes, Topic 606 requires certain changes to the presentation of revenues and related expenses beginning January 1, 2018.
Our
revenue is comprised principally of revenue from exploration and production activities. Our oil is sold primarily to marketers, gatherers,
and refiners. Natural gas is sold primarily to interstate and intrastate natural-gas pipelines, direct end-users, industrial users, local
distribution companies, and natural-gas marketers. Natural gas liquids, or NGLs, are sold primarily to direct end-users, refiners, and
marketers. Payment is generally received from the customer in the month following delivery.
Contracts
with customers have varying terms, including spot sales or month-to-month contracts, contracts with a finite term, and life-of-field
contracts where all production from a well or group of wells is sold to one or more customers. We recognize sales revenues for oil, natural
gas, and NGLs based on the amount of each product sold to a customer when control transfers to the customer. Generally, control transfers
at the time of delivery to the customer at a pipeline interconnect, the tailgate of a processing facility, or as a tanker lifting is
completed. Revenue is measured based on the contract price, which may be index-based or fixed, and may include adjustments for market
differentials and downstream costs incurred by the customer, including gathering, transportation, and fuel costs.
The
Company estimated the December 2024 revenue and related drilling expenses for two US wells. Using actual oil production results for the
month, the Company used historical lease operating expenses and average price per BBL from prior months to calculate these estimates.
No gas or NGL related revenue or expenses are included in the estimate.
Revenues
are recognized for the sale of our net share of production volumes.
Stock-Based
Compensation. We use the Black-Scholes option-pricing model, which requires the input of highly subjective assumptions. These assumptions
include estimating the volatility of our common stock price over the expected life of the options, dividend yield, an appropriate risk-free
interest rate and the number of options that will ultimately not complete their vesting requirements. Changes in the subjective assumptions
can materially affect the estimated fair value of stock-based compensation and consequently, the related amount recognized on the Statements
of Operations.
Results
of Operations
Year
Ended December 31, 2024 Compared to Year Ended December 31, 2023
Oil
and Gas Revenues. Total oil and gas revenues decreased 30% to $560,180 to in 2024 from $794,027 in 2023.
The
decrease in revenues was attributable to (i) declines in oil production, down 18%, and gas production, down 11% from 2023 levels; and
(ii) declines in average sales price of natural gas, down 99% from 2023 levels.
The
following table sets forth the gross and net producing wells, net oil, natural gas liquids, and gas production volumes and average hydrocarbon sales prices
for 2024 and 2023 (excluding information pertaining to Hupecol Meta):
| | |
2024 | | |
2023 | |
| Gross producing wells | |
| 4 | | |
| 4 | |
| Net producing wells | |
| 0.68 | | |
| 0.68 | |
| Net oil production (Bbls) | |
| 5,992 | | |
| 7,971 | |
| Net gas production (Mcf) | |
| 53,476 | | |
| 57,360 | |
| Net natural gas liquids production (Gallons) | |
| 159,680 | | |
| 179,506 | |
| Oil—Average sales price per barrel | |
$ | 73.08 | | |
$ | 74.08 | |
| Gas—Average sales price per mcf | |
$ | 0.17 | | |
$ | 1.38 | |
| Natural gas liquids—Average sales price per gallon | |
$ | 0.71 | | |
$ | 0.69 | |
The
change in production volumes reflects natural production declines. The change in average oil and natural gas prices realized reflects
movements in global energy prices.
All
oil and gas sales revenues for 2024 and 2023, by region (excluding information pertaining to Hupecol Meta), were as follows:
| | |
Colombia | | |
U.S. | | |
Total | |
| 2024 | |
| | |
| | |
| |
| Oil
sales | |
$ | — | | |
$ | 473,900 | | |
$ | 473,900 | |
| Gas sales | |
$ | — | | |
$ | 8,869 | | |
$ | 8,869 | |
| Gas Liquids
sales | |
$ | — | | |
$ | 113,411 | | |
$ | 113,411 | |
| 2023 | |
| | | |
| | | |
| | |
| Oil sales | |
$ | — | | |
$ | 590,486 | | |
$ | 590,586 | |
| Gas sales | |
$ | — | | |
$ | 79,443 | | |
$ | 79,443 | |
| Gas
Liquids sales | |
$ | — | | |
$ | 124,098 | | |
$ | 124,098 | |
Lease
Operating Expenses. Lease operating expenses, excluding expenses attributable to our cost method investment in Colombia, increased
24% to $747,559 in 2024 from $473,925 in 2023.
Lease
operating expense, by region, for 2024 and 2023 (excluding information pertaining to Hupecol Meta), were as follows:
| | |
Colombia
| | |
U.S. | | |
Total
| |
| 2024 | |
$ | — | | |
$ | 747,559 | | |
$ | 747,559 | |
| 2023 | |
$ | — | | |
$ | 473,925 | | |
$ | 473,925 | |
The
change in lease operating expenses was principally attributable to the increased expenses in production during 2024 and approximately
$125,000 related to the six new wells in development.
Depreciation
and Depletion Expense. Depreciation and depletion expense decreased by 5% to $160,001 in 2024 from $167,527 in 2023. The decrease
in depreciation and depletion during 2024 was attributable to the increase in the depletion rate during 2024 due to the naturally occurring
reduction in reserves which is used in the calculation. .
Impairment
Expense and Loss on Disposal of Oil and Gas Properties. During 2024, we realized an impairment expense
of $6,392,874 on our investment in Hupecol Meta attributable to indications that its earnings performance has deteriorated, and the investment
is no longer viewed as viable. An additional $275,760 impairment on the US properties was realized in 2024, attributable to declines in
energy prices and production relating to our Reeves County properties, partially offset by the addition of our proved non-producing properties
. The loss on disposal of oil and gas properties in 2023 for 2,343,126 was
attributable to the release of our interest in properties in Colombia.
General
and Administrative Expenses (Excluding Stock-Based Compensation). General and administrative expense increased by 32% to $2,123,051 in 2024
from $1,614,245 in 2023. The change in general and administrative expense was primarily attributable to the payment to our former CEO
to terminate his change of control agreement with the Company.
Stock-Based
Compensation. Stock-based compensation decreased to $101,508 in 2024 from $238,314 in 2023. The decrease was attributable to a lower
fair value of newly issued options compared to the prior period.
Other
Income. Other income totaled $ 1,024,461 in 2024 compared to $1,369,518 in 2023. Other income consisted of (i) equity investment
distributions from Hupecol Metal totaling $922,719 during 2024 compared to $1,220,954; and (ii) interest earned on cash balances, totaling
$101,742 in 2024 and $148,565 in 2023.
Distributions
from Hupecol Meta reflect, generally, our share of distributable net income of Hupecol Meta. Distributions should not be viewed as a
measure of actual operating results of Hupecol Meta for the period of such distributions or any other periods. Distributions merely reflect
determinations by the managers of Hupecol Meta to make distributions in accordance with contractual rights of the various members of
Hupecol Meta within the discretion of the managers as permitted under the contracts governing Hupecol Meta. We report distributions from
Hupecol Meta as “Other Income” to the extent that the character of the distributions is in the nature of income and not a
return of capital. The distributions received during 2024 are, generally, attributable to operations of Hupecol Meta’s initial
wells, the Saturno ST1 vertical well, the Venus 2A vertical well, a legacy well that had been shut-in, the Venus 1-H well, Hupecol Meta’s
first horizontal well, which began production in May 2023, and the Venue 2-H ST1 well, which began production in August 2023.
The
decrease in interest income from 2023 to 2024 was attributable to the decrease in our cash balances during 2024.
Financial
Condition
Liquidity
and Capital Resources. At December 31, 2024, we had a cash balance of $2,960,151 and working capital of $3,072,783, compared to a
cash balance of $4,059,182 and working capital of $3,917,231 at December 31, 2023.
Cash
Flows. Operating activities used cash of $1,536,515 during 2024, compared to $263,191
used during 2023. The change in cash flows from operating activities was attributable to the $800,000 payment to our former CEO.
Investing activities used cash of $1,887,516 during 2024, compared to $2,403,219
used during 2023. The decrease in cash used in investing activities is attributable to the reduced activities in Hupecol Meta to
fund our share of costs associated with commencement of Hupecol Meta’s drilling program on the CPO-11 block.
Financing activities provided cash of $2,325,000 during 2024, compared to
$1,652,000 provided during 2023. Cash provided by financing activities in 2024 was due to our private placement, in which we received
aggregate net proceeds of $2,325,000. Cash provided by financing activities in 2023 was attributable to funds received from the sale of
common stock under our 2022 ATM Offering.
Long-Term
Liabilities. At December 31, 2024, we had long-term liabilities of $57,180, compared to $134,167 at December 31, 2023. Long-term
liabilities, as of December 31, 2024, consisted of a reserve for plugging costs of $57,180.
Capital
and Exploration Expenditures and Commitments. Our principal capital and exploration expenditures relate to ongoing efforts to acquire,
drill and complete prospects. During 2023, capital expenditures relating to Hupecol Meta increased with our investments in Hupecol Meta
to fund our share of costs associated with the initial wells drilled on the CPO-11 block. We believe that we have the ability, through
our cash on-hand, to fund operations during 2024 and for the twelve months following the issuance of these financial statements.
| Item
7A. |
Quantitative and Qualitative Disclosures About Market Risk |
Commodity
Price Risk
The
price we receive for our oil and gas production heavily influences our revenue, profitability, access to capital and future rate of growth.
Crude oil and natural gas are commodities and, therefore, their prices are subject to wide fluctuations in response to relatively minor
changes in supply and demand. Historically, the markets for oil and gas have been volatile, and these markets will likely continue to
be volatile in the future. The prices we receive for production depends on numerous factors beyond our control.
We
have not historically entered into any hedges or other derivative commodity instruments or transactions designed to manage, or limit
exposure to oil and gas price volatility.
| Item
8. |
Financial Statements and Supplementary Data |
Our
financial statements appear immediately after the signature page of this report. See “Index to Financial Statements” on page
F-1.
| Item
9. |
Changes in and Disagreements with Accountants on Accounting
and Financial Disclosure |
Not
applicable.
| Item
9A. |
Controls and Procedures |
Disclosure
Controls and Procedures
Under
the supervision and with the participation of our management, including our principal executive who also serves as our principal financial
officer, we conducted an evaluation as of December 31, 2024 of the effectiveness of the design and operation of our disclosure controls
and procedures, as such term is defined under Rule 13a-15(e) promulgated under the Securities Exchange Act of 1934, as amended. Based
on this evaluation, our principal executive officer concluded that our disclosure controls and procedures were not effective as of December
31, 2024.
Management’s
Annual Report on Internal Control Over Financial Reporting
Our management is responsible for establishing and maintaining adequate
internal control over financial reporting, as such term is defined in Rules 13a-15(f) and 15d-15(f) under the Securities Exchange
Act of 1934. Under the supervision and with the participation of management, including our principal executive officer, we conducted an
evaluation of the effectiveness of our internal control over financial reporting based on the 2013 framework in Internal Control —
Integrated Framework issued by the Committee of Sponsoring Organizations of the Treadway Commission (the “COSO Framework”).
Based on this evaluation under the COSO Framework, management concluded that our internal control over financial reporting was not effective
as of December 31, 2024. Such conclusion reflects our chief executive officer’s assumption of duties of the principal financial
officer and the resulting lack of an appropriate level of accounting knowledge and experience commensurate with the financial reporting
requirements for a public company, in particular with respect to technical accounting knowledge regarding accounting for certain transactions,
including reserve inputs, asset retirement obligations, calculation of depreciation, depletion, and amortization, and the full cost ceiling
test, and a related lack of segregation of duties. Until we are able to remedy these material weaknesses, we are relying on third party
consultants to assist.
This
annual report does not include an attestation report of our registered public accounting firm regarding internal control over financial
reporting. Management’s report was not subject to attestation by our registered public accounting firm pursuant to rules of the
Securities and Exchange Commission that permit smaller reporting companies to provide only management’s report in this annual report.
Changes
in Internal Control Over Financial Reporting
There
was no change in our internal control over financial reporting during the fourth quarter of 2024 that has materially affected, or is
reasonably likely to materially affect, our internal control over financial reporting.
| Item
9B. |
Other Information |
Not
applicable
| Item
9C. |
Disclosure Regarding Foreign Jurisdictions that Prevent
Inspections |
Not
applicable
PART
III
| Item
10. |
Directors, Executive Officers and Corporate Governance |
The
information required by this Item will be included in a definitive proxy statement, pursuant to Regulation 14A, to be filed not later
than 120 days after the close of our fiscal year. Such information is incorporated herein by reference.
Executive
Officers
Our
executive officers as of December 31, 2024, and their ages and positions as of that date, are as follows:
Name
|
|
Age
|
|
Position
|
| Peter
Longo |
|
65 |
|
President, Chief Executive Officer, and CFO |
Peter Longo has served as our President and CEO, and as a director, since
November 2024, and principal financial officer since February 2025. Mr. Longo retired from United Technologies Corporation (UTC) in 1988 and has since been serving as the Chairman of Cyient,
Inc. the U.S. subsidiary of Cyient, Ltd., a leading management services provider in engineering, manufacturing, geospatial, network, and
operations management services to multi-national companies. Mr. Longo was employed at UTC since 1988. From 2016 to 2018, Mr. Longo served
as SVP of Operations for UTC from prior to its merger with Raytheon Corporation (RTX). During his 30 years with UTC, Mr. Longo served
as CFO and CIO at several of UTC’s business units. Neither Cyient nor RTX is affiliated with the Company. Mr. Longo has a bachelor
in accountancy degree from Bentley University and is a Certified Public Accountant (CPA) since 1981.
There
are no family relationships among the executive officers and directors. Except as otherwise provided in employment agreements, each of
the executive officers serves at the discretion of the Board.
| Item
11. |
Executive Compensation |
The
information required by this Item will be included in a definitive proxy statement, pursuant to Regulation 14A, to be filed not later
than 120 days after the close of our fiscal year. Such information is incorporated herein by reference.
| Item
12. |
Security Ownership of Certain Beneficial Owners and Management
and Related Stockholder Matters |
The
information required by this Item will be included in a definitive proxy statement, pursuant to Regulation 14A, to be filed not later
than 120 days after the close of our fiscal year. Such information is incorporated herein by reference.
Equity
compensation plan information is set forth in Part II, Item 5 of this Form 10-K.
| Item
13. |
Certain Relationships and Related Transactions, and Director
Independence |
The
information required by this Item will be included in a definitive proxy statement, pursuant to Regulation 14A, to be filed not later
than 120 days after the close of our fiscal year. Such information is incorporated herein by reference.
| Item
14. |
Principal Accountant Fees and Services |
The
information required by this Item will be included in a definitive proxy statement, pursuant to Regulation 14A, to be filed not later
than 120 days after the close of our fiscal year. Such information is incorporated herein by reference.
PART
IV
| Item
15. |
Exhibits and Financial Statement Schedules |
1.
Financial statements. See “Index to Financial Statements” on page F-1.
2.
Exhibits
| |
|
|
|
Incorporated
by Reference
|
|
|
Exhibit
Number
|
|
Exhibit
Description
|
|
Form
|
|
Date
|
|
Number
|
|
Filed
Herewith
|
| 1.1 |
|
At-the-Market Issuance Sales Agreement, dated November 18, 2022, by and between Houston American Energy Corp. and Univest Securities, LLC |
|
8-K |
|
11/18/22 |
|
1.1 |
|
|
| |
|
|
|
|
|
|
|
|
|
|
| 1.2 |
|
Engagement Letter, dated October 26, 2024, by and between Houston American Energy Corp. and Univest Securities LLC |
|
8-K |
|
11/12/24 |
|
10.1 |
|
|
| |
|
|
|
|
|
|
|
|
|
|
| 1.3 |
|
Subscription Agreement, dated November 8, 2024, by and between Houston American Energy Corp. and the purchaser designated on the signature page thereto |
|
8-K |
|
11/12/24 |
|
10.2 |
|
|
| |
|
|
|
|
|
|
|
|
|
|
| 3.1 |
|
Certificate of Incorporation of Houston American Energy Corp. filed April 2, 2001 |
|
S-4 |
|
08/03/01 |
|
3.1 |
|
|
| |
|
|
|
|
|
|
|
|
|
|
| 3.2 |
|
Amended and Restated Bylaws of Houston American Energy Corp. adopted June 26, 2023 |
|
8-K |
|
06/29/23 |
|
3.1 |
|
|
| |
|
|
|
|
|
|
|
|
|
|
| 3.3 |
|
Certificate of Amendment to the Certificate of Incorporation of Houston American Energy Corp. filed September 25, 2001 |
|
S-4A |
|
10/01/01 |
|
3.4 |
|
|
| |
|
|
|
|
|
|
|
|
|
|
| 3.4 |
|
Certificate of Amendment to the Certificate of Incorporation of Houston American Energy Corp. filed July 21, 2020 |
|
8-K |
|
07/17/20 |
|
3.1 |
|
|
| |
|
|
|
|
|
|
|
|
|
|
| 3.5 |
|
Certificate of Amendment to the Certificate of Incorporation of Houston American Energy Corp. filed October 17, 2024 |
|
|
|
|
|
|
|
X |
| |
|
|
|
|
|
|
|
|
|
|
| 4.1 |
|
Text of Common Stock Certificate of Houston American Energy Corp. |
|
S-4 |
|
08/03/01 |
|
4.1 |
|
|
| |
|
|
|
|
|
|
|
|
|
|
| 10.1 |
|
Form of 2019 Warrant |
|
8-K |
|
09/20/19 |
|
10.3 |
|
|
| |
|
|
|
|
|
|
|
|
|
|
| 10.2 |
|
Houston American Energy Corp. 2017 Equity Incentive Plan* |
|
Sch
14A |
|
07/24/17 |
|
Ex
A |
|
|
| |
|
|
|
|
|
|
|
|
|
|
| 10.3 |
|
Houston American Energy Corp. 2021 Equity Incentive Plan* |
|
Sch
14A |
|
04/28/21 |
|
Ex
B |
|
|
| * |
Compensatory plan or arrangement. |
| Item 16. |
Form 10-K Summary |
Not
applicable
SIGNATURES
Pursuant
to the requirements of Section 13 or 15(d) of the Securities Exchange Act of 1934, the registrant has duly caused this report to be signed
on its behalf by the undersigned, thereunto duly authorized.
| |
HOUSTON
AMERICAN ENERGY CORP. |
| Dated:
February 21, 2025 |
|
|
| |
|
|
| |
By: |
/s/ Peter Longo |
| |
|
Peter Longo |
| |
|
Chief Executive Officer |
Pursuant
to the requirements of the Securities Exchange Act of 1934, this report has been signed below by the following persons on behalf of the
registrant and in the capacities and on the dates indicated.
Signature
|
|
Title
|
|
Date
|
| |
|
|
|
|
/s/
Peter Longo
|
|
Chief
Executive Officer, President and Director |
|
February
21, 2025 |
| Peter
Longo |
|
(Principal
Executive Officer and Principal Financial Officer) |
|
|
| |
|
|
|
|
/s/
Robert J. Bailey
|
|
Director |
|
February
21, 2025 |
| Robert
J. Bailey |
|
|
|
|
| |
|
|
|
|
/s/
Stephen Hartzell
|
|
Director |
|
February
21, 2025 |
| Stephen
Hartzell |
|
|
|
|
| |
|
|
|
|
| /s/
Keith Grimes |
|
Director |
|
February
21, 2025 |
| Keith
Grimes |
|
|
|
|
HOUSTON
AMERICAN ENERGY CORP.
INDEX
TO FINANCIAL STATEMENTS
REPORT
OF INDEPENDENT REGISTERED PUBLIC ACCOUNTING FIRM
To
the Shareholders and Board of Directors of
Houston
American Energy Corp.
Opinion
on the Financial Statements
We
have audited the accompanying consolidated balance sheets of Houston American Energy Corp. (the “Company”) as of December
31, 2024 and 2023, the related consolidated statements of operations, stockholders’ equity and cash flows for each of the years
in the period ended December 31, 2024, and the related notes (collectively referred to as the “financial statements”). In
our opinion, the financial statements present fairly, in all material respects, the financial position of the Company as of December
31, 2024 and 2023, and the results of its operations and its cash flows for each of the years in the period ended December 31, 2024,
in conformity with accounting principles generally accepted in the United States of America.
Basis
for Opinion
These
financial statements are the responsibility of the Company’s management. Our responsibility is to express an opinion on the Company’s
financial statements based on our audits. We are a public accounting firm registered with the Public Company Accounting Oversight Board
(United States) (“PCAOB”) and are required to be independent with respect to the Company in accordance with the U.S. federal
securities laws and the applicable rules and regulations of the Securities and Exchange Commission and the PCAOB.
We
conducted our audits in accordance with the standards of the PCAOB. Those standards require that we plan and perform the audits to obtain
reasonable assurance about whether the financial statements are free of material misstatement, whether due to error or fraud. The Company
is not required to have, nor were we engaged to perform, an audit of its internal control over financial reporting. As part of our audits
we are required to obtain an understanding of internal control over financial reporting but not for the purpose of expressing an opinion
on the effectiveness of the Company’s internal control over financial reporting. Accordingly, we express no such opinion.
Our
audits included performing procedures to assess the risks of material misstatement of the financial statements, whether due to error
or fraud, and performing procedures that respond to those risks. Such procedures included examining, on a test basis, evidence regarding
the amounts and disclosures in the financial statements. Our audits also included evaluating the accounting principles used and significant
estimates made by management, as well as evaluating the overall presentation of the financial statements. We believe that our audits
provide a reasonable basis for our opinion.
Critical
Audit Matters
The
critical audit matters communicated below are matters arising from the current period audit of the financial statements that were communicated
or required to be communicated to the audit committee and that: (1) relate to accounts or disclosures that are material to the financial
statements and (2) involved our especially challenging, subjective, or complex judgments. The communication of critical audit matters
does not alter in any way our opinion on the financial statements, taken as a whole, and we are not, by communicating the critical audit
matters below, providing separate opinions on the critical audit matters or on the accounts or disclosures to which they relate.
The
Impact of Proved Oil and Natural Gas Liquids Reserves on Oil and Gas Properties
As
described in Note 3 to the consolidated financial statements, the Company’s consolidated oil and gas properties balance was $1.1
million as of December 31, 2024, and depreciation, depletion and amortization expense for the year ended December 31, 2024 was $0.2 million.
The Company utilizes the full-cost method of accounting for its oil and gas properties. Under this method, all capitalized costs are
amortized over the estimated lives of the properties using the unit-of-production method based on proved oil, gas, and natural gas liquids
(“NGL”) reserves. These capitalized costs are subject to a ceiling test that limits such pooled costs, net of applicable
deferred taxes, to the aggregate of the present value of future net revenues attributable to proved oil, gas, and NGL reserves discounted
at 10%. For the year ended December 31, 2024, pre-tax impairment charges of $0.3 million were recognized. As disclosed by management,
proved oil, gas, and NGL reserves are a major component of the full cost ceiling test. Estimates of reserves require extensive judgments
of available reservoir geologic, geophysical and engineering data as well as certain economic assumptions such as commodity pricing and
the costs that will be incurred in developing and producing reserves. The estimates of oil, gas, and NGL reserves have been developed
by a specialist, specifically a reservoir engineer (the “specialist”).
The
principal considerations for our determination that performing procedures relating to the impact of proved oil and NGL reserves on oil
and gas properties, is a critical audit matter are (i) the significant judgment by management, including the use of management’s
specialist, when developing the estimate of proved oil and NGL reserves and (ii) a high degree of auditor judgment, subjectivity, and
effort in performing procedures and evaluating audit evidence related to the data, methods, and assumptions used by management and its
specialist in developing the estimates of proved oil and NGL reserves applied to the full cost ceiling test.
Addressing
the matter involved performing procedures and evaluating audit evidence in connection with forming our overall opinion on the consolidated
financial statements. These procedures included testing the depreciation, depletion and amortization and full cost ceiling test calculations.
The work of management’s specialist was used in performing the procedures to evaluate the reasonableness of the estimates of proved
oil and NGL reserves applied in the full cost ceiling test. As a basis for using this work, specialist’s qualifications were understood
and the Company’s relationship with the specialist was assessed. These procedures also included evaluating of the methods and assumptions
used by the specialist, testing of the completeness and accuracy of the data related to commodity pricing and historical production used by the specialist, and evaluating the specialist’s findings.
/s/
Marcum llp
Marcum
LLP
We
have served as the Company’s auditor since 2010.
Houston,
Texas
February
21, 2025
HOUSTON
AMERICAN ENERGY CORP.
CONSOLIDATED
BALANCE SHEETS
| | |
| | | |
| | |
| | |
December 31, | |
| | |
2024 | | |
2023 | |
| ASSETS | |
| | | |
| | |
| CURRENT ASSETS | |
| | | |
| | |
| Cash | |
| 2,960,151 | | |
$ | 4,059,182 | |
| Accounts receivable – oil and gas sales | |
| 75,074 | | |
| 71,736 | |
| Prepaid expenses and other current assets | |
| 175,866 | | |
| 35,244 | |
| TOTAL CURRENT ASSETS | |
| 3,211,091 | | |
| 4,166,162 | |
| | |
| | | |
| | |
| PROPERTY AND EQUIPMENT | |
| | | |
| | |
| Oil and gas properties, full cost method | |
| | | |
| | |
| Costs subject to amortization | |
| 62,770,657 | | |
| 62,776,561 | |
| Costs not being amortized | |
| — | | |
| — | |
| Office equipment | |
| 90,004 | | |
| 90,004 | |
| Total | |
| 62,860,661 | | |
| 62,866,565 | |
| Accumulated depletion, depreciation, amortization, and impairment | |
| (61,743,025 | ) | |
| (61,307,264 | ) |
| | |
| | | |
| | |
| PROPERTY AND EQUIPMENT, NET | |
| 1,117,636 | | |
| 1,559,301 | |
| | |
| | | |
| | |
| Equity investment – Hupecol Meta LLC | |
| — | | |
| 4,505,358 | |
| Right of use asset | |
| 69,901 | | |
| 145,021 | |
| Other assets | |
| 3,167 | | |
| 3,167 | |
| TOTAL ASSETS | |
| 4,401,795 | | |
$ | 10,379,009 | |
| | |
| | | |
| | |
| LIABILITIES AND SHAREHOLDERS’ EQUITY | |
| | | |
| | |
| CURRENT LIABILITIES | |
| | | |
| | |
| Accounts payable | |
| 49,542 | | |
$ | 156,572 | |
| Accrued expenses | |
| 17,684 | | |
| 17,083 | |
| Short-term lease liability | |
| 71,082 | | |
| 75,276 | |
| TOTAL CURRENT LIABILITIES | |
| 138,308 | | |
| 248,931 | |
| | |
| | | |
| | |
| LONG-TERM LIABILITIES | |
| | | |
| | |
| Lease liability, net of current portion | |
| — | | |
| 71,083 | |
| Reserve for plugging and abandonment costs | |
| 57,180 | | |
| 63,084 | |
| TOTAL LONG-TERM LIABILITIES | |
| 57,180 | | |
| 134,167 | |
| TOTAL LIABILITIES | |
| 195,488 | | |
| 383,098 | |
| | |
| | | |
| | |
| COMMITMENTS AND CONTINGENCIES | |
| - | | |
| | |
| | |
| | | |
| | |
| SHAREHOLDERS’ EQUITY | |
| | | |
| | |
| Common stock, par value $0.001; 20,000,000 shares authorized 13,086,533 and 10,906,353 shares issued
and outstanding | |
| 13,087 | | |
| 10,907 | |
| Additional paid-in capital | |
| 89,408,329 | | |
| 86,984,001 | |
| Accumulated deficit | |
| (85,215,109 | ) | |
| (76,998,997 | ) |
| TOTAL SHAREHOLDERS’ EQUITY | |
| 4,206,307 | | |
| 9,995,911 | |
| TOTAL LIABILITIES AND SHAREHOLDERS’ EQUITY | |
| 4,401,795 | | |
$ | 10,379,009 | |
The
accompanying notes are an integral part of these consolidated financial statements.
HOUSTON
AMERICAN ENERGY CORP.
CONSOLIDATED
STATEMENTS OF OPERATIONS
FOR
THE YEARS ENDED DECEMBER 31, 2024 AND 2023
| | |
2024 | | |
2023 | |
| REVENUES | |
| | | |
| | |
| Oil and gas revenue | |
| 560,180 | | |
$ | 794,027 | |
| Total operating revenue | |
| 560,180 | | |
| 794,027 | |
| | |
| | | |
| | |
| EXPENSES OF OPERATIONS | |
| | | |
| | |
| Lease operating expense and severance tax | |
| 747,559 | | |
| 473,925 | |
| General and administrative expense | |
| 2,224,559 | | |
| 1,852,559 | |
| Depreciation and depletion | |
| 160,001 | | |
| 167,527 | |
| Loss on disposal of oil and gas properties – Colombia | |
| — | | |
| 2,343,126 | |
| Impairment expense – oil and gas properties | |
| 275,760 | | |
| 537,686 | |
| Impairment expense – equity investment in Hupecol Meta
LLC | |
| 6,392,874 | | |
| — | |
| Total operating expenses | |
| 9,800,753 | | |
| 5,374,823 | |
| | |
| | | |
| | |
| Loss from operations | |
| (9,240,573 | ) | |
| (4,580,796 | ) |
| | |
| | | |
| | |
| OTHER INCOME | |
| | | |
| | |
| Interest income | |
| 101,742 | | |
| 148,565 | |
| Other income | |
| 922,719 | | |
| 1,220,954 | |
| Total other income | |
| 1,024,461 | | |
| 1,369,519 | |
| | |
| | | |
| | |
| | |
| | | |
| | |
| Income tax expense (benefit) | |
| — | | |
| — | |
| Net loss | |
| (8,216,112 | ) | |
$ | (3,211,277 | ) |
| Basic net loss per common share outstanding | |
$ | (0.73 | ) | |
$ | (0.30 | ) |
| Diluted net loss per common share outstanding | |
$ | (0.73 | ) | |
$ | (0.30 | ) |
| Basic weighted average number of common shares outstanding | |
| 11,288,019 | | |
| 10,783,731 | |
| Diluted weighted average number of common shares outstanding | |
| 11,288,019 | | |
| 10,783,731 | |
The
accompanying notes are an integral part of these consolidated financial statements.
HOUSTON
AMERICAN ENERGY CORP.
CONSOLIDATED
STATEMENT OF CHANGES IN SHAREHOLDERS’ EQUITY
FOR
THE YEARS ENDED DECEMBER 31, 2024 and 2023
| | |
Shares | | |
Amount | | |
Capital | | |
Deficit | | |
Total | |
| | |
Common Stock | | |
Additional | | |
Accumulated | | |
| |
| | |
Shares | | |
Amount | | |
Paid-in Capital | | |
Deficit | | |
Total | |
| | |
| | |
| | |
| | |
| | |
| |
| Balance – December 31, 2022 | |
| 10,327,646 | | |
$ | 10,328 | | |
$ | 85,094,266 | | |
$ | (73,787,720 | ) | |
$ | 11,316,874 | |
| | |
| | | |
| | | |
| | | |
| | | |
| | |
| Issuance of common stock for cash, net | |
| 578,707 | | |
| 579 | | |
| 1,651,421 | | |
| — | | |
| 1,652,000 | |
| Stock-based compensation | |
| — | | |
| — | | |
| 238,314 | | |
| — | | |
| 238,314 | |
| Net loss | |
| — | | |
| — | | |
| — | | |
| (3,211,277 | ) | |
| (3,211,277 | ) |
| Balance – December 31, 2023 | |
| 10,906,353 | | |
| 10,907 | | |
| 86,984,001 | | |
| (76,998,997 | ) | |
| 9,995,911 | |
| Balance | |
| 10,906,353 | | |
| 10,907 | | |
| 86,984,001 | | |
| (76,998,997 | ) | |
| 9,995,911 | |
| | |
| | | |
| | | |
| | | |
| | | |
| | |
| Issuance of common stock for cash, net | |
| 2,180,180 | | |
| 2,180 | | |
| 2,322,820 | | |
| — | | |
| 2,325,000 | |
| Stock-based compensation | |
| — | | |
| — | | |
| 101,508 | | |
| — | | |
| 101,508 | |
| Net loss | |
| — | | |
| — | | |
| — | | |
| (8,216,112 | ) | |
| (8,216,112 | ) |
| Balance – December 31, 2024 | |
| 13,086,533 | | |
$ | 13,087 | | |
$ | 89,408,329 | | |
$ | (85,215,109 | ) | |
$ | 4,206,307 | |
| Balance | |
| 13,086,533 | | |
$ | 13,087 | | |
$ | 89,408,329 | | |
$ | (85,215,109 | ) | |
$ | 4,206,307 | |
The
accompanying notes are an integral part of these consolidated financial statements.
HOUSTON AMERICAN ENERGY CORP.
CONSOLIDATED
STATEMENTS OF CASH FLOWS
FOR
THE YEARS ENDED DECEMBER 31, 2024 AND 2023
| | |
2024 | | |
2023 | |
| CASH FLOW FROM OPERATING ACTIVITIES | |
| | | |
| | |
| Net loss | |
$ | (8,216,112 | ) | |
$ | (3,211,277 | ) |
| | |
| | | |
| | |
| Adjustments to reconcile net loss to net cash used in operations | |
| | | |
| | |
| Depreciation and depletion | |
| 160,001 | | |
| 167,527 | |
| Impairment of oil and gas properties | |
| 275,760 | | |
| 537,686 | |
| Impairment of equity investment – Hupecol Meta LLC | |
| 6,392,874 | | |
| — | |
| Loss on disposal of oil and gas properties – Colombia | |
| — | | |
| 2,343,126 | |
| Accretion of plugging and abandonment costs | |
| — | | |
| 2,707 | |
| Stock-based compensation | |
| 101,508 | | |
| 238,314 | |
| Amortization of right of use asset | |
| 75,120 | | |
| 67,181 | |
| Change in operating assets and liabilities: | |
| | | |
| | |
| (Increase)/Decrease in accounts receivable | |
| (3,338 | ) | |
| 92,839 | |
| Decrease in accrued earning distributions from Hupecol Meta, LLC | |
| — | | |
| 17,358 | |
| (Increase)/Decrease in prepaid expense and other current assets | |
| (140,622 | ) | |
| 31,942 | |
| (Decrease)/Increase in accounts payable and accrued expenses | |
| (106,429 | ) | |
| 41,174 | |
| Decrease in operating lease liability | |
| (75,277 | ) | |
| (65,385 | ) |
| Net cash (used in) provided by operating activities | |
| (1,536,515 | ) | |
| 263,191 | |
| | |
| | | |
| | |
| CASH FLOW FROM INVESTING ACTIVITIES | |
| | | |
| | |
| Payments for capital contribution for equity investment | |
| (1,887,516 | ) | |
| (2,403,219 | ) |
| Net cash used in investing activities | |
| (1,887,516 | ) | |
| (2,403,219 | ) |
| | |
| | | |
| | |
| CASH FLOW FROM FINANCING ACTIVITIES | |
| | | |
| | |
| | |
| | | |
| | |
| Proceeds from issuance of common stock for cash, net of offering costs | |
| 2,325,000 | | |
| 1,652,000 | |
| Net cash provided by financing activities | |
| 2,325,000 | | |
| 1,652,000 | |
| | |
| | | |
| | |
| (DECREASE)/INCREASE IN CASH | |
| (1,099,031 | ) | |
| (488,028 | ) |
| Cash, beginning of year | |
| 4,059,182 | | |
| 4,547,210 | |
| Cash, end of year | |
$ | 2,960,151 | | |
$ | 4,059,182 | |
| | |
| | | |
| | |
| SUPPLEMENTAL CASH FLOW INFORMATION: | |
| | | |
| | |
| Interest paid | |
$ | — | | |
$ | — | |
| Taxes paid | |
$ | — | | |
$ | — | |
| | |
| | | |
| | |
| SUPPLEMENTAL NON-CASH INVESTING AND FINANCING ACTIVITIES | |
| | | |
| | |
| Change in estimate of asset retirement obligations, net | |
$ | 5,904 | | |
$ | 9,706 | |
The
accompanying notes are an integral part of these consolidated financial statements.
HOUSTON
AMERICAN ENERGY CORP.
NOTES
TO CONSOLIDATED FINANCIAL STATEMENTS
NOTE
1—NATURE OF COMPANY AND SUMMARY OF SIGNIFICANT ACCOUNTING POLICIES
General
Houston
American Energy Corp. (a Delaware corporation) (“the Company” or “HUSA”) was incorporated in 2001. The Company
is engaged, as a non-operating joint owner, in the exploration, development, and production of natural gas, crude oil, and condensate
from properties. The Company’s principal properties are in the Texas Permian Basin and international holdings in Colombia, South
America, with additional holdings in Gulf Coast areas of the United States.
Consolidation
The
accompanying consolidated financial statements include all accounts of HUSA and its subsidiary (HAEC Louisiana E&P, Inc.). All significant inter-company balances and transactions have been eliminated
in consolidation.
Liquidity
and Capital Requirements
The
accompanying consolidated financial statements have been prepared assuming that the Company will continue as a going concern, which contemplates
the realization of assets and the satisfaction of liabilities in the normal course of business for the twelve-month period following
the issuance date of these consolidated financial statements. With limited exceptions, the Company has incurred continuing losses since
2011, with an accumulated deficit of $85.2 million as of December 31, 2024.
The
Company believes that it has the ability to fund, from cash on hand, its operating costs and anticipated drilling operations for at least
the next twelve months following the issuance of these financial statements.
The
actual timing and number of wells drilled during 2025 and beyond will be principally controlled by the operators of the Company’s
acreage, based on a number of factors, including but not limited to availability of financing, performance of existing wells on the subject
acreage, energy prices and industry condition and outlook, costs of drilling and completion services and equipment and other factors
beyond the Company’s control or that of its operators.
In
the event that the Company pursues additional acreage acquisitions or expands its drilling plans, the Company may be required to secure
additional funding beyond our resources on hand. While the Company may, among other efforts, seek additional funding from “at-the-market”
sales of common stock, and private sales of equity and debt securities, it presently has limited shares of common stock authorized for
issuance to support sales of such shares and does not have any commitments to provide additional funding, and there can be no assurance
that the Company can secure the necessary capital to fund its share of drilling, acquisition or other costs on acceptable terms or at
all. If, for any reason, the Company is unable to fund its share of drilling and completion costs, it would forego participation in one
or more of such wells. In such event, the Company may be subject to penalties or to the possible loss of some of its rights and interests
in prospects with respect to which it fails to satisfy funding obligations and it may be required to curtail operations and forego opportunities.
General
Principles and Use of Estimates
The
consolidated financial statements have been prepared in conformity with accounting principles generally accepted in the United States
of America. In preparing financial statements, management makes informed judgments and estimates that affect the reported amounts of
assets and liabilities as of the date of the financial statements and affect the reported amounts of revenues and expenses during the
reporting period. On an ongoing basis, management reviews its estimates, including those related to such potential matters as litigation,
environmental liabilities, income taxes, and determination of proved reserves of oil and gas and asset retirement obligations. Changes
in facts and circumstances may result in revised estimates and actual results may differ from these estimates.
Cash
and Cash Equivalents
Cash
and cash equivalents consist of demand deposits and cash investments with initial maturity dates of less than three months when purchased.
As of December 31, 2024 and 2023, the Company had no cash equivalents outstanding.
Concentration
of Credit Risk
Financial
instruments that potentially subject the Company to a concentration of credit risk include cash, cash equivalents and marketable securities
(if any). The Company had cash deposits of $2.5 million in excess of the FDIC’s current insured limit of $250,000 at December 31,
2024 for interest bearing accounts. The Company has not experienced any losses on its deposits of cash and cash equivalents.
Revenue
Recognition
The
Company’s revenue is comprised principally of revenue from exploration and production activities. The Company’s oil is sold
primarily to marketers, gatherers, and refiners. Natural gas is sold primarily to interstate and intrastate natural-gas pipelines, direct
end-users, industrial users, local distribution companies, and natural-gas marketers. Natural gas liquids, or NGLs, are sold primarily
to direct end-users, refiners, and marketers. Payment is generally received from the customer in the month following delivery.
Contracts
with customers have varying terms, including spot sales or month-to-month contracts, contracts with a finite term, and life-of-field
contracts where all production from a well or group of wells is sold to one or more customers. The Company recognizes sales revenues
for oil, natural gas, and NGLs based on the amount of each product sold to a customer when control transfers to the customer. Generally,
control transfers at the time of delivery to the customer at a pipeline interconnect, the tailgate of a processing facility, or as a
tanker lifting is completed. Revenue is measured based on the contract price, which may be index-based or fixed, and may include adjustments
for market differentials and downstream costs incurred by the customer, including gathering, transportation, and fuel costs.
Revenues
are recognized for the sale of the Company’s net share of production volumes.
The Company estimated the December 2024 revenue and related drilling expenses
for two US wells. Using actual oil production results for the month, the Company used historical lease operating expenses and average
price per BBL from prior months to calculate these estimates. No gas or NGL related revenue or expenses are included in the estimate.
Loss
per Share
Basic
loss per share is computed by dividing net loss available to common shareholders by the weighted average common shares outstanding for
the period. Diluted earnings per share reflects the potential dilution that could occur if securities or other contracts to issue common
shares were exercised or converted in common shares that then shared in the earnings of the Company. In periods in which the Company
reports a net loss, dilutive securities are excluded from the calculation of diluted net loss per share amounts as the effect would be
anti-dilutive.
For
the years ended December 31, 2024 and 2023, the following warrants and options to purchase shares of common stock were excluded from
the computation of diluted net loss per share, as the inclusion of such shares would be anti-dilutive:
SCHEDULE OF COMPUTATION OF DILUTED NET LOSS PER SHARE
| | |
Year Ended December 31, | |
| | |
2024 | | |
2023 | |
| Stock warrants | |
| 94,400 | | |
| 94,400 | |
| Stock options | |
| 916,987 | | |
| 1,000,807 | |
| Totals | |
| 1,011,387 | | |
| 1,095,207 | |
Accounts
Receivable
Accounts
receivable – other and escrow receivables have been evaluated for collectability and are recorded at their net realizable values.
Allowance
for Accounts Receivable
The
Company’s ability to collect outstanding receivables is critical to its operating performance and cashflows. Accounts receivable
are stated at an amount management expects to collect from outstanding balances. The Company extends credit in the normal course of business.
The Company regularly reviews outstanding receivables and when the Company determines that a party may not be able to make required payments,
a charge to bad debt expense in the period of determination is made. Though the Company’s bad debts have not historically been
significant, the Company could experience increased bad debt expense should a financial downturn occur. The Company updated its impairment model to utilize a forward-looking current expected credit losses (“CECL”)
model in place of the incurred loss methodology for financial instruments measured at amortized cost, primarily including its accounts
receivable and contract asset. In relation to available-for-sale (“AFS”) debt securities, the guidance eliminates the concept
of “other-than-temporary” impairment, and instead focuses on determining whether any impairment is a result of a credit loss
or other factors. The adoption of ASC 326 did not have a material impact on our unaudited condensed consolidated financial statements
as of the adoption date.
Oil
and Gas Properties
The
Company uses the full cost method of accounting for exploration and development activities as defined by the SEC. Under this method of
accounting, the costs for unsuccessful, as well as successful, exploration and development activities are capitalized as oil and gas
properties. Capitalized costs include lease acquisition, geological and geophysical work, delay rentals, costs of drilling, completing
and equipping the wells and any internal costs that are directly related to acquisition, exploration and development activities but does
not include any costs related to production, general corporate overhead or similar activities. Proceeds from the sale or other disposition
of oil and gas properties are generally treated as a reduction in the capitalized costs of oil and gas properties, unless the impact
of such a reduction would significantly alter the relationship between capitalized costs and proved reserves of oil and natural gas attributable
to a country.
The
Company categorizes its full cost pools as costs subject to amortization and costs not being amortized. The sum of net capitalized costs
subject to amortization, including estimated future development and abandonment costs, are amortized using the unit-of-production method.
Depletion and amortization for oil and gas properties was $160,001 and $167,526 for the years ended December 31, 2024 and 2023, respectively,
and accumulated amortization, depreciation and impairment was $61,743,025 and $61,217,260 at December 31, 2024 and 2023, respectively.
Costs
Excluded
Oil
and gas properties include costs that are excluded from capitalized costs being amortized. These amounts represent costs of investments
in unproved properties. The Company excludes these costs on a country-by-country basis until proved reserves are found or until it is
determined that the costs are impaired. All costs excluded are reviewed quarterly to determine if impairment has occurred. The amount
of any impairment is transferred to the costs subject to amortization.
Ceiling
Test
Under
the full cost method of accounting, a ceiling test is performed each quarter. The full cost ceiling test is an impairment test prescribed
by SEC Regulation S-X. The ceiling test determines a limit, on a country-by-country basis, on the book value of oil and gas properties.
The capitalized costs of proved oil and gas properties, net of accumulated depreciation, depletion, amortization and impairment (“DD&A”)
and the related deferred income taxes, may not exceed the estimated future net cash flows from proved oil and gas reserves, calculated
for 2024 and 2023 using the average oil and natural gas sales price received by the Company as of the first trading day of each month
over the preceding twelve months (such prices are held constant throughout the life of the properties) with consideration of price change
only to the extent provided by contractual arrangement, discounted at 10%, net of related tax effects. If capitalized costs exceed this
limit, the excess is charged to expense and reflected as additional accumulated DD&A. During 2024 and 2023, the Company recorded
impairments of oil and gas properties totaling $275,760 and $537,686, respectively. The impairment reflects the decline in energy prices
and production during 2024.
Furniture
and Equipment
Office
equipment is stated at original cost and is depreciated on the straight-line basis over the useful life of the assets, which ranges from
three to five years.
Office
equipment having an original cost basis of $90,004 was fully depreciated as of January 1, 2020. Therefore, accumulated depreciation was
$90,004 and $90,004 at December 31, 2024 and 2023, respectively.
Equity
Investment Accounted for at Cost
Businesses
not accounted for under either the consolidation method or equity method of accounting are accounted for under equity investments
accounted for at cost and are further discussed in Note 4, “Equity Investments Accounted for at Cost.” The
Company’s share of the earnings and/or losses of equity investments accounted for at cost is not included in the Consolidated
Statements of Operations. Income from equity investments accounted for at cost is only realized if and when distributions are made
from the business to its investors. However, impairment charges related to businesses are recognized in the company’s
Consolidated Statements of Operations. If circumstances suggest that the value of an equity investment accounted for at cost with
respect to which an impairment charge has been made has subsequently recovered, that recovery is not recorded. The carrying values
of the company’s equity investments accounted for at cost are reflected in the line item “Equity investment –
Hupecol Meta, LLC” in the Company’s Consolidated Balance Sheets. As of December
31, 2024, the Company determined it was necessary to take an impairment charge of $6,392,874
for its investment in Hupecol Meta due to indications that its earnings performance has deteriorated, and the investment is no
longer viewed as viable. The Company determined that it is unlikely to receive any substantial amount of proceeds upon the sale of Hupecol
Meta, rendering the value of the investment fully impaired.
Asset
Retirement Obligations
For
the Company, asset retirement obligations (“ARO”) represent the systematic, monthly accretion and depreciation of future
abandonment costs of tangible assets such as platforms, wells, service assets, pipelines, and other facilities. The fair value of a liability
for an asset’s retirement obligation is recorded in the period in which it is incurred if a reasonable estimate of fair value can
be made, and that the corresponding cost is capitalized as part of the carrying amount of the related long-lived asset. The liability
is accreted to its then present value each period, and the capitalized cost is depreciated over the useful life of the related asset.
If the liability is settled for an amount other than the recorded amount, an adjustment is made to the full cost pool, with no gain or
loss recognized, unless the adjustment would significantly alter the relationship between capitalized costs and proved reserves. Although
the Company’s domestic policy with respect to ARO is to assign depleted wells to a salvager for the assumption of abandonment obligations
before the wells have reached their economic limits, the Company has estimated its future ARO obligation with respect to its domestic
operations. The ARO assets, which are carried on the balance sheet as part of the full cost pool, have been included in our amortization
base for the purposes of calculating depreciation, depletion and amortization expense. For the purposes of calculating the ceiling test,
the future cash outflows associated with settling the ARO liability have been included in the computation of the discounted present value
of estimated future net revenues. Asset retirement obligations are classified as Level 3 (unobservable inputs) fair value measurements.
Income
Taxes
Deferred
income taxes are provided on a liability method whereby deferred tax assets and liabilities are established for the difference between
the financial reporting and income tax basis of assets and liabilities as well as operating loss and tax credit carry forwards. Deferred
tax assets are reduced by a valuation allowance when, in the opinion of management, it is more likely than not that some portion or all
of the deferred tax assets will not be realized. Deferred tax assets and liabilities are adjusted for the effects of changes in tax laws
and rates on the date of enactment.
Uncertain
Tax Positions
The
Company evaluates uncertain tax positions to recognize a tax benefit from an uncertain tax position only if it is more likely than not
that the tax position will be sustained on examination by the taxing authorities based on the technical merits of the position. Those
tax positions failing to qualify for initial recognition are recognized in the first interim period in which they meet the more likely
than not standard or are resolved through negotiation or litigation with the taxing authority, or upon expiration of the statute of limitations.
De-recognition of a tax position that was previously recognized occurs when an entity subsequently determines that a tax position no
longer meets the more likely than not threshold of being sustained.
The
Company is subject to ongoing tax exposures, examinations and assessments in various jurisdictions. Accordingly, the Company may incur
additional tax expense based upon the outcomes of such matters, including any interest or penalties. In addition, when applicable, the
Company will adjust tax expense to reflect the Company’s ongoing assessments of such matters, which require judgment and can materially
increase or decrease its effective rate as well as impact operating results. There were no liabilities recorded for uncertain tax positions
at December 31, 2024 and 2023.
Stock-Based
Compensation
The
Company measures the cost of employee services received in exchange for stock and stock options based on the grant date fair value of
the awards. The Company determines the fair value of stock option grants using the Black-Scholes option pricing model. The Company determines
the fair value of shares of non-vested stock based on the last quoted price of our stock on the date of the share grant. The fair value
determined represents the cost for the award and is recognized over the vesting period during which an employee is required to provide
service in exchange for the award. As stock-based compensation expense is recognized based on awards ultimately expected to vest, the
Company reduces the expense for estimated forfeitures based on historical forfeiture rates. Previously recognized compensation costs
may be adjusted to reflect the actual forfeiture rate for the entire award at the end of the vesting period. Excess tax benefits, if
any, are recognized as an addition to paid-in capital.
Concentration
of Risk
As
a non-operator oil and gas exploration and production company, and through its interest in a limited liability company (“Hupecol
Meta”) and concessions operated by Hupecol Meta in the South American country of Colombia, the Company is dependent on the personnel,
management and resources of the operators of its various properties to operate efficiently and effectively.
As
a non-operating joint interest owner, the Company has a right of investment refusal on specific projects and the right to examine and
contest its division of costs and revenues determined by the operator.
The
Company’s Permian Basin, Texas properties accounted for all of the Company’s oil and gas operations and substantially all
of its oil and gas investments reflected in its consolidated financial statements in 2024. In the event of a significant negative change
in operations or operating outlook pertaining to the Company’s Permian Basin properties, the Company may be forced to abandon or
suspend such operations, which abandonment or suspension could be materially harmful to the Company.
For
2024, the Company’s oil production from its mineral interests was sold to U.S. oil marketing companies based on the highest bid.
The gas production is sold to U.S. natural gas marketing companies based on the highest bid. No purchaser accounted for more than 10%
of our oil and gas sales.
The
Company reviews accounts receivable balances when circumstances indicate a balance may not be collectible. Based upon the Company’s
review, no allowance for uncollectible accounts was deemed necessary at December 31, 2024 and 2023, respectively.
Recently
Adopted Accounting Pronouncements
In
June 2016, the Financial Accounting Standards Board (“FASB”) issued ASU No. 2016-13, Financial Instruments – Credit
Losses (Topic 326): Measurement of Credit Losses of Financial Instruments, which was codified in Accounting Standards Codification (“ASC”)
326, Financial Instruments — Credit Losses (“ASC 326”). The standard changes the methodology for measuring credit losses
on financial instruments and the timing of when such losses are recorded. Because the Company is a smaller reporting company based on
the most recent determination as of November 15, 2019, ASC 326 became effective for the Company for fiscal years beginning after December
15, 2022. As such, the Company adopted ASC 326 effective January 1, 2023, utilizing the modified retrospective transition method. Upon
adoption, the Company updated its impairment model to utilize a forward-looking current expected credit losses (“CECL”) model
in place of the incurred loss methodology for financial instruments measured at amortized cost, primarily including its accounts receivable
and contract asset. In relation to available-for-sale (“AFS”) debt securities, the guidance eliminates the concept of “other-than-temporary”
impairment, and instead focuses on determining whether any impairment is a result of a credit loss or other factors.
In accordance with Accounting Standards Updates ASU 2016-13, Financial
Instruments-Credit Losses (Topic 326): Measurement of Credit Losses on Financial Instruments (“ASU 2016-13”),
the Company applies historic loss factors to its receivable portfolio segments that were not expected to be further impacted by current
economic developments, and additional economic conditions factor to portfolio segments anticipated to experience greater losses in the
current economic environment. Additionally, the Company continuously evaluates customers based on risk characteristics, such as historical
losses and current economic conditions. Due to the cyclical nature of the oil and gas industry, the Company often evaluates its customers’
estimated losses on a case-by-case basis. The Company did not record a provision for credit losses during the year ended December 31,
2024 or 2023. The adoption of
ASC 326 did not have a material impact on our unaudited condensed consolidated financial statements as of the adoption date.
In
November 2023, the FASB issued Accounting Standards Update (“ASU”) 2023-07 “Segment Reporting (Topic 280): Improvements
to Reportable Segment Disclosures”. The amendments in this ASU are intended to improve reportable segment disclosure requirements
primarily through enhanced disclosures about significant segment expenses. The Company adopted the update for year-end 2024,
but did not identify a material effect on its consolidated financial statements.
Recently
Issued Accounting Pronouncements
In
December 2023, the FASB issued ASU 2023-09, Income Taxes (Topic 740): Improvements to Income Tax Disclosures, which requires disaggregated
information about a reporting entity’s effective tax rate reconciliation, as well as information related to income taxes paid to
enhance the transparency and decision usefulness of income tax disclosures. This ASU will be effective for the annual period ending December
31, 2025. The Company is currently evaluating the timing and impacts of adoption of this ASU.
Subsequent
Events
The
Company evaluated subsequent events for disclosure from December 31, 2024 through the date the consolidated financial statements were
issued. See Note 12.
NOTE
2—REVENUE FROM CONTRACTS WITH CUSTOMERS
Disaggregation
of Revenue from Contracts with Customers
The
following table disaggregates revenue by significant product type for the years ended December 31, 2024 and 2023:
SCHEDULE OF DISAGGREGATES REVENUE BY SIGNIFICANT PRODUCT
| | |
2024 | | |
2023 | |
| | |
Year Ended December 31, | |
| | |
2024 | | |
2023 | |
| Oil sales | |
$ | 437,900 | | |
$ | 590,486 | |
| Natural gas sales | |
| 8,869 | | |
| 79,443 | |
| Natural gas liquids sales | |
| 113,411 | | |
| 124,098 | |
| Total revenue from customers | |
$ | 560,180 | | |
$ | 794,027 | |
There
were no significant contract liabilities or transaction price allocations to any remaining performance obligations as of December 31,
2024 or 2023.
NOTE
3—OIL AND GAS PROPERTIES
Evaluated
Oil and Gas Properties
Evaluated
oil and gas properties subject to amortization at December 31, 2024 included the following:
SCHEDULE OF EVALUATED OIL AND GAS PROPERTIES SUBJECT TO AMORTIZATION
| | |
United States | | |
South America | | |
Total | |
| | |
| | |
| | |
| |
| Evaluated properties being amortized | |
$ | 13,326,003 | | |
$ | 49,444,654 | | |
$ | 62,770,657 | |
| Accumulated depreciation, depletion, amortization and impairment | |
| (12,208,367 | ) | |
| (49,444,654 | ) | |
| (61,653,021 | ) |
| Net capitalized costs | |
$ | 1,117,636 | | |
$ | — | | |
$ | 1,117,636 | |
Evaluated
oil and gas properties subject to amortization at December 31, 2023 included the following:
| | |
United States | | |
South America | | |
Total | |
| | |
| | |
| | |
| |
| Evaluated properties being amortized | |
$ | 13,321,907 | | |
$ | 49,444,654 | | |
$ | 62,766,561 | |
| Accumulated depreciation, depletion, amortization and impairment | |
| (11,762,288 | ) | |
| (49,444,654 | ) | |
| (61,206,942 | ) |
| Net capitalized costs | |
$ | 1,559,619 | | |
$ | — | | |
$ | 1,559,619 | |
Impairments
During
2024, the Company realized a full cost ceiling test impairment of $275,760.
The impairment of the US assets was attributable to declines in energy prices and production relating to the Company’s Reeves County
properties, partially offset by the addition of the Company’s proved non-producing properties.
NOTE
4—Equity Investment Accounted for at Cost
During
the year ended December 31, 2024, the Company received distributions, totaling $922,719,
from Hupecol Meta representing the Company’s share of distributable net profits. During 2024, the Company invested $1.9
million for required capital contributions related to drilling operations in Colombia to Hupecol Meta.
The
Company’s carrying value of its holdings in Hupecol Meta, was $4.5 million as of December 31, 2023, as reflected in the line item
“Equity investment – Hupecol Meta” in the Company’s consolidated balance sheets.
Impairments
The
Company performs annual business reviews of its equity investments accounted for at cost to determine whether the carrying value in
that investment is impaired. As of December 31, 2024, the Company determined it was necessary
to take an impairment charge of $6,392,874 for its
investment in Hupecol Meta due to indications that its earnings performance has deteriorated, and the investment is no longer viewed
as viable. The Company determined that it is unlikely to receive any substantial amount of proceeds upon the sale of Hupecol Meta, rendering
the value of the investment fully impaired.
NOTE
5—ASSET RETIREMENT OBLIGATIONS
The
following table presents changes in our asset retirement liability (“ARO”) during each of the years ended December 31, 2024
and 2023.
SCHEDULE OF CHANGES IN OUR ASSET RETIREMENT LIABILITY
| | |
2024 | | |
2023 | |
| | |
| | |
| |
| ARO liability at January 1 | |
$ | 63,084 | | |
$ | 72,789 | |
| Additions from new drilling | |
| — | | |
| — | |
| Liabilities settled | |
| — | | |
| (2,706 | ) |
| Changes in estimates | |
| (5,904 | ) | |
| (9,706 | ) |
| Accretion expense | |
| — | | |
| 2,707 | |
| | |
| | | |
| | |
| ARO liability at December 31 | |
$ | 57,180 | | |
$ | 63,084 | |
NOTE
6—STOCK-BASED COMPENSATION
In
2008, the Company adopted the Houston American Energy Corp. 2008 Equity Incentive Plan (the “2008 Plan”). The terms of the
2008 Plan, as amended in 2012 and 2013, allow for the issuance of up to 480,000 shares of the Company’s common stock pursuant to
the grant of stock options and restricted stock.
In
2017, the Company adopted the Houston American Energy Corp. 2017 Equity Incentive Plan (the “2017 Plan”). The terms of the
2017 Plan allow for the issuance of up to 400,000 shares of the Company’s common stock pursuant to the grant of stock options and
restricted stock. Persons eligible to participate in the Plans are key employees, consultants and directors of the Company.
In
2021, the Company adopted the Houston American Energy 2021 Equity Incentive Plan (the “2021 Plan” and, together with the
2008 Plan and the 2017 Plan, the “Plans”). The terms of the 2021 Plan allow for the issuance of up to 500,000 shares of the
Company’s common stock pursuant to the grant of stock options and restricted stock. Persons eligible to participate in the Plans
are key employees, consultants and directors of the Company.
Stock
Option Activity
In
June 2023, options to purchase an aggregate of 60,000 shares of the Company’s common stock were granted to the Company’s
directors. The options have a ten-year life and are exercisable at $2.09 per share, vest 20% on the date of grant and 80% ten months
from the date of grant. The grant date fair value of these stock options was $119,252 based on the Black-Scholes Option Pricing model
based on the following assumptions: market value of common stock on grant date – $2.09; risk free interest rate based on the applicable
US Treasury bill rate – 0%; dividend yield – 0%; volatility factor based on the trading history of the Company – 116%;
weighted average expected life in years – 10; and expected forfeiture rate – 0%.
In
June 2024, options to purchase an aggregate of 60,000 shares of the Company’s common stock were granted to the Company’s
directors. The options have a ten-year life and are exercisable at $1.21 per share, vest 20% on the date of grant and 80% ten months
from the date of grant. The grant date fair value of these stock options was $63,730 based on the Black-Scholes Option Pricing model
based on the following assumptions: market value of common stock on grant date – $1.21; risk free interest rate based on the applicable
US Treasury bill rate – 0%; dividend yield – 0%; volatility factor based on the trading history of the Company – 97.8%;
weighted average expected life in years – 10; and expected forfeiture rate – 0%.
In
November 2024, the Company agreed to issue to its CEO a number of options equal to $15,000
divided by the closing price of our stock on the 15th day of each month. The strike price of each option is equal to the
grant price. The options have a ten-year
life and are exercisable at $0.76
per share for the November 2024 issuances and $0.73
per share for the December 2024 issuances, vest
20% on the date of grant and 80% ten months from the date of grant. The grant date fair value of these stock options was
$14,657
in November 2024, and $13,225
in December 2024, based on the Black-Scholes Option Pricing model based on the following assumptions: market value of common stock
on grant dates – $1.43
and $1.36,
respectively; risk free interest rate based on the applicable US Treasury bill rate – 0%;
dividend yield – 0%;
volatility factor based on the trading history of the Company – 92%;
weighted average expected life in years – 10;
and expected forfeiture rate – 0%.
Option
activity during 2024 and 2023 was as follows:
SUMMARY OF STOCK OPTION ACTIVITY
| | |
Options | | |
Weighted Average Exercise Price | | |
Weighted Average Remaining Contractual
Term (in Years) | | |
Aggregate Intrinsic Value | |
| | |
| | |
| | |
| | |
| |
| Outstanding at December 31, 2022 | |
| 944,177 | | |
$ | 2.08 | | |
| | | |
| | |
| Granted | |
| 60,000 | | |
$ | 2.09 | | |
| | | |
| | |
| Exercised | |
| — | | |
$ | 3.84 | | |
| | | |
| | |
| Forfeited | |
| (3,370 | ) | |
$ | 20.43 | | |
| | | |
| | |
| | |
| | | |
| | | |
| | | |
| | |
| Outstanding at December 31, 2023 | |
| 1,000,807 | | |
| 2.46 | | |
| | | |
| | |
| Granted | |
| 82,320 | | |
| 1.08 | | |
| | | |
| | |
| Exercised | |
| — | | |
| | | |
| | | |
| | |
| Expired | |
| (166,140 | ) | |
| 3.87 | | |
| | | |
| | |
| | |
| | | |
| | | |
| | | |
| | |
| Outstanding at December 31, 2024 | |
| 916,987 | | |
$ | 2.06 | | |
| 6.10 | | |
$ | 16,956 | |
| Exercisable at December 31, 2024 | |
| 851,131 | | |
$ | 2.13 | | |
| 5.86 | | |
$ | 16,956 | |
As
of December 31, 2024, non-vested options granted totaled 65,856 and total unrecognized stock-based compensation expense related to non-vested
stock options was $40,790. The related unrecognized expense is expected to be recognized over a weighted average period of 0.24 years.
The weighted average remaining contractual term of the outstanding options and exercisable options at December 31, 2024 is 6.10 years
and 5.86 years, respectively.
As
of December 31, 2024, there were 87,680 shares of common stock available for issuance pursuant to future stock or option grants under
the Plans.
Stock-Based
Compensation Expense
The
following table reflects stock-based compensation recorded by the Company for 2024 and 2023:
SCHEDULE OF STOCK-BASED COMPENSATION
| | |
2024 | | |
2023 | |
| | |
| | |
| |
| Stock-based compensation expense from stock options and common stock included in general and administrative expense | |
$ | 101,508 | | |
$ | 238,314 | |
| Earnings per share effect of stock-based compensation expense | |
$ | (0.01 | ) | |
$ | (0.02 | ) |
NOTE
7—CAPITAL STOCK
Common
Stock - At-the-Market Offerings
In
November 2022, the Company entered into an At-the-Market Sales Agreement (the “Sales Agreement”) with Univest Securities,
LLC) (“Univest”) pursuant to which the Company could sell (the “2022 ATM Offering”), at its option, up to an
aggregate of $3.5 million in shares of its common stock through Univest, as sales agent.
During
2023, we sold an aggregate of 578,707 shares in connection with the 2022 ATM Offering and received proceeds, net of commissions and expenses,
of $1.7 million.
In
2024, we sold 2,180,180 shares of our common stock in a private placement for net proceeds of $2.3 million.
Warrants
Bridge
Loan Warrants. In September 2019, the Company issued the warrants in conjunction with a bridge loan. The Bridge Loan Warrants
are exercisable, for a period of ten years, expiring September 18, 2029, to purchase an aggregate of 94,400 shares of common stock of
the Company at $2.50 per share. The relative fair value of the warrants was determined on the date of grant at $144,948 using the Black
Scholes option-pricing model with the following parameters: (1) risk free interest rate of 1.80% based on the applicable US Treasury
bill rate; (2) expected life in years of 10.0; (3) expected stock volatility of 82.9% based on the trading history of the Company; and
(4) expected dividend yield of 0%. The relative fair value of the warrants was recorded as debt discount on the Bridge Loan Notes and
was amortized as additional interest expense over the term of the notes.
A
summary of warrant activity and related information for 2024 and 2023 is presented below:
SUMMARY OF WARRANT ACTIVITY
| | |
Warrants | | |
Weighted-Average
Exercise Price | | |
Aggregate
Intrinsic Value | |
| | |
| | |
| | |
| |
| Outstanding at December 31, 2022 | |
| 94,400 | | |
$ | 2.50 | | |
| | |
| Issued | |
| — | | |
| — | | |
| | |
| Exercised | |
| — | | |
| — | | |
| | |
| Expired | |
| — | | |
$ | — | | |
| | |
| Outstanding at December 31, 2023 | |
| 94,400 | | |
$ | 2.50 | | |
| | |
| Issued | |
| — | | |
| — | | |
| | |
| Exercised | |
| — | | |
| — | | |
| | |
| Expired | |
| — | | |
| — | | |
| | |
| Outstanding at December 31, 2024 | |
| 94,400 | | |
$ | 2.50 | | |
$ | — | |
| Exercisable at December 31, 2024 | |
| 94,400 | | |
$ | 2.50 | | |
$ | — | |
NOTE
8—TAXES
The
following table sets forth a reconciliation of the statutory federal income tax for the years ended December 31, 2024 and 2023.
SCHEDULE
OF RECONCILIATION OF STATUTORY FEDERAL INCOME TAX
| | |
2024 | | |
2023 | |
| | |
| | |
| |
| | |
| | | |
| | |
| Income tax expense (benefit) computed at statutory rates | |
$ | (1,725,727 | ) | |
$ | (674,368 | ) |
| Permanent differences, nondeductible expenses | |
| 28 | | |
| 9 | |
| Increase (decrease) in valuation allowance | |
| 1,807,535 | | |
| 710,336 | ) |
| Expiration of options | |
| 32,060 | | |
| — | |
| RTA True-Ups | |
| (227,729 | ) | |
| (10,919 | ) |
| Deferred True-Up | |
| 113,833 | | |
| (25,088 | ) |
| Tax provision | |
$ | — | | |
$ | — | |
| | |
| | | |
| | |
| Total provision | |
| | | |
| | |
| Foreign | |
$ | — | | |
$ | — | |
| Total provision (benefit) | |
$ | — | | |
$ | — | |
At
December 31, 2024 the Company has a federal tax loss carry forward of $12,741,145 and a foreign tax credit carry forward of $18,865,
both of which have been fully reserved. The foreign tax credit will expire in 2025.
The
tax effects of the temporary differences between financial statement income and taxable income are recognized as a deferred tax asset
and liabilities. Significant components of the deferred tax asset and liability as of December 31, 2024 and 2023 are set out below.
SIGNIFICANT
COMPONENTS OF DEFERRED TAX ASSET AND LIABILITY
| | |
2024 | | |
2023 | |
| Non-Current Deferred tax assets: | |
| | | |
| | |
| Net operating loss carry forward | |
| 12,729,620 | | |
$ | 12,355,137 | |
| Foreign tax credit carry forward | |
| 18,865 | | |
| 18,865 | |
| Deferred state tax | |
| — | | |
| — | |
| Stock compensation | |
| 460,368 | | |
| 470,816 | |
| Book in excess of tax depreciation, depletion and capitalization methods on oil and gas properties | |
| 1,497,253 | | |
| 53,720 | |
| Other | |
| — | | |
| — | |
| ASC 842 lease standard – building lease | |
| 248 | | |
| 281 | |
| Pass-through investment | |
| — | | |
| — | |
| Total Non-Current Deferred tax assets | |
| 14,706,354 | | |
| 12,898,819 | |
| Valuation Allowance | |
| (14,706,354 | ) | |
| (12,898,819 | ) |
| Net deferred tax asset | |
| — | | |
$ | — | |
Schedule
of Net Operating Loss Carryforwards
The
Company is currently subject to a three-year statute of limitation for federal tax purposes and, in general, three to four-year
statute of limitation for state tax purposes. State NOL expiration will occur beginning in 2033 and Federal NOL expiration will
begin in 2032. The Company files income tax returns in the U.S. federal jurisdiction, and Texas and Oklahoma state jurisdictions. The Company is currently
subject to a three-year statute of limitation for federal tax purposes and, in general, three to four year statute of limitation for state
tax purposes. The federal tax years open to examination are tax years 2021, 2022, and 2023. The state tax years open to examination are
tax years 2020, 2021, 2022, and 2023.
Under
the Tax Cuts and Jobs Act of 2017, net operating losses incurred for tax years beginning after December 31, 2017 will have no expiration
date but utilization will be limited to 80% of taxable income. For losses generated prior to January 1, 2018, there will be no limitation
on the utilization, but there is an expiration on the carryforward of 20 years for federal tax purposes.
The
provisions were subsequently amended further under the Coronavirus Aid, Relief, and Economic Security Act (“CARES Act”) on
March 27, 2020. The CARES Act amended the net operating loss provisions in the 2017 Tax Cuts and Jobs Act (“TCJA”) and allows
for the carryback of NOL’s arising in the taxable years ending December 31, 2017 and before January 1, 2021, to each of the five
taxable years preceding the taxable year of the loss. Additionally, the 80% limitation related to application of NOL’s towards
current federal taxable income has been removed for taxable years prior to January 1, 2021; thereby allowing 100% of the NOL to be applied
to federal taxable income.
To
the best of the Company’s knowledge, Hupecol Meta has made all requisite filings relative to its operations, including those in
Colombia, and that there are no know or expected tax issues, payments due, or judgments related to Hupecol Meta that would adversely
impact the Company’s cost method investment therein.
NOTE
9—COMMITMENTS AND CONTINGENCIES
Lease
Commitment
The
Company leases office facilities under an operating lease agreement that expires October 31, 2025. During the year ended December 31,
2024, the operating cash outflows related to operating lease liabilities were $87,288 and the expense for the amortization of the right
of use asset for operating leases was $66,741. As of December 31, 2024, the Company’s operating lease had a weighted-average remaining
term of 0.83 years and a weighted average discount rate of 12%. Below is a summary of the Company’s right of use assets and liabilities
as of December 31, 2024:
Right
of use asset
SCHEDULE OF FUTURE PAYMENTS UNDER LEASE AGREEMENT
| Year | |
Amount | |
| 2025 | |
| 75,051 | |
| Thereafter | |
| — | |
| Total future lease payments | |
| 75,051 | |
| Less: imputed interest | |
| (3,969 | ) |
| Present value of future operating lease payments | |
| 71,082 | |
| Less: current portion of operating lease liabilities | |
| 71,082 | |
| Long-term operating lease liability | |
$ | — | |
During
the years ended December 31, 2024 and 2023, the Company recognized operating lease expense of $88,644 and $88,644, respectively, which
is included in general and administrative expenses in the Company’s consolidated statements of operations. The Company does not
have any capital leases or other operating lease commitments.
Legal
Contingencies
The
Company is subject to legal proceedings, claims and liabilities that arise in the ordinary course of its business. The Company accrues
for losses associated with legal claims when such losses are probable and can be reasonably estimated. These accruals are adjusted as
further information develops or circumstances change.
Environmental
Contingencies
The
Company’s oil and natural gas operations are subject to stringent federal, state and local laws and regulations relating to the
release or disposal of materials into the environment or otherwise relating to environmental protection. These laws and regulations may
require the acquisition of a permit before drilling commences, restrict the types, quantities and concentration of substances that can
be released into the environment in connection with drilling and production activities, limit or prohibit drilling activities on certain
lands lying within wilderness, wetlands and other protected areas, and impose substantial liabilities for pollution resulting from our
operations. Failure to comply with these laws and regulations may result in the assessment of administrative, civil and criminal penalties,
incurrence of investigatory or remedial obligations or the imposition of injunctive relief. Changes in environmental laws and regulations
occur frequently, and any changes that result in more stringent or costly waste handling, storage, transport, disposal or cleanup requirements
could require the Company to make significant expenditures to maintain compliance, and may otherwise have a material adverse effect on
its results of operations, competitive position or financial condition as well as the industry in general. Under these environmental
laws and regulations, the Company could be held strictly liable for the removal or remediation of previously released materials or property
contamination regardless of whether the Company was responsible for the release or if its operations were standard in the industry at
the time they were performed. The Company maintains insurance coverage, which it believes is customary in the industry, although the
Company is not fully insured against all environmental risks.
Development
Commitments
During
the ordinary course of oil and gas prospect development, the Company commits to a proportionate share for the cost of acquiring mineral
interests, drilling exploratory or development wells and acquiring seismic and geological information.
Production
Incentive Arrangements and ORRIs
In
conjunction with our efforts to secure oil and gas prospects, financing and services, we have, from time to time, granted overriding
royalty interests (“ORRI”) in various properties and have adopted a Production Incentive Compensation Plan under which grant
interests in pools, which may take the form of ORRIs, to provide additional incentive identify and secure attractive oil and gas properties.
Production
Incentive Compensation Plan. In August 2013, the Company’s compensation committee adopted a Production Incentive Compensation
Plan. The purpose of the Plan is to encourage employees and consultants participating in the Plan to identify and secure for the Company
participation in attractive oil and gas opportunities.
Under
that Plan, the committee may establish one or more Pools and designate employees and consultants to participate in those Pools and designate
prospects and wells, and a defined percentage of the Company’s revenues from those wells, to fund those Pools. Only prospects acquired
on or after establishment of the Plan, and excluding all prospects in Colombia, may be designated to fund a Pool. The maximum percentage
of the Company’s share of revenues from a well that may be designated to fund a Pool is 2% (the “Pool Cap”); provided,
however, that with respect to wells with a net revenue interest to the 8/8 of less than 73%, the Pool Cap with respect to such wells
shall be reduced on a 1-for-1 basis such that no portion of the Company’s revenues from a well may be designated to fund a Pool
if the NRI is 71% or less.
Designated
participants in a Pool will be assigned a specific percentage out of the Company’s revenues assigned to the Pool and will be paid
that percentage of such revenues from all wells designated to such Pool and spud during that participant’s employment or services
with the Company. In no event may the percentage assigned to the Company’s chief executive officer relative to any well within
a Pool exceed one-half of the applicable Pool Cap for that well. Payouts of revenues funded into Pools shall be made to participants
not later than 60 days following year end, subject to the committee’s right to make partial interim payouts. Participants will
continue to receive their percentage share of revenues from wells included in a Pool and spud during the term of their employment or
service so long as revenues continue to be derived by the Company from those wells even after termination of employment or services of
the Participant; provided, however, that a participant’s interest in all Pools shall terminate on the date of termination of employment
or services where such termination is for cause.
In
the event of certain changes in control of the Company, the acquirer or survivor of such transaction must assume all obligations under
the Plan; provided, however, that in lieu of such assumption obligation, the committee may, at its sole discretion, assign overriding
royalty interests in wells to substantially mirror the rights of participants under the Plan. Similarly, the committee may, at any time,
assign overriding royalty interests in wells in settlement of obligations under the Plan.
The
Plan is administered by the Company’s compensation committee which shall consult with the Company’s chief executive officer
relative to Pool participants, prospects, wells and interests assign although the committee will have final and absolute authority to
make all such determinations.
During
2024, no pools were established under the Plan.
The
Company records amounts payable under the plan as a reduction to revenue as revenues are recognized from prospects included in pools
covered by the plan based on the participants’ interest in such prospect revenues and records the same as accounts payable until
such time as such amounts are paid out.
ORRI
Grants. All present and future prospects in Colombia are subject to a 1.5%
ORRI in favor of each of our former Chairman and Chief Executive Officer and a former director.
Payments
made by the Company under the Plan and ORRI’s totaled $42,450 and $47,724 in 2024 and 2023, respectively. As of December 31, 2024
and 2023, the Company had accrued $0 and $0, respectively, under the Plan as accounts payable.
NOTE
10—GEOGRAPHICAL INFORMATION
The
Company currently has operations in two geographical areas, the United States and Colombia. Revenues for the years ended December 31,
2024 and 2023 and long-lived assets as of December 31, 2024 and 2023 attributable to each geographical area are presented below:
SCHEDULE
OF REVENUES AND LONG LIVED ASSETS ATTRIBUTABLE TO GEOGRAPHICAL AREA
| | |
2024 | | |
2023 | |
| | |
Revenues | | |
Long Lived Assets, Net | | |
Revenues | | |
Long Lived Assets, Net | |
| North America | |
$ | 560,180 | | |
$ | 1,117,636 | | |
$ | 794,027 | | |
$ | 1,559,301 | |
| South America | |
| — | | |
| — | | |
| — | | |
| — | |
| Total | |
$ | 560,180 | | |
$ | 1,117,636 | | |
$ | 794,027 | | |
$ | 1,559,301 | |
NOTE
11 — SEGMENT INFORMATION
The Company’s chief operating decision maker (“CODM”),
the Chief Executive Officer, manages the Company’s business activities as a single operating and reportable segment at the consolidated
level. Accordingly, our CODM uses net income to measure profit or loss, allocate resources, and assess performance. Further, the CODM
is regularly provided with and utilizes consolidated functional expenses, as presented in the accompanying consolidated statements of
operations, and total assets at the consolidated level, as included in the consolidated balance sheets herein, to manage the Company’s
operations.
NOTE
12—SUBSEQUENT EVENTS
On
February 20, 2025, the Company
entered into a Share Exchange Agreement with the members of Abundia Global Impact Group, LLC (“AGIG”). In the Share
Exchange Agreement, the Company has agreed to issue to the members of AGIG a number of shares of our common stock equal to 94% of
the Company’s issued and outstanding shares (after taking into account such issuance). As a result of entering into the Share
Exchange Agreement, we will acquire all of the issued and outstanding units of AGIG, and AGIG will become a wholly-owned subsidiary
of the Company. Under the Share Exchange Agreement, the Company is obligated to obtain shareholder approval for the amendment of our
Certificate of Incorporation to increase the number of authorized shares of common stock to 300,000,000
and for the issuance of approximately 246,000,000
shares to the members of AGIG. The acquisition is subject to shareholder approval and standard closing conditions.
In
January 2025, the Company sold 2,600,000 shares of its common stock in a registered direct offering for net proceeds of $3,897,000.
In
January 2025, the Company issued 24,202
options to its CEO and 24,202 options to a board member as compensation. In February 2025, the Company issued 10,638
options to its CEO as compensation.
NOTE
13—SUPPLEMENTAL INFORMATION ON OIL AND GAS EXPLORATION, DEVELOPMENT AND PRODUCTION ACTIVITIES (UNAUDITED)
This
footnote provides unaudited information required by FASB ASC Topic 932, Extractive Activities—Oil and Gas.
Geographical
Data
The
following table shows the Company’s oil and gas revenues and lease operating expenses, which excludes the joint venture expenses
incurred in South America, by geographic area:
SCHEDULE
OF OIL AND GAS REVENUES AND LEASE OPERATING EXPENSES
| | |
2024
| | |
2023
| |
| Revenues | |
| | | |
| | |
| North America | |
$ | 560,180 | | |
$ | 794,027 | |
| South America | |
| — | | |
| — | |
| | |
$ | 560,180 | | |
$ | 794,027 | |
| | |
| | | |
| | |
| Production Cost | |
| | | |
| | |
| North America | |
$ | 747,559 | | |
$ | 473,925 | |
| South America | |
| — | | |
| — | |
| | |
$ | 747,559 | | |
$ | 473,925 | |
Capital
Costs
Capitalized
costs and accumulated depletion relating to the Company’s oil and gas producing activities as of December 31, 2024, all of which
are onshore properties located in the United States and Colombia, South America are summarized below:
CAPITALIZED
COSTS AND ACCUMULATED DEPLETION RELATING TO OIL AND GAS PRODUCTION ACTIVITIES
| | |
United States | | |
South America | | |
Total | |
| Unproved properties not being amortized | |
$ | — | | |
$ | — | | |
$ | — | |
| Proved properties being amortized | |
| 13,326,003 | | |
| 49,444,654 | | |
| 62,770,657 | |
| Accumulated depreciation, depletion, amortization and impairment | |
| (12,208,367 | ) | |
| (49,444,654 | ) | |
| (61,653,021 | ) |
| | |
| | | |
| | | |
| | |
| Net capitalized costs | |
$ | 1,117,636 | | |
$ | — | | |
$ | 1,117,636 | |
Amortization
Rate
The
amortization rate per unit based on barrel of oil equivalents was $10.75 for the United States for the year ended December 31, 2024.
Reserve
Information and Related Standardized Measure of Discounted Future Net Cash Flows
The
unaudited supplemental information on oil and gas exploration and production activities has been presented in accordance with reserve
estimation and disclosures rules issued by the SEC in 2008. Under those rules, average first-day-of-the-month price during the 12-month
period before the end of the year are used when estimating whether reserve quantities are economical to produce. This same 12-month average
price is also used in calculating the aggregate amount of (and changes in) future cash inflows related to the standardized measure of
discounted future net cash flows. The rules also allow for the use of reliable technology to estimate proved oil and gas reserves if
those technologies have been demonstrated to result in reliable conclusions about reserve volumes. Disclosures by geographic area include
the United States and South America, which consists of our interests in Colombia. The supplemental unaudited presentation of proved reserve
quantities and related standardized measure of discounted future net cash flows provides estimates only and does not purport to reflect
realizable values or fair market values of the Company’s reserves. Volumes reported for proved reserves are based on reasonable
estimates. These estimates are consistent with current knowledge of the characteristics and production history of the reserves. The Company
emphasizes that reserve estimates are inherently imprecise and that estimates of new discoveries are more imprecise than those of producing
oil and gas properties. Accordingly, significant changes to these estimates can be expected as future information becomes available.
Proved
reserves are those estimated reserves of crude oil (including condensate and natural gas liquids) and natural gas that geological and
engineering data demonstrate with reasonable certainty to be recoverable in future years from known reservoirs under existing economic
and operating conditions. Proved developed reserves are those expected to be recovered through existing wells, equipment, and operating
methods.
The
reserve estimates set forth below were prepared by Russell K. Hall and Associates, Inc. (“R.K. Hall”), utilizing reserve
definitions and pricing requirements prescribed by the SEC. R.K. Hall is an independent professional engineering firm specializing in
the technical and financial evaluation of oil and gas assets. R.K. Hall’s report was conducted under the direction of Russell K.
Hall, founder and President of R.K. Hall. Mr. Hall holds a BS in Mechanical Engineering from the University of Oklahoma and is a registered
professional engineer with more than 30 years of experience in reserve evaluation services. R.K. Hall and their respective employees
have no interest in the Company and were objective in determining the results of the Company’s reserves.
Total
estimated proved developed, proved non-producing, and undeveloped reserves by product type and the changes therein are set forth below for the years indicated.
SCHEDULE OF PROVED DEVELOPED AND
UNDEVELOPED RESERVES BY PRODUCT TYPE
| | |
United States | |
| | |
Gas (mcf) | | |
Oil (bbls) | | |
Natural Gas Liquids (gallons) |
|
| Total proved reserves | |
| | | |
| | | |
| |
|
| | |
| | | |
| | | |
| |
|
| Balance December 31, 2022 | |
| 1,030,420 | | |
| 83,517 | | |
| — |
|
| | |
| | | |
| | | |
| |
|
| Revisions of prior estimates | |
| (365,414 | ) | |
| (16,947 | ) | |
| — |
|
| Production | |
| (57,360 | ) | |
| (7,719 | ) | |
| — |
|
| | |
| | | |
| | | |
| |
|
| Balance December 31, 2023 | |
| 607,646 | | |
| 58,599 | | |
| — |
|
| | |
| | | |
| | | |
| |
|
| Extensions and discoveries |
|
|
78,980 |
|
|
|
17,000 |
|
|
|
502,614 |
|
| Revisions to prior estimates | |
| (214,960 | ) | |
| (23,217 | ) | |
| 1,119,316 |
|
| Production | |
| (53,476 | ) | |
| (5,992 | ) | |
| (159,680 |
) |
| | |
| | | |
| | | |
| |
|
| Balance December 31, 2024 | |
| 418,190 | | |
| 46,390 | | |
| 1,462,250 |
|
| | |
| | | |
| | | |
| |
|
| Proved developed reserves | |
| | | |
| | | |
| |
|
| at December 31, 2023 | |
| 607,646 | | |
| 58,599 | | |
| 1,621,930 |
|
| at December 31, 2024 | |
| 418,190 | | |
| 46,390 | | |
| 1,462,250 |
|
| | |
| | | |
| | | |
| |
|
| Proved undeveloped reserves | |
| | | |
| | | |
| |
|
| at December 31, 2023 | |
| — | | |
| — | | |
| — |
|
| at December 31, 2024 | |
| — | | |
| — | | |
| — |
|
As
of December 31, 2024 and 2023, the Company had no proved undeveloped (“PUD”) reserves and no reserves outside of the United States.
The
standardized measure of discounted future net cash flows relating to proved oil and gas reserves is computed using average first-day-of
the-month prices for oil and gas during the preceding 12-month period (with consideration of price changes only to the extent provided
by contractual arrangements), applied to the estimated future production of proved oil and gas reserves, less estimated future expenditures
(based on year-end costs) to be incurred in developing and producing the proved reserves, less estimated related future income tax expenses
(based on year-end statutory tax rates, with consideration of future tax rates already legislated), and assuming continuation of existing
economic conditions. Future income tax expenses give effect to permanent differences and tax credits but do not reflect the impact of
continuing operations including property acquisitions and exploration. The estimated future cash flows are then discounted using a rate
of ten percent a year to reflect the estimated timing of the future cash flows.
Standardized
measure of discounted future net cash flows at December 31, 2024:
STANDARDIZED
MEASURE OF DISCOUNTED FUTURE NET CASH FLOWS
| | |
United
States | | |
South
America | | |
Total | |
| Future cash flows from sales of oil and gas | |
$ | 4,427,982 | | |
| — | | |
| 4,427,982 | |
| Future production cost | |
| (2,400,990 | ) | |
| — | | |
| (2,400,990 | ) |
| Future development cost | |
| (155,628 | ) | |
| — | | |
| 155,628 | |
| Future net cash flows | |
| 1,871,364 | | |
| — | | |
| 1,871,364 | |
| 10% annual discount for timing of cash flow | |
| (748,094 | ) | |
| — | | |
| (748,094 | ) |
| | |
| | | |
| | | |
| | |
| Standardized measure of discounted future net cash flow relating to proved oil and gas reserves | |
$ | 1,123,270 | | |
| — | | |
| 1,123,270 | |
| | |
| | | |
| | | |
| | |
| Changes in standardized measure: | |
| | | |
| | | |
| | |
| Change due to current year operations Sales, net of production costs | |
$ | 39,359 | ) | |
| — | | |
| 39,359 | |
| Sales, net of production costs | |
$ | 39,359 | ) | |
| — | | |
| 39,359 | ) |
| Change due to revisions in standardized variables: | |
| — | | |
| | | |
| — | |
| Accretion of discount | |
| 156,472 | | |
| — | | |
| 156,472 | |
| Net change in sales and transfer price, net of production costs | |
| (1,433,013 | ) | |
| — | | |
| (1,433,013 | ) |
| Net change in future development cost | |
| — | | |
| — | | |
| — | |
| Discoveries | |
| 585,420 | | |
| — | | |
| 585,420 | |
| Revision and others | |
| (33,056 | ) | |
| — | | |
| (33,056 | ) |
| Changes in production rates and other | |
| 243,364 | | |
| — | | |
| 243,364 | |
| | |
| | | |
| | | |
| | |
| Net | |
| (441,454 | ) | |
| — | | |
| (441,454 | ) |
| Beginning of year | |
| 1,564,724 | | |
| — | | |
| 1,564,724 | |
| End of year | |
$ | 1,123,270 | | |
| — | | |
| 1,123,270 | |
Standardized
measure of discounted future net cash flows at December 31, 2023:
| | |
United
States | | |
South
America | | |
Total | |
| Future cash flows from sales of oil and gas | |
$ | 6,509,498 | | |
$ | — | | |
$ | 6,509,498 | |
| Future production cost | |
| (3,804,439 | ) | |
| — | | |
| (3,804,439 | ) |
| Future development cost | |
| — | | |
| — | | |
| — | |
| Future net cash flows | |
| 2,705,059 | | |
| — | | |
| 2,705,059 | |
| 10% annual discount for timing of cash flow | |
| (1,140,335 | ) | |
| — | | |
| (1,140,335 | ) |
| | |
| | | |
| | | |
| | |
| Standardized measure of discounted future net cash flow relating to proved oil and gas reserves | |
$ | 1,564,724 | | |
$ | — | | |
$ | 1,564,724 | |
| | |
| | | |
| | | |
| | |
| Changes in standardized measure: | |
| | | |
| | | |
| | |
| Change due to current year operations Sales, net of production costs | |
$ | (196,003 | ) | |
$ | — | | |
$ | (196,003 | ) |
| Sales, net of production costs | |
$ | (196,003 | ) | |
$ | — | | |
$ | (196,003 | ) |
| Change due to revisions in standardized variables: | |
| | | |
| | | |
| | |
| Accretion of discount | |
| 516,316 | | |
| — | | |
| 516,316 | |
| Net change in sales and transfer price, net of production costs | |
| (3,117,105 | ) | |
| — | | |
| (3,117,105 | |
| Net change in future development cost | |
| — | | |
| — | | |
| — | |
| Discoveries | |
| — | | |
| — | | |
| — | |
| Revision and others | |
| (645,668 | ) | |
| — | | |
| (645,668 | |
| Changes in production rates and other | |
| (155,975 | ) | |
| — | | |
| (155,975 | ) |
| | |
| | | |
| | | |
| | |
| Net | |
| (3,598,435 | ) | |
| — | | |
| (3,598,435 | |
| Beginning of year | |
| 5,163,159 | | |
| — | | |
| 5,163,159 | |
| End of year | |
$ | 1,564,724 | | |
$ | — | | |
$ | 1,564,724 | |
Exhibit
3.5
CERTIFICATE
OF AMENDMENT
OF
CERTIFICATE
OF INCORPORATION
OF
HOUSTON
AMERICAN ENERGY CORP.
*
* * * * * * *
HOUSTON
AMERICAN ENERGY CORP., a corporation organized and existing under and by virtue of the General Corporation Law of the State of Delaware
(the “Corporation”), in accordance with the provisions of Section 242 of the General Corporation Law of the State of Delaware,
does hereby certify:
FIRST:
That at a meeting of the Board of Directors of the Corporation resolutions were duly adopted summarizing a proposed amendment to the
Certificate of Incorporation of said Corporation, declaring said amendment to be advisable and calling a meeting of the shareholders
of said Corporation for consideration thereof. The resolutions summarizing the proposed amendment are as follows:
RESOLVED,
that the Corporation’s Certificate of Incorporation be amended to increase the number of authorized shares of common stock from
12,000,000 to 20,000,000.
SECOND:
That, in accordance with the resolution set forth in ONE above, ARTICLE IV, paragraph 1 of the Corporation’s Certificate of Incorporation
be amended to give effect to an increase in the authorized shares of the Corporation’s common stock and to read in full as follows:
“1.
Authorized Stock. The total number of shares of stock which the Company shall have authority to issue is 30,000,000, consisting of 20,000,000
shares of common stock, par value $0.001 per share (the “Common Stock”), and 10,000,000 shares of preferred stock, par value
$0.001 per share (the “Preferred Stock”).”
THIRD:
That thereafter, pursuant to resolution of its Board of Directors, an annual meeting of the stockholders of said corporation was duly
called and held, upon notice in accordance with Section 222 of the General Corporation Law of the State of Delaware at which meeting
the necessary number of shares as required by statute were voted in favor of the amendment.
FOURTH:
That said amendment was duly adopted in accordance with the provisions of Section 242 of the General Corporation Law of the State of
Delaware.
FIFTH:
This amendment shall become effective on the date filed with the State of Delaware.
IN
WITNESS WHEREOF, said Corporation has caused this certificate to be signed by its President this 24th day of June 2024.
| |
HOUSTON
AMERICAN ENERGY CORP. |
| |
|
|
| |
By: |
/s/
John F. Terwilliger |
| |
John
F. Terwilliger, President |
Exhibit
23.1
Independent
Registered Public Accounting Firm’s Consent
We
consent to the incorporation by reference in the Registration Statement of on Form S-8 (File No. 333-258906), Form S-8 (File No. 333-220838),
and Form S-3 (File No. 333-282778), of our report dated February 20, 2025, with respect to our audits of the consolidated financial statements
and related consolidated financial statement schedules of Houston American Energy Corp. as of December 31, 2024 and 2023 and for the
years ended December 31, 2024 and 2023, which report is included in this Annual Report on Form 10-K of Houston American Energy Corp.
for the year ended December 31, 2024.
/s/
Marcum llp
Marcum llp
Houston, Texas
February 20, 2024
Exhibit
23.2
CONSENT
OF INDEPENDENT PETROLEUM ENGINEERS
We
hereby consent to the use of the name Russell K. Hall and Associates, Inc. and to incorporation by reference of our report dated January
21, 2025, which appears in the annual report on Form 10-K/A of Houston American Energy Corp. for the year ended December 31, 2024, in the
Registration Statements of Houston American Energy Corp. on Form S-3 (File No. 333-267163), Form S-8 (File No. 333-258906), Form S-8
(File No. 333-220838), Form S-8 (File No. 333-206875) and Form S-8 (File No. 333-151824), and in any amendments to those Registration
Statements.
| /s/
Russell K. Hall |
|
| |
|
| RUSSELL
K. HALL AND ASSOCIATES, INC. |
|
| MIDLAND,
TEXAS |
|
| February
21, 2025 |
|
Exhibit
31.1
SECTION
302
CERTIFICATION
I,
Peter Longo, certify that:
| 1. |
I
have reviewed this annual report on Form 10-K of Houston American Energy Corp.; |
| 2. |
Based
on my knowledge, this report does not contain any untrue statement of a material fact or omit to state a material fact necessary
to make the statements made, in light of the circumstances under which such statements were made, not misleading with respect to
the period covered by this report; |
| 3. |
Based
on my knowledge, the financial statements, and other financial information included in this report, fairly present in all material
respect the financial condition, results of operations and cash flows of the registrant as of, and for, the periods presented in
this report; |
| 4. |
The
registrant’s other certifying officer and I are responsible for establishing and maintaining disclosure controls and procedures
(as defined in Exchange Act Rules 13a-15(e) and 15d-15(e)) and internal control over financial reporting (as defined in Exchange
Act Rules 13a–15(f) and 15d–15(f)) for the registrant and have: |
| |
a) |
designed
such disclosure controls and procedures, or caused such disclosure controls and procedures to be designed under our supervision,
to ensure that material information relating to the registrant, including its consolidated subsidiaries, is made known to us by others
within those entities, particularly during the period in which this quarterly report is being prepared; |
| |
b) |
designed
such internal control over financial reporting, or caused such internal control over financial reporting to be designed under our
supervision, to provide reasonable assurance regarding the reliability of financial reporting and the preparation of financial statements
for external purposes in accordance with generally accepted accounting principles; |
| |
c) |
evaluated
the effectiveness of the registrant’s disclosure controls and procedures and presented in this report our conclusions about
the effectiveness of the disclosure controls and procedures, as of the end of the period covered by this report based on such evaluation;
and |
| |
d) |
disclosed
in this report any change in the registrant’s internal control over financial reporting that occurred during the registrant’s
most recent fiscal quarter that has materially affected, or is reasonably likely to materially affect, the registrant’s internal
control over financial reporting; and |
| 5. |
The
registrant’s other certifying officer and I have disclosed, based on our most recent evaluation of internal control over financial
reporting, to the registrant’s auditors and the audit committee of the registrant’s board of directors: |
| |
a) |
all
significant deficiencies and material weaknesses in the design or operation of internal control over financial reporting which are
reasonably likely to adversely affect the registrant’s ability to record, process, summarize and report financial information;
and |
| |
b) |
any
fraud, whether or not material, that involves management or other employees who have a significant role in the registrant’s
internal controls over financial reporting. |
| Date:
February 21, 2025 |
|
| |
Peter
Longo, |
| |
Chief
Executive Officer and |
| |
Principal
Financial Officer |
Exhibit
32.1
CERTIFICATION
OF CHIEF EXECUTIVE OFFICER
AND
CHIEF FINANCIAL OFFICER
PURSUANT
TO
18
U.S.C. SECTION 1350,
AS
ADOPTED PURSUANT TO
SECTION
906 OF THE SARBANES-OXLEY ACT OF 2002
I,
Peter Long, certify, pursuant to 18 U.S.C. Section 1350, as adopted pursuant to Section 906 of the Sarbanes-Oxley Act of 2002,
that the Annual Report of Houston American Energy Corp. on Form 10-K for the year ended December 31, 2024 fully complies with the requirements
of Section 13(a) or 15(d) of the Securities Exchange Act of 1934 and that information contained in such Form 10-K fairly presents in
all material respects the financial condition and results of operations of Houston American Energy Corp.
| |
By: |
|
| |
Name: |
Peter
Longo |
| |
Title: |
Chief
Executive Officer and |
| |
|
Chief
Financial Officer |
| |
Dated: |
February
21, 2025 |
Exhibit 97.1
HOUSTON
AMERICAN ENERGY CORP.
Clawback Policy
Effective:
March 28, 2023
1.
Recoupment
If
Houston American Energy Corp. (the “Company”) is required to undertake a Restatement, then the Board shall, unless the Company’s
Compensation Committee determines it impracticable to do so, after exercising a normal due process review of all the relevant facts and
circumstances, recover all Recoverable Compensation Received by any Covered Person during the Applicable Period. In addition, the Board
may, in its sole discretion and in the reasonable exercise of its business judgment, determine whether and to what extent additional
action is appropriate to address the circumstances surrounding such Restatement to minimize the likelihood of any recurrence and to impose
such other discipline as it deems appropriate.
Subject
to applicable law, the Board may seek to recoup such Recoverable Compensation by requiring any Covered Person to repay such amount to
the Company; by set-off of a Covered Person’s other compensation; by reducing future compensation; or by such other means or combination
of means as the Board, in its sole discretion, determines to be appropriate.
2.
Administration of Policy
The
Board shall have full authority to administer this Policy. Actions of the Board pursuant to this Policy shall be taken by the vote of
a majority of its members. The Board shall, subject to the provisions of this Policy, make such determinations and interpretations and
take such actions in connection with this Policy as it deems necessary, appropriate or advisable. All determinations and interpretations
made by the Board shall be final, binding and conclusive.
The
Board may delegate any of its powers under this Policy to the Compensation Committee of the Board or any subcommittee or delegate thereof.
3.
Acknowledgement by Covered Persons
The
Board shall provide notice and seek written acknowledgement of this Policy from each Covered Person, provided that the failure to provide
such notice or obtain such acknowledgement shall have no impact on the applicability or enforceability of this Policy.
4.
Other Laws
This
Policy is in addition to (and not in lieu of) any right of repayment, forfeiture or right of offset against any Covered Person that may
be available under applicable law or otherwise (regardless of whether implemented at any time prior to or following the adoption of the
Policy). Notwithstanding anything to the contrary in this Policy, in no event shall the Board seek any recoupment described in this Policy
if, by doing so, the Company would be in violation of any applicable state wage or other law.
5.
Amendment; Termination
The
Board may amend or terminate this Policy at any time.
6.
Disclosures
Appropriate
disclosures and other filings with respect to this Policy will be made in accordance with Rule 10D-1 of the Securities Exchange Act of
1934, as amended, and the Company’s applicable exchange listing standards.
7.
Definitions
For
purposes of this Policy, the following terms shall have the following meanings:
Applicable
Period. “Applicable Period” means the three complete fiscal years preceding the determination a Restatement is required,
as determined by the Board.
Board.
“Board” means the Board of Directors of the Company.
Covered
Person. “Covered Person” means any person who is or was during the Applicable Period an Executive Officer of the Company
or any affiliate thereof.
Executive
Officer. “Executive Officer” means the Company’s president, principal financial officer, principal accounting officer
(or if there is no such accounting officer, the controller), any vice-president of the Company in charge of a principal business unit,
division, or function (such as sales, administration, or finance), any other officer who performs a policy-making function, or any other
person who performs similar policy-making functions for the Company.
Financial
Reporting Measure. “Financial Reporting Measure” means a measure that is determined and presented in accordance with
the accounting principles used in preparing the Company’s financial statements (including “non-GAAP” financial measures,
such as those appearing in earnings releases or MD&A), and any measure that is derived wholly or in part from such measure. Examples
of Financial Reporting Measures include measures based on: revenues, net income, operating income, financial ratios, EBITDA, liquidity
measures, return measures (such as return on assets), profitability of one or more segments, sales per square foot, same store sales,
revenue per user, and cost per employee. Stock price and total shareholder return are also Financial Reporting Measures.
Incentive-Based
Compensation. “Incentive-Based Compensation” means any compensation that is granted, earned, or vested based wholly or
in part upon the attainment of a Financial Reporting Measure. Incentive-Based Compensation does not include any base salaries, discretionary
cash bonuses and equity awards that vest solely on the passage of time.
Policy.
“Policy” means this Houston American Energy Corp. Clawback Policy.
Received.
Incentive-Based Compensation is deemed “Received” in the Company’s fiscal period during which the Financial Reporting
Measure specified in the Incentive-Based Compensation award is attained, even if the payment or grant of the Incentive-Based Compensation
occurs after the end of that period.
Recoverable
Compensation. “Recoverable Compensation” means the amount of any Incentive-Based Compensation (calculated on a pre-tax
basis) Received by a Covered Person during the Applicable Period that is in excess of the amount that otherwise would have been Received
if the calculation were based on the Restatement.
Restatement.
“Restatement” means an accounting restatement of any of the Company’s financial statements filed with the Securities
and Exchange Commission under the Securities Exchange Act of 1934, as amended, or the Securities Act of 1933, as amended, due to the
Company’s material noncompliance with any financial reporting requirement under U.S. securities laws, regardless of whether company
or executive officer misconduct was the cause for such restatement. “Restatement” includes any required accounting restatement
to correct an error in previously issued financial statements that is material to the previously issued financial statements (commonly
referred to as “Big R” restatements), or that would result in a material misstatement if the error were corrected in the
current period or left uncorrected in the current period (commonly referred to as “little r” restatements).
Exhibit 99.2
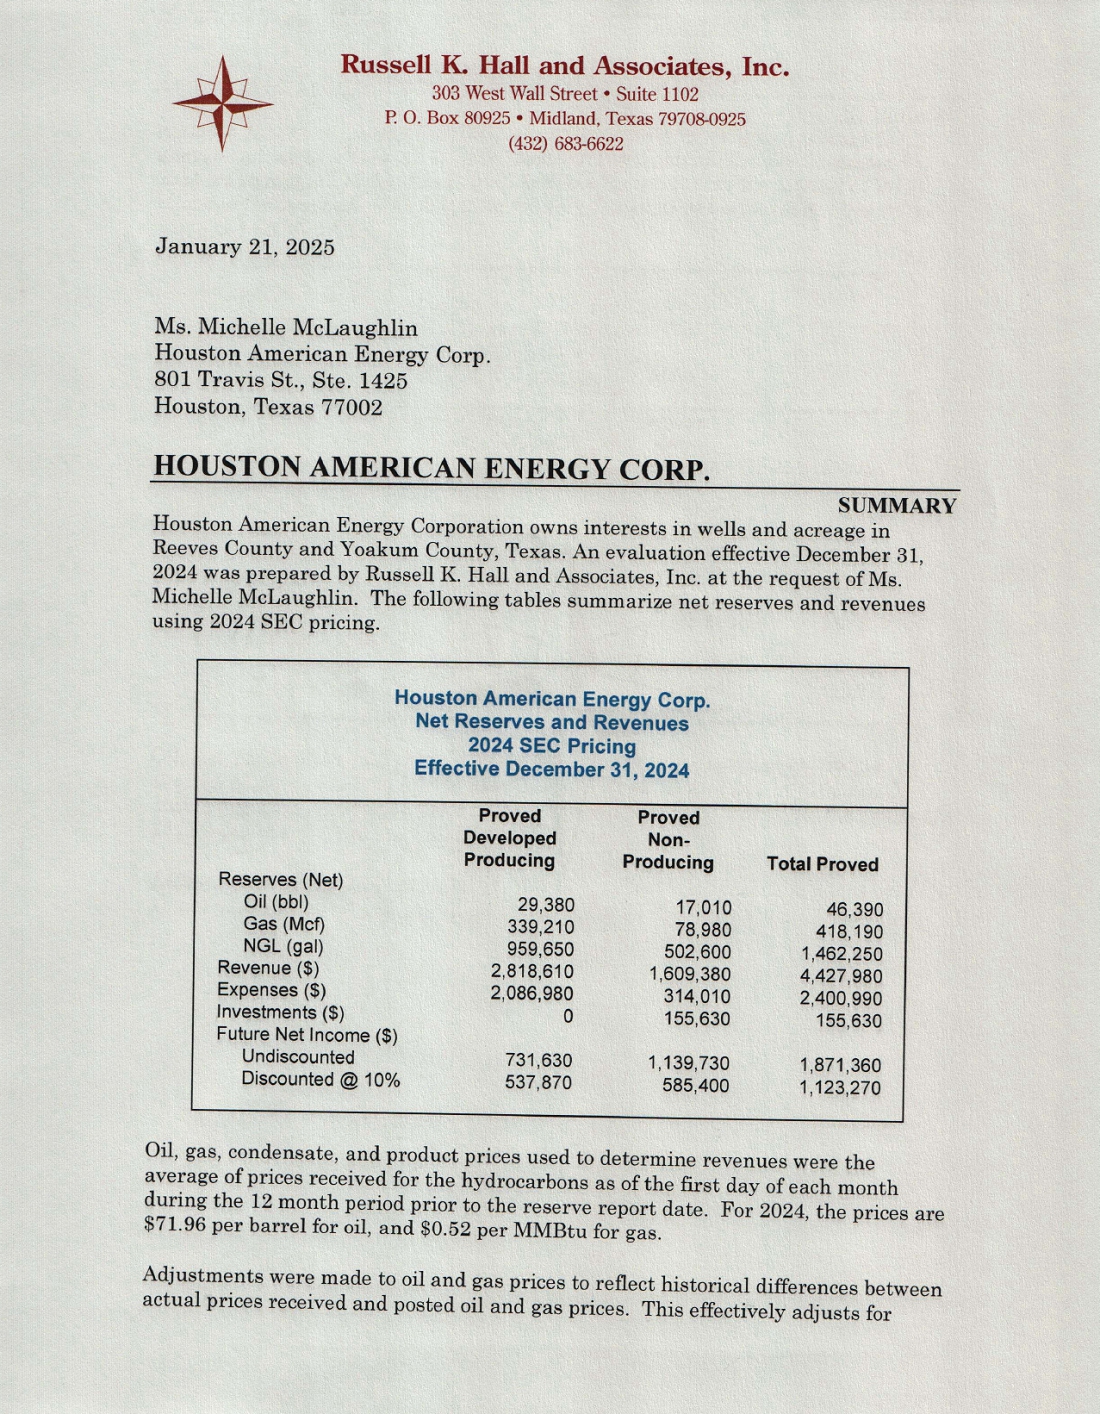
v3.25.0.1
Cover - USD ($)
$ / shares in Units, $ in Millions |
12 Months Ended |
|
Dec. 31, 2024 |
Feb. 21, 2025 |
| Cover [Abstract] |
|
|
| Document Type |
10-K
|
|
| Amendment Flag |
false
|
|
| Document Annual Report |
true
|
|
| Document Transition Report |
false
|
|
| Document Period End Date |
Dec. 31, 2024
|
|
| Document Fiscal Period Focus |
FY
|
|
| Document Fiscal Year Focus |
2024
|
|
| Current Fiscal Year End Date |
--12-31
|
|
| Entity File Number |
1-32955
|
|
| Entity Registrant Name |
HOUSTON
AMERICAN ENERGY CORP.
|
|
| Entity Central Index Key |
0001156041
|
|
| Entity Tax Identification Number |
76-0675953
|
|
| Entity Incorporation, State or Country Code |
DE
|
|
| Entity Address, Address Line One |
801
Travis Street
|
|
| Entity Address, Address Line Two |
Suite 1425
|
|
| Entity Address, City or Town |
Houston
|
|
| Entity Address, State or Province |
TX
|
|
| Entity Address, Postal Zip Code |
77002
|
|
| City Area Code |
(713)
|
|
| Local Phone Number |
222-6966
|
|
| Title of 12(b) Security |
Common
Stock, $0.001 par value
|
|
| Trading Symbol |
HUSA
|
|
| Security Exchange Name |
NYSEAMER
|
|
| Entity Well-known Seasoned Issuer |
No
|
|
| Entity Voluntary Filers |
No
|
|
| Entity Current Reporting Status |
Yes
|
|
| Entity Interactive Data Current |
Yes
|
|
| Entity Filer Category |
Non-accelerated Filer
|
|
| Entity Small Business |
true
|
|
| Entity Emerging Growth Company |
false
|
|
| Entity Shell Company |
false
|
|
| Entity Public Float |
$ 17,666,820.0
|
|
| Entity Common Stock, Shares Outstanding |
|
15,686,533
|
| Documents Incorporated by Reference [Text Block] |
Portions
of the Company’s Proxy Statement for its 2025 Annual Meeting are incorporated by reference into Part III of this Report.
|
|
| ICFR Auditor Attestation Flag |
false
|
|
| Document Financial Statement Error Correction [Flag] |
false
|
|
| Entity Listing, Par Value Per Share |
$ 0.001
|
|
| Auditor Firm ID |
688
|
|
| Auditor Name |
Marcum
LLP
|
|
| Auditor Location |
Houston,
Texas
|
|
| X |
- DefinitionBoolean flag that is true when the XBRL content amends previously-filed or accepted submission.
| Name: |
dei_AmendmentFlag |
| Namespace Prefix: |
dei_ |
| Data Type: |
xbrli:booleanItemType |
| Balance Type: |
na |
| Period Type: |
duration |
|
| X |
- DefinitionPCAOB issued Audit Firm Identifier Reference 1: http://www.xbrl.org/2003/role/presentationRef
-Publisher SEC
-Name Form 10-K
-Number 249
-Section 310
Reference 2: http://www.xbrl.org/2003/role/presentationRef
-Publisher SEC
-Name Form 20-F
-Number 249
-Section 220
-Subsection f
Reference 3: http://www.xbrl.org/2003/role/presentationRef
-Publisher SEC
-Name Form 40-F
-Number 249
-Section 240
-Subsection f
| Name: |
dei_AuditorFirmId |
| Namespace Prefix: |
dei_ |
| Data Type: |
dei:nonemptySequenceNumberItemType |
| Balance Type: |
na |
| Period Type: |
duration |
|
| X |
- ReferencesReference 1: http://www.xbrl.org/2003/role/presentationRef
-Publisher SEC
-Name Form 10-K
-Number 249
-Section 310
Reference 2: http://www.xbrl.org/2003/role/presentationRef
-Publisher SEC
-Name Form 20-F
-Number 249
-Section 220
-Subsection f
Reference 3: http://www.xbrl.org/2003/role/presentationRef
-Publisher SEC
-Name Form 40-F
-Number 249
-Section 240
-Subsection f
| Name: |
dei_AuditorLocation |
| Namespace Prefix: |
dei_ |
| Data Type: |
dei:internationalNameItemType |
| Balance Type: |
na |
| Period Type: |
duration |
|
| X |
- ReferencesReference 1: http://www.xbrl.org/2003/role/presentationRef
-Publisher SEC
-Name Form 10-K
-Number 249
-Section 310
Reference 2: http://www.xbrl.org/2003/role/presentationRef
-Publisher SEC
-Name Form 20-F
-Number 249
-Section 220
-Subsection f
Reference 3: http://www.xbrl.org/2003/role/presentationRef
-Publisher SEC
-Name Form 40-F
-Number 249
-Section 240
-Subsection f
| Name: |
dei_AuditorName |
| Namespace Prefix: |
dei_ |
| Data Type: |
dei:internationalNameItemType |
| Balance Type: |
na |
| Period Type: |
duration |
|
| X |
- DefinitionEnd date of current fiscal year in the format --MM-DD.
| Name: |
dei_CurrentFiscalYearEndDate |
| Namespace Prefix: |
dei_ |
| Data Type: |
xbrli:gMonthDayItemType |
| Balance Type: |
na |
| Period Type: |
duration |
|
| X |
- DefinitionBoolean flag that is true only for a form used as an annual report. Reference 1: http://www.xbrl.org/2003/role/presentationRef
-Publisher SEC
-Name Form 10-K
-Number 249
-Section 310
Reference 2: http://www.xbrl.org/2003/role/presentationRef
-Publisher SEC
-Name Form 20-F
-Number 249
-Section 220
-Subsection f
Reference 3: http://www.xbrl.org/2003/role/presentationRef
-Publisher SEC
-Name Form 40-F
-Number 249
-Section 240
-Subsection f
| Name: |
dei_DocumentAnnualReport |
| Namespace Prefix: |
dei_ |
| Data Type: |
xbrli:booleanItemType |
| Balance Type: |
na |
| Period Type: |
duration |
|
| X |
- DefinitionIndicates whether any of the financial statement period in the filing include a restatement due to error correction. Reference 1: http://www.xbrl.org/2003/role/presentationRef
-Publisher SEC
-Name Regulation S-K
-Number 229
-Section 402
-Subsection w
Reference 2: http://www.xbrl.org/2003/role/presentationRef
-Publisher SEC
-Name Form 10-K
-Number 249
-Section 310
Reference 3: http://www.xbrl.org/2003/role/presentationRef
-Publisher SEC
-Name Form 20-F
-Number 249
-Section 220
-Subsection f
Reference 4: http://www.xbrl.org/2003/role/presentationRef
-Publisher SEC
-Name Form 40-F
-Number 249
-Section 240
-Subsection f
| Name: |
dei_DocumentFinStmtErrorCorrectionFlag |
| Namespace Prefix: |
dei_ |
| Data Type: |
xbrli:booleanItemType |
| Balance Type: |
na |
| Period Type: |
duration |
|
| X |
- DefinitionFiscal period values are FY, Q1, Q2, and Q3. 1st, 2nd and 3rd quarter 10-Q or 10-QT statements have value Q1, Q2, and Q3 respectively, with 10-K, 10-KT or other fiscal year statements having FY.
| Name: |
dei_DocumentFiscalPeriodFocus |
| Namespace Prefix: |
dei_ |
| Data Type: |
dei:fiscalPeriodItemType |
| Balance Type: |
na |
| Period Type: |
duration |
|
| X |
- DefinitionThis is focus fiscal year of the document report in YYYY format. For a 2006 annual report, which may also provide financial information from prior periods, fiscal 2006 should be given as the fiscal year focus. Example: 2006.
| Name: |
dei_DocumentFiscalYearFocus |
| Namespace Prefix: |
dei_ |
| Data Type: |
xbrli:gYearItemType |
| Balance Type: |
na |
| Period Type: |
duration |
|
| X |
- DefinitionFor the EDGAR submission types of Form 8-K: the date of the report, the date of the earliest event reported; for the EDGAR submission types of Form N-1A: the filing date; for all other submission types: the end of the reporting or transition period. The format of the date is YYYY-MM-DD.
| Name: |
dei_DocumentPeriodEndDate |
| Namespace Prefix: |
dei_ |
| Data Type: |
xbrli:dateItemType |
| Balance Type: |
na |
| Period Type: |
duration |
|
| X |
- DefinitionBoolean flag that is true only for a form used as a transition report. Reference 1: http://www.xbrl.org/2003/role/presentationRef
-Publisher SEC
-Name Forms 10-K, 10-Q, 20-F
-Number 240
-Section 13
-Subsection a-1
| Name: |
dei_DocumentTransitionReport |
| Namespace Prefix: |
dei_ |
| Data Type: |
xbrli:booleanItemType |
| Balance Type: |
na |
| Period Type: |
duration |
|
| X |
- DefinitionThe type of document being provided (such as 10-K, 10-Q, 485BPOS, etc). The document type is limited to the same value as the supporting SEC submission type, or the word 'Other'.
| Name: |
dei_DocumentType |
| Namespace Prefix: |
dei_ |
| Data Type: |
dei:submissionTypeItemType |
| Balance Type: |
na |
| Period Type: |
duration |
|
| X |
- DefinitionDocuments incorporated by reference. Reference 1: http://www.xbrl.org/2003/role/presentationRef
-Publisher SEC
-Name Exchange Act
-Number 240
-Section 12
-Subsection b-23
| Name: |
dei_DocumentsIncorporatedByReferenceTextBlock |
| Namespace Prefix: |
dei_ |
| Data Type: |
dtr-types:textBlockItemType |
| Balance Type: |
na |
| Period Type: |
duration |
|
| X |
- DefinitionAddress Line 1 such as Attn, Building Name, Street Name
| Name: |
dei_EntityAddressAddressLine1 |
| Namespace Prefix: |
dei_ |
| Data Type: |
xbrli:normalizedStringItemType |
| Balance Type: |
na |
| Period Type: |
duration |
|
| X |
- DefinitionAddress Line 2 such as Street or Suite number
| Name: |
dei_EntityAddressAddressLine2 |
| Namespace Prefix: |
dei_ |
| Data Type: |
xbrli:normalizedStringItemType |
| Balance Type: |
na |
| Period Type: |
duration |
|
| X |
- Definition
+ References
+ Details
| Name: |
dei_EntityAddressCityOrTown |
| Namespace Prefix: |
dei_ |
| Data Type: |
xbrli:normalizedStringItemType |
| Balance Type: |
na |
| Period Type: |
duration |
|
| X |
- DefinitionCode for the postal or zip code
| Name: |
dei_EntityAddressPostalZipCode |
| Namespace Prefix: |
dei_ |
| Data Type: |
xbrli:normalizedStringItemType |
| Balance Type: |
na |
| Period Type: |
duration |
|
| X |
- DefinitionName of the state or province.
| Name: |
dei_EntityAddressStateOrProvince |
| Namespace Prefix: |
dei_ |
| Data Type: |
dei:stateOrProvinceItemType |
| Balance Type: |
na |
| Period Type: |
duration |
|
| X |
- DefinitionA unique 10-digit SEC-issued value to identify entities that have filed disclosures with the SEC. It is commonly abbreviated as CIK. Reference 1: http://www.xbrl.org/2003/role/presentationRef
-Publisher SEC
-Name Exchange Act
-Number 240
-Section 12
-Subsection b-2
| Name: |
dei_EntityCentralIndexKey |
| Namespace Prefix: |
dei_ |
| Data Type: |
dei:centralIndexKeyItemType |
| Balance Type: |
na |
| Period Type: |
duration |
|
| X |
- DefinitionIndicate number of shares or other units outstanding of each of registrant's classes of capital or common stock or other ownership interests, if and as stated on cover of related periodic report. Where multiple classes or units exist define each class/interest by adding class of stock items such as Common Class A [Member], Common Class B [Member] or Partnership Interest [Member] onto the Instrument [Domain] of the Entity Listings, Instrument.
| Name: |
dei_EntityCommonStockSharesOutstanding |
| Namespace Prefix: |
dei_ |
| Data Type: |
xbrli:sharesItemType |
| Balance Type: |
na |
| Period Type: |
instant |
|
| X |
- DefinitionIndicate 'Yes' or 'No' whether registrants (1) have filed all reports required to be filed by Section 13 or 15(d) of the Securities Exchange Act of 1934 during the preceding 12 months (or for such shorter period that registrants were required to file such reports), and (2) have been subject to such filing requirements for the past 90 days. This information should be based on the registrant's current or most recent filing containing the related disclosure.
| Name: |
dei_EntityCurrentReportingStatus |
| Namespace Prefix: |
dei_ |
| Data Type: |
dei:yesNoItemType |
| Balance Type: |
na |
| Period Type: |
duration |
|
| X |
- DefinitionIndicate if registrant meets the emerging growth company criteria. Reference 1: http://www.xbrl.org/2003/role/presentationRef
-Publisher SEC
-Name Exchange Act
-Number 240
-Section 12
-Subsection b-2
| Name: |
dei_EntityEmergingGrowthCompany |
| Namespace Prefix: |
dei_ |
| Data Type: |
xbrli:booleanItemType |
| Balance Type: |
na |
| Period Type: |
duration |
|
| X |
- DefinitionCommission file number. The field allows up to 17 characters. The prefix may contain 1-3 digits, the sequence number may contain 1-8 digits, the optional suffix may contain 1-4 characters, and the fields are separated with a hyphen.
| Name: |
dei_EntityFileNumber |
| Namespace Prefix: |
dei_ |
| Data Type: |
dei:fileNumberItemType |
| Balance Type: |
na |
| Period Type: |
duration |
|
| X |
- DefinitionIndicate whether the registrant is one of the following: Large Accelerated Filer, Accelerated Filer, Non-accelerated Filer. Definitions of these categories are stated in Rule 12b-2 of the Exchange Act. This information should be based on the registrant's current or most recent filing containing the related disclosure. Reference 1: http://www.xbrl.org/2003/role/presentationRef
-Publisher SEC
-Name Exchange Act
-Number 240
-Section 12
-Subsection b-2
| Name: |
dei_EntityFilerCategory |
| Namespace Prefix: |
dei_ |
| Data Type: |
dei:filerCategoryItemType |
| Balance Type: |
na |
| Period Type: |
duration |
|
| X |
- DefinitionTwo-character EDGAR code representing the state or country of incorporation.
| Name: |
dei_EntityIncorporationStateCountryCode |
| Namespace Prefix: |
dei_ |
| Data Type: |
dei:edgarStateCountryItemType |
| Balance Type: |
na |
| Period Type: |
duration |
|
| X |
- DefinitionBoolean flag that is true when the registrant has submitted electronically every Interactive Data File required to be submitted pursuant to Rule 405 of Regulation S-T during the preceding 12 months (or for such shorter period that the registrant was required to submit such files). Reference 1: http://www.xbrl.org/2003/role/presentationRef
-Publisher SEC
-Name Regulation S-T
-Number 232
-Section 405
| Name: |
dei_EntityInteractiveDataCurrent |
| Namespace Prefix: |
dei_ |
| Data Type: |
dei:yesNoItemType |
| Balance Type: |
na |
| Period Type: |
duration |
|
| X |
- DefinitionThe par value per share of security quoted in same currency as Trading currency. Example: '0.01'.
| Name: |
dei_EntityListingParValuePerShare |
| Namespace Prefix: |
dei_ |
| Data Type: |
dtr-types:perShareItemType |
| Balance Type: |
na |
| Period Type: |
duration |
|
| X |
- DefinitionThe aggregate market value of the voting and non-voting common equity held by non-affiliates computed by reference to the price at which the common equity was last sold, or the average bid and asked price of such common equity, as of the last business day of the registrant's most recently completed second fiscal quarter.
| Name: |
dei_EntityPublicFloat |
| Namespace Prefix: |
dei_ |
| Data Type: |
xbrli:monetaryItemType |
| Balance Type: |
credit |
| Period Type: |
instant |
|
| X |
- DefinitionThe exact name of the entity filing the report as specified in its charter, which is required by forms filed with the SEC. Reference 1: http://www.xbrl.org/2003/role/presentationRef
-Publisher SEC
-Name Exchange Act
-Number 240
-Section 12
-Subsection b-2
| Name: |
dei_EntityRegistrantName |
| Namespace Prefix: |
dei_ |
| Data Type: |
xbrli:normalizedStringItemType |
| Balance Type: |
na |
| Period Type: |
duration |
|
| X |
- DefinitionBoolean flag that is true when the registrant is a shell company as defined in Rule 12b-2 of the Exchange Act. Reference 1: http://www.xbrl.org/2003/role/presentationRef
-Publisher SEC
-Name Exchange Act
-Number 240
-Section 12
-Subsection b-2
| Name: |
dei_EntityShellCompany |
| Namespace Prefix: |
dei_ |
| Data Type: |
xbrli:booleanItemType |
| Balance Type: |
na |
| Period Type: |
duration |
|
| X |
- DefinitionIndicates that the company is a Smaller Reporting Company (SRC). Reference 1: http://www.xbrl.org/2003/role/presentationRef
-Publisher SEC
-Name Exchange Act
-Number 240
-Section 12
-Subsection b-2
| Name: |
dei_EntitySmallBusiness |
| Namespace Prefix: |
dei_ |
| Data Type: |
xbrli:booleanItemType |
| Balance Type: |
na |
| Period Type: |
duration |
|
| X |
- DefinitionThe Tax Identification Number (TIN), also known as an Employer Identification Number (EIN), is a unique 9-digit value assigned by the IRS. Reference 1: http://www.xbrl.org/2003/role/presentationRef
-Publisher SEC
-Name Exchange Act
-Number 240
-Section 12
-Subsection b-2
| Name: |
dei_EntityTaxIdentificationNumber |
| Namespace Prefix: |
dei_ |
| Data Type: |
dei:employerIdItemType |
| Balance Type: |
na |
| Period Type: |
duration |
|
| X |
- DefinitionIndicate 'Yes' or 'No' if the registrant is not required to file reports pursuant to Section 13 or Section 15(d) of the Act.
| Name: |
dei_EntityVoluntaryFilers |
| Namespace Prefix: |
dei_ |
| Data Type: |
dei:yesNoItemType |
| Balance Type: |
na |
| Period Type: |
duration |
|
| X |
- DefinitionIndicate 'Yes' or 'No' if the registrant is a well-known seasoned issuer, as defined in Rule 405 of the Securities Act. Is used on Form Type: 10-K, 10-Q, 8-K, 20-F, 6-K, 10-K/A, 10-Q/A, 20-F/A, 6-K/A, N-CSR, N-Q, N-1A. Reference 1: http://www.xbrl.org/2003/role/presentationRef
-Publisher SEC
-Name Securities Act
-Number 230
-Section 405
| Name: |
dei_EntityWellKnownSeasonedIssuer |
| Namespace Prefix: |
dei_ |
| Data Type: |
dei:yesNoItemType |
| Balance Type: |
na |
| Period Type: |
duration |
|
| X |
- ReferencesReference 1: http://www.xbrl.org/2003/role/presentationRef
-Publisher SEC
-Name Form 10-K
-Number 249
-Section 310
Reference 2: http://www.xbrl.org/2003/role/presentationRef
-Publisher SEC
-Name Form 20-F
-Number 249
-Section 220
-Subsection f
Reference 3: http://www.xbrl.org/2003/role/presentationRef
-Publisher SEC
-Name Form 40-F
-Number 249
-Section 240
-Subsection f
| Name: |
dei_IcfrAuditorAttestationFlag |
| Namespace Prefix: |
dei_ |
| Data Type: |
xbrli:booleanItemType |
| Balance Type: |
na |
| Period Type: |
duration |
|
| X |
- DefinitionLocal phone number for entity.
| Name: |
dei_LocalPhoneNumber |
| Namespace Prefix: |
dei_ |
| Data Type: |
xbrli:normalizedStringItemType |
| Balance Type: |
na |
| Period Type: |
duration |
|
| X |
- DefinitionTitle of a 12(b) registered security. Reference 1: http://www.xbrl.org/2003/role/presentationRef
-Publisher SEC
-Name Exchange Act
-Number 240
-Section 12
-Subsection b
| Name: |
dei_Security12bTitle |
| Namespace Prefix: |
dei_ |
| Data Type: |
dei:securityTitleItemType |
| Balance Type: |
na |
| Period Type: |
duration |
|
| X |
- DefinitionName of the Exchange on which a security is registered. Reference 1: http://www.xbrl.org/2003/role/presentationRef
-Publisher SEC
-Name Exchange Act
-Number 240
-Section 12
-Subsection d1-1
| Name: |
dei_SecurityExchangeName |
| Namespace Prefix: |
dei_ |
| Data Type: |
dei:edgarExchangeCodeItemType |
| Balance Type: |
na |
| Period Type: |
duration |
|
| X |
- DefinitionTrading symbol of an instrument as listed on an exchange.
| Name: |
dei_TradingSymbol |
| Namespace Prefix: |
dei_ |
| Data Type: |
dei:tradingSymbolItemType |
| Balance Type: |
na |
| Period Type: |
duration |
|
v3.25.0.1
Consolidated Balance Sheets - USD ($)
|
Dec. 31, 2024 |
Dec. 31, 2023 |
| CURRENT ASSETS |
|
|
| Cash |
$ 2,960,151
|
$ 4,059,182
|
| Accounts receivable – oil and gas sales |
75,074
|
71,736
|
| Prepaid expenses and other current assets |
175,866
|
35,244
|
| TOTAL CURRENT ASSETS |
3,211,091
|
4,166,162
|
| PROPERTY AND EQUIPMENT |
|
|
| Costs subject to amortization |
62,770,657
|
62,776,561
|
| Costs not being amortized |
|
|
| Office equipment |
90,004
|
90,004
|
| Total |
62,860,661
|
62,866,565
|
| Accumulated depletion, depreciation, amortization, and impairment |
(61,743,025)
|
(61,307,264)
|
| PROPERTY AND EQUIPMENT, NET |
1,117,636
|
1,559,301
|
| Equity investment – Hupecol Meta LLC |
|
4,505,358
|
| Right of use asset |
69,901
|
145,021
|
| Other assets |
3,167
|
3,167
|
| TOTAL ASSETS |
4,401,795
|
10,379,009
|
| CURRENT LIABILITIES |
|
|
| Accounts payable |
49,542
|
156,572
|
| Accrued expenses |
17,684
|
17,083
|
| Short-term lease liability |
71,082
|
75,276
|
| TOTAL CURRENT LIABILITIES |
138,308
|
248,931
|
| LONG-TERM LIABILITIES |
|
|
| Lease liability, net of current portion |
|
71,083
|
| Reserve for plugging and abandonment costs |
57,180
|
63,084
|
| TOTAL LONG-TERM LIABILITIES |
57,180
|
134,167
|
| TOTAL LIABILITIES |
195,488
|
383,098
|
| COMMITMENTS AND CONTINGENCIES |
|
|
| SHAREHOLDERS’ EQUITY |
|
|
| Common stock, par value $0.001; 20,000,000 shares authorized 13,086,533 and 10,906,353 shares issued and outstanding |
13,087
|
10,907
|
| Additional paid-in capital |
89,408,329
|
86,984,001
|
| Accumulated deficit |
(85,215,109)
|
(76,998,997)
|
| TOTAL SHAREHOLDERS’ EQUITY |
4,206,307
|
9,995,911
|
| TOTAL LIABILITIES AND SHAREHOLDERS’ EQUITY |
$ 4,401,795
|
$ 10,379,009
|
| X |
- DefinitionCosts not being amortized.
| Name: |
HUSA_CostsNotBeingAmortized |
| Namespace Prefix: |
HUSA_ |
| Data Type: |
xbrli:monetaryItemType |
| Balance Type: |
debit |
| Period Type: |
instant |
|
| X |
- DefinitionCosts subject to amortization.
| Name: |
HUSA_CostsSubjectToAmortization |
| Namespace Prefix: |
HUSA_ |
| Data Type: |
xbrli:monetaryItemType |
| Balance Type: |
debit |
| Period Type: |
instant |
|
| X |
- DefinitionCarrying value as of the balance sheet date of liabilities incurred (and for which invoices have typically been received) and payable to vendors for goods and services received that are used in an entity's business. Used to reflect the current portion of the liabilities (due within one year or within the normal operating cycle if longer). Reference 1: http://fasb.org/us-gaap/role/ref/legacyRef
-Topic 210
-SubTopic 10
-Name Accounting Standards Codification
-Section S99
-Paragraph 1
-Subparagraph (SX 210.5-02(19)(a))
-Publisher FASB
-URI https://asc.fasb.org/1943274/2147480566/210-10-S99-1
Reference 2: http://www.xbrl.org/2003/role/exampleRef
-Topic 852
-SubTopic 10
-Name Accounting Standards Codification
-Section 55
-Paragraph 10
-Publisher FASB
-URI https://asc.fasb.org/1943274/2147481372/852-10-55-10
| Name: |
us-gaap_AccountsPayableCurrent |
| Namespace Prefix: |
us-gaap_ |
| Data Type: |
xbrli:monetaryItemType |
| Balance Type: |
credit |
| Period Type: |
instant |
|
| X |
- DefinitionAmount, after allowance for credit loss, of right to consideration from customer for product sold and service rendered in normal course of business, classified as current. Reference 1: http://www.xbrl.org/2009/role/commonPracticeRef
-Topic 310
-SubTopic 10
-Name Accounting Standards Codification
-Section 45
-Paragraph 2
-Publisher FASB
-URI https://asc.fasb.org/1943274/2147481990/310-10-45-2
| Name: |
us-gaap_AccountsReceivableNetCurrent |
| Namespace Prefix: |
us-gaap_ |
| Data Type: |
xbrli:monetaryItemType |
| Balance Type: |
debit |
| Period Type: |
instant |
|
| X |
- DefinitionCarrying value as of the balance sheet date of obligations incurred and payable, pertaining to costs that are statutory in nature, are incurred on contractual obligations, or accumulate over time and for which invoices have not yet been received or will not be rendered. Examples include taxes, interest, rent and utilities. Used to reflect the current portion of the liabilities (due within one year or within the normal operating cycle if longer). Reference 1: http://fasb.org/us-gaap/role/ref/legacyRef
-Topic 210
-SubTopic 10
-Name Accounting Standards Codification
-Section S99
-Paragraph 1
-Subparagraph (SX 210.5-02(20))
-Publisher FASB
-URI https://asc.fasb.org/1943274/2147480566/210-10-S99-1
| Name: |
us-gaap_AccruedLiabilitiesCurrent |
| Namespace Prefix: |
us-gaap_ |
| Data Type: |
xbrli:monetaryItemType |
| Balance Type: |
credit |
| Period Type: |
instant |
|
| X |
- DefinitionAmount of accumulated depreciation, depletion and amortization for physical assets used in the normal conduct of business to produce goods and services. Reference 1: http://www.xbrl.org/2003/role/disclosureRef
-Topic 944
-SubTopic 210
-Name Accounting Standards Codification
-Section S99
-Paragraph 1
-Subparagraph (SX 210.7-03(a)(8)(b))
-Publisher FASB
-URI https://asc.fasb.org/1943274/2147478777/944-210-S99-1
Reference 2: http://www.xbrl.org/2003/role/disclosureRef
-Topic 210
-SubTopic 10
-Name Accounting Standards Codification
-Section S99
-Paragraph 1
-Subparagraph (SX 210.5-02(14))
-Publisher FASB
-URI https://asc.fasb.org/1943274/2147480566/210-10-S99-1
Reference 3: http://fasb.org/us-gaap/role/ref/legacyRef
-Name Accounting Standards Codification
-Topic 360
-SubTopic 10
-Section 50
-Paragraph 1
-Subparagraph (c)
-Publisher FASB
-URI https://asc.fasb.org/1943274/2147482099/360-10-50-1
| Name: |
us-gaap_AccumulatedDepreciationDepletionAndAmortizationPropertyPlantAndEquipment |
| Namespace Prefix: |
us-gaap_ |
| Data Type: |
xbrli:monetaryItemType |
| Balance Type: |
credit |
| Period Type: |
instant |
|
| X |
- DefinitionAmount of excess of issue price over par or stated value of stock and from other transaction involving stock or stockholder. Includes, but is not limited to, additional paid-in capital (APIC) for common and preferred stock. Reference 1: http://www.xbrl.org/2003/role/exampleRef
-Topic 852
-SubTopic 10
-Name Accounting Standards Codification
-Section 55
-Paragraph 10
-Publisher FASB
-URI https://asc.fasb.org/1943274/2147481372/852-10-55-10
Reference 2: http://www.xbrl.org/2009/role/commonPracticeRef
-Topic 946
-SubTopic 210
-Name Accounting Standards Codification
-Section S99
-Paragraph 1
-Subparagraph (SX 210.6-04(18))
-Publisher FASB
-URI https://asc.fasb.org/1943274/2147479170/946-210-S99-1
Reference 3: http://fasb.org/us-gaap/role/ref/legacyRef
-Topic 210
-SubTopic 10
-Name Accounting Standards Codification
-Section S99
-Paragraph 1
-Subparagraph (SX 210.5-02(30)(a)(1))
-Publisher FASB
-URI https://asc.fasb.org/1943274/2147480566/210-10-S99-1
| Name: |
us-gaap_AdditionalPaidInCapital |
| Namespace Prefix: |
us-gaap_ |
| Data Type: |
xbrli:monetaryItemType |
| Balance Type: |
credit |
| Period Type: |
instant |
|
| X |
- DefinitionNoncurrent portion of the carrying amount of a liability for an asset retirement obligation. An asset retirement obligation is a legal obligation associated with the disposal or retirement of a tangible long-lived asset that results from the acquisition, construction or development, or the normal operations of a long-lived asset, except for certain obligations of lessees. Reference 1: http://www.xbrl.org/2009/role/commonPracticeRef
-Topic 410
-SubTopic 20
-Name Accounting Standards Codification
-Section 50
-Paragraph 1
-Subparagraph (c)
-Publisher FASB
-URI https://asc.fasb.org/1943274/2147481850/410-20-50-1
| Name: |
us-gaap_AssetRetirementObligationsNoncurrent |
| Namespace Prefix: |
us-gaap_ |
| Data Type: |
xbrli:monetaryItemType |
| Balance Type: |
credit |
| Period Type: |
instant |
|
| X |
- DefinitionAmount of asset recognized for present right to economic benefit. Reference 1: http://www.xbrl.org/2003/role/exampleRef
-Topic 280
-SubTopic 10
-Name Accounting Standards Codification
-Section 55
-Paragraph 48
-Publisher FASB
-URI https://asc.fasb.org/1943274/2147482785/280-10-55-48
Reference 2: http://www.xbrl.org/2003/role/exampleRef
-Topic 280
-SubTopic 10
-Name Accounting Standards Codification
-Section 55
-Paragraph 49
-Publisher FASB
-URI https://asc.fasb.org/1943274/2147482785/280-10-55-49
Reference 3: http://www.xbrl.org/2003/role/disclosureRef
-Topic 270
-SubTopic 10
-Name Accounting Standards Codification
-Section 50
-Paragraph 1
-Subparagraph (i)
-Publisher FASB
-URI https://asc.fasb.org/1943274/2147482964/270-10-50-1
Reference 4: http://www.xbrl.org/2003/role/disclosureRef
-Topic 280
-SubTopic 10
-Name Accounting Standards Codification
-Section 50
-Paragraph 32
-Subparagraph (ee)
-Publisher FASB
-URI https://asc.fasb.org/1943274/2147482810/280-10-50-32
Reference 5: http://fasb.org/us-gaap/role/ref/otherTransitionRef
-Topic 280
-SubTopic 10
-Name Accounting Standards Codification
-Section 50
-Paragraph 32
-Subparagraph (d)
-Publisher FASB
-URI https://asc.fasb.org/1943274/2147482810/280-10-50-32
Reference 6: http://www.xbrl.org/2003/role/disclosureRef
-Topic 280
-SubTopic 10
-Name Accounting Standards Codification
-Section 50
-Paragraph 22
-Publisher FASB
-URI https://asc.fasb.org/1943274/2147482810/280-10-50-22
Reference 7: http://www.xbrl.org/2003/role/disclosureRef
-Topic 810
-SubTopic 10
-Name Accounting Standards Codification
-Section 50
-Paragraph 3
-Subparagraph (bb)
-Publisher FASB
-URI https://asc.fasb.org/1943274/2147481203/810-10-50-3
Reference 8: http://www.xbrl.org/2003/role/disclosureRef
-Topic 810
-SubTopic 10
-Name Accounting Standards Codification
-Section 45
-Paragraph 25
-Subparagraph (a)
-Publisher FASB
-URI https://asc.fasb.org/1943274/2147481231/810-10-45-25
Reference 9: http://www.xbrl.org/2003/role/disclosureRef
-Topic 235
-SubTopic 10
-Name Accounting Standards Codification
-Section S99
-Paragraph 1
-Subparagraph (SX 210.4-08(g)(1)(ii))
-Publisher FASB
-URI https://asc.fasb.org/1943274/2147480678/235-10-S99-1
Reference 10: http://www.xbrl.org/2003/role/disclosureRef
-Topic 323
-SubTopic 10
-Name Accounting Standards Codification
-Section 50
-Paragraph 3
-Subparagraph (c)
-Publisher FASB
-URI https://asc.fasb.org/1943274/2147481687/323-10-50-3
Reference 11: http://www.xbrl.org/2003/role/disclosureRef
-Topic 825
-SubTopic 10
-Name Accounting Standards Codification
-Section 50
-Paragraph 28
-Subparagraph (f)
-Publisher FASB
-URI https://asc.fasb.org/1943274/2147482907/825-10-50-28
Reference 12: http://www.xbrl.org/2003/role/exampleRef
-Topic 852
-SubTopic 10
-Name Accounting Standards Codification
-Section 55
-Paragraph 10
-Publisher FASB
-URI https://asc.fasb.org/1943274/2147481372/852-10-55-10
Reference 13: http://www.xbrl.org/2003/role/exampleRef
-Topic 946
-SubTopic 830
-Name Accounting Standards Codification
-Section 55
-Paragraph 12
-Publisher FASB
-URI https://asc.fasb.org/1943274/2147479168/946-830-55-12
Reference 14: http://www.xbrl.org/2003/role/disclosureRef
-Topic 944
-SubTopic 210
-Name Accounting Standards Codification
-Section S99
-Paragraph 1
-Subparagraph (SX 210.7-03(a)(12))
-Publisher FASB
-URI https://asc.fasb.org/1943274/2147478777/944-210-S99-1
Reference 15: http://www.xbrl.org/2003/role/disclosureRef
-Topic 946
-SubTopic 210
-Name Accounting Standards Codification
-Section S99
-Paragraph 1
-Subparagraph (SX 210.6-04(8))
-Publisher FASB
-URI https://asc.fasb.org/1943274/2147479170/946-210-S99-1
Reference 16: http://www.xbrl.org/2003/role/disclosureRef
-Topic 210
-SubTopic 10
-Name Accounting Standards Codification
-Section S99
-Paragraph 1
-Subparagraph (SX 210.5-02(18))
-Publisher FASB
-URI https://asc.fasb.org/1943274/2147480566/210-10-S99-1
Reference 17: http://www.xbrl.org/2003/role/disclosureRef
-Topic 470
-SubTopic 10
-Name Accounting Standards Codification
-Section S99
-Paragraph 1A
-Subparagraph (SX 210.13-01(a)(4)(i))
-Publisher FASB
-URI https://asc.fasb.org/1943274/2147480097/470-10-S99-1A
Reference 18: http://www.xbrl.org/2009/role/commonPracticeRef
-Topic 470
-SubTopic 10
-Name Accounting Standards Codification
-Section S99
-Paragraph 1A
-Subparagraph (SX 210.13-01(a)(4)(ii))
-Publisher FASB
-URI https://asc.fasb.org/1943274/2147480097/470-10-S99-1A
Reference 19: http://www.xbrl.org/2009/role/commonPracticeRef
-Topic 470
-SubTopic 10
-Name Accounting Standards Codification
-Section S99
-Paragraph 1A
-Subparagraph (SX 210.13-01(a)(4)(iii))
-Publisher FASB
-URI https://asc.fasb.org/1943274/2147480097/470-10-S99-1A
Reference 20: http://www.xbrl.org/2003/role/disclosureRef
-Topic 470
-SubTopic 10
-Name Accounting Standards Codification
-Section S99
-Paragraph 1A
-Subparagraph (SX 210.13-01(a)(4)(iii)(A))
-Publisher FASB
-URI https://asc.fasb.org/1943274/2147480097/470-10-S99-1A
Reference 21: http://www.xbrl.org/2003/role/disclosureRef
-Topic 470
-SubTopic 10
-Name Accounting Standards Codification
-Section S99
-Paragraph 1A
-Subparagraph (SX 210.13-01(a)(4)(iv))
-Publisher FASB
-URI https://asc.fasb.org/1943274/2147480097/470-10-S99-1A
Reference 22: http://www.xbrl.org/2003/role/disclosureRef
-Topic 470
-SubTopic 10
-Name Accounting Standards Codification
-Section S99
-Paragraph 1A
-Subparagraph (SX 210.13-01(a)(5))
-Publisher FASB
-URI https://asc.fasb.org/1943274/2147480097/470-10-S99-1A
Reference 23: http://www.xbrl.org/2003/role/disclosureRef
-Topic 470
-SubTopic 10
-Name Accounting Standards Codification
-Section S99
-Paragraph 1B
-Subparagraph (SX 210.13-02(a)(4)(i))
-Publisher FASB
-URI https://asc.fasb.org/1943274/2147480097/470-10-S99-1B
Reference 24: http://www.xbrl.org/2003/role/disclosureRef
-Topic 470
-SubTopic 10
-Name Accounting Standards Codification
-Section S99
-Paragraph 1B
-Subparagraph (SX 210.13-02(a)(4)(iii)(A))
-Publisher FASB
-URI https://asc.fasb.org/1943274/2147480097/470-10-S99-1B
Reference 25: http://www.xbrl.org/2003/role/disclosureRef
-Topic 470
-SubTopic 10
-Name Accounting Standards Codification
-Section S99
-Paragraph 1B
-Subparagraph (SX 210.13-02(a)(4)(iii)(B))
-Publisher FASB
-URI https://asc.fasb.org/1943274/2147480097/470-10-S99-1B
Reference 26: http://www.xbrl.org/2003/role/disclosureRef
-Topic 470
-SubTopic 10
-Name Accounting Standards Codification
-Section S99
-Paragraph 1B
-Subparagraph (SX 210.13-02(a)(4)(iv))
-Publisher FASB
-URI https://asc.fasb.org/1943274/2147480097/470-10-S99-1B
Reference 27: http://www.xbrl.org/2003/role/disclosureRef
-Topic 470
-SubTopic 10
-Name Accounting Standards Codification
-Section S99
-Paragraph 1B
-Subparagraph (SX 210.13-02(a)(5))
-Publisher FASB
-URI https://asc.fasb.org/1943274/2147480097/470-10-S99-1B
Reference 28: http://www.xbrl.org/2009/role/commonPracticeRef
-Topic 852
-SubTopic 10
-Name Accounting Standards Codification
-Section 50
-Paragraph 7
-Subparagraph (a)
-Publisher FASB
-URI https://asc.fasb.org/1943274/2147481404/852-10-50-7
Reference 29: http://www.xbrl.org/2003/role/disclosureRef
-Topic 280
-SubTopic 10
-Name Accounting Standards Codification
-Section 50
-Paragraph 30
-Subparagraph (c)
-Publisher FASB
-URI https://asc.fasb.org/1943274/2147482810/280-10-50-30
Reference 30: http://fasb.org/us-gaap/role/ref/legacyRef
-Topic 942
-SubTopic 210
-Name Accounting Standards Codification
-Section S99
-Paragraph 1
-Subparagraph (SX 210.9-03(11))
-Publisher FASB
-URI https://asc.fasb.org/1943274/2147478546/942-210-S99-1
| Name: |
us-gaap_Assets |
| Namespace Prefix: |
us-gaap_ |
| Data Type: |
xbrli:monetaryItemType |
| Balance Type: |
debit |
| Period Type: |
instant |
|
| X |
- DefinitionAmount of asset recognized for present right to economic benefit, classified as current. Reference 1: http://www.xbrl.org/2003/role/disclosureRef
-Topic 810
-SubTopic 10
-Name Accounting Standards Codification
-Section 50
-Paragraph 3
-Subparagraph (bb)
-Publisher FASB
-URI https://asc.fasb.org/1943274/2147481203/810-10-50-3
Reference 2: http://www.xbrl.org/2003/role/disclosureRef
-Topic 810
-SubTopic 10
-Name Accounting Standards Codification
-Section 45
-Paragraph 25
-Subparagraph (a)
-Publisher FASB
-URI https://asc.fasb.org/1943274/2147481231/810-10-45-25
Reference 3: http://www.xbrl.org/2003/role/disclosureRef
-Topic 235
-SubTopic 10
-Name Accounting Standards Codification
-Section S99
-Paragraph 1
-Subparagraph (SX 210.4-08(g)(1)(ii))
-Publisher FASB
-URI https://asc.fasb.org/1943274/2147480678/235-10-S99-1
Reference 4: http://www.xbrl.org/2003/role/disclosureRef
-Topic 323
-SubTopic 10
-Name Accounting Standards Codification
-Section 50
-Paragraph 3
-Subparagraph (c)
-Publisher FASB
-URI https://asc.fasb.org/1943274/2147481687/323-10-50-3
Reference 5: http://www.xbrl.org/2003/role/disclosureRef
-Topic 825
-SubTopic 10
-Name Accounting Standards Codification
-Section 50
-Paragraph 28
-Subparagraph (f)
-Publisher FASB
-URI https://asc.fasb.org/1943274/2147482907/825-10-50-28
Reference 6: http://www.xbrl.org/2003/role/exampleRef
-Topic 852
-SubTopic 10
-Name Accounting Standards Codification
-Section 55
-Paragraph 10
-Publisher FASB
-URI https://asc.fasb.org/1943274/2147481372/852-10-55-10
Reference 7: http://www.xbrl.org/2003/role/disclosureRef
-Topic 210
-SubTopic 10
-Name Accounting Standards Codification
-Section 45
-Paragraph 1
-Publisher FASB
-URI https://asc.fasb.org/1943274/2147483467/210-10-45-1
Reference 8: http://www.xbrl.org/2003/role/disclosureRef
-Topic 210
-SubTopic 10
-Name Accounting Standards Codification
-Section S99
-Paragraph 1
-Subparagraph (SX 210.5-02(9))
-Publisher FASB
-URI https://asc.fasb.org/1943274/2147480566/210-10-S99-1
Reference 9: http://www.xbrl.org/2003/role/disclosureRef
-Topic 470
-SubTopic 10
-Name Accounting Standards Codification
-Section S99
-Paragraph 1A
-Subparagraph (SX 210.13-01(a)(4)(i))
-Publisher FASB
-URI https://asc.fasb.org/1943274/2147480097/470-10-S99-1A
Reference 10: http://www.xbrl.org/2009/role/commonPracticeRef
-Topic 470
-SubTopic 10
-Name Accounting Standards Codification
-Section S99
-Paragraph 1A
-Subparagraph (SX 210.13-01(a)(4)(ii))
-Publisher FASB
-URI https://asc.fasb.org/1943274/2147480097/470-10-S99-1A
Reference 11: http://www.xbrl.org/2009/role/commonPracticeRef
-Topic 470
-SubTopic 10
-Name Accounting Standards Codification
-Section S99
-Paragraph 1A
-Subparagraph (SX 210.13-01(a)(4)(iii))
-Publisher FASB
-URI https://asc.fasb.org/1943274/2147480097/470-10-S99-1A
Reference 12: http://www.xbrl.org/2003/role/disclosureRef
-Topic 470
-SubTopic 10
-Name Accounting Standards Codification
-Section S99
-Paragraph 1A
-Subparagraph (SX 210.13-01(a)(4)(iii)(A))
-Publisher FASB
-URI https://asc.fasb.org/1943274/2147480097/470-10-S99-1A
Reference 13: http://www.xbrl.org/2003/role/disclosureRef
-Topic 470
-SubTopic 10
-Name Accounting Standards Codification
-Section S99
-Paragraph 1A
-Subparagraph (SX 210.13-01(a)(4)(iv))
-Publisher FASB
-URI https://asc.fasb.org/1943274/2147480097/470-10-S99-1A
Reference 14: http://www.xbrl.org/2003/role/disclosureRef
-Topic 470
-SubTopic 10
-Name Accounting Standards Codification
-Section S99
-Paragraph 1A
-Subparagraph (SX 210.13-01(a)(5))
-Publisher FASB
-URI https://asc.fasb.org/1943274/2147480097/470-10-S99-1A
Reference 15: http://www.xbrl.org/2003/role/disclosureRef
-Topic 470
-SubTopic 10
-Name Accounting Standards Codification
-Section S99
-Paragraph 1B
-Subparagraph (SX 210.13-02(a)(4)(i))
-Publisher FASB
-URI https://asc.fasb.org/1943274/2147480097/470-10-S99-1B
Reference 16: http://www.xbrl.org/2003/role/disclosureRef
-Topic 470
-SubTopic 10
-Name Accounting Standards Codification
-Section S99
-Paragraph 1B
-Subparagraph (SX 210.13-02(a)(4)(iii)(A))
-Publisher FASB
-URI https://asc.fasb.org/1943274/2147480097/470-10-S99-1B
Reference 17: http://www.xbrl.org/2003/role/disclosureRef
-Topic 470
-SubTopic 10
-Name Accounting Standards Codification
-Section S99
-Paragraph 1B
-Subparagraph (SX 210.13-02(a)(4)(iii)(B))
-Publisher FASB
-URI https://asc.fasb.org/1943274/2147480097/470-10-S99-1B
Reference 18: http://www.xbrl.org/2003/role/disclosureRef
-Topic 470
-SubTopic 10
-Name Accounting Standards Codification
-Section S99
-Paragraph 1B
-Subparagraph (SX 210.13-02(a)(4)(iv))
-Publisher FASB
-URI https://asc.fasb.org/1943274/2147480097/470-10-S99-1B
Reference 19: http://www.xbrl.org/2003/role/disclosureRef
-Topic 470
-SubTopic 10
-Name Accounting Standards Codification
-Section S99
-Paragraph 1B
-Subparagraph (SX 210.13-02(a)(5))
-Publisher FASB
-URI https://asc.fasb.org/1943274/2147480097/470-10-S99-1B
Reference 20: http://www.xbrl.org/2009/role/commonPracticeRef
-Topic 852
-SubTopic 10
-Name Accounting Standards Codification
-Section 50
-Paragraph 7
-Subparagraph (a)
-Publisher FASB
-URI https://asc.fasb.org/1943274/2147481404/852-10-50-7
| Name: |
us-gaap_AssetsCurrent |
| Namespace Prefix: |
us-gaap_ |
| Data Type: |
xbrli:monetaryItemType |
| Balance Type: |
debit |
| Period Type: |
instant |
|
| X |
- References
+ Details
| Name: |
us-gaap_AssetsCurrentAbstract |
| Namespace Prefix: |
us-gaap_ |
| Data Type: |
xbrli:stringItemType |
| Balance Type: |
na |
| Period Type: |
duration |
|
| X |
- DefinitionAmount of currency on hand as well as demand deposits with banks or financial institutions. Includes other kinds of accounts that have the general characteristics of demand deposits. Excludes cash and cash equivalents within disposal group and discontinued operation. Reference 1: http://www.xbrl.org/2003/role/exampleRef
-Topic 852
-SubTopic 10
-Name Accounting Standards Codification
-Section 55
-Paragraph 10
-Publisher FASB
-URI https://asc.fasb.org/1943274/2147481372/852-10-55-10
Reference 2: http://www.xbrl.org/2003/role/exampleRef
-Topic 946
-SubTopic 830
-Name Accounting Standards Codification
-Section 55
-Paragraph 12
-Publisher FASB
-URI https://asc.fasb.org/1943274/2147479168/946-830-55-12
Reference 3: http://www.xbrl.org/2003/role/disclosureRef
-Topic 944
-SubTopic 210
-Name Accounting Standards Codification
-Section S99
-Paragraph 1
-Subparagraph (SX 210.7-03(a)(2))
-Publisher FASB
-URI https://asc.fasb.org/1943274/2147478777/944-210-S99-1
Reference 4: http://www.xbrl.org/2003/role/disclosureRef
-Topic 946
-SubTopic 210
-Name Accounting Standards Codification
-Section S99
-Paragraph 1
-Subparagraph (SX 210.6-04(4))
-Publisher FASB
-URI https://asc.fasb.org/1943274/2147479170/946-210-S99-1
Reference 5: http://www.xbrl.org/2003/role/disclosureRef
-Topic 946
-SubTopic 210
-Name Accounting Standards Codification
-Section 45
-Paragraph 21
-Publisher FASB
-URI https://asc.fasb.org/1943274/2147477796/946-210-45-21
Reference 6: http://www.xbrl.org/2009/role/commonPracticeRef
-Topic 210
-SubTopic 10
-Name Accounting Standards Codification
-Section S99
-Paragraph 1
-Subparagraph (SX 210.5-02(1))
-Publisher FASB
-URI https://asc.fasb.org/1943274/2147480566/210-10-S99-1
Reference 7: http://www.xbrl.org/2003/role/disclosureRef
-Name Accounting Standards Codification
-Section 45
-Paragraph 20
-SubTopic 210
-Topic 946
-Publisher FASB
-URI https://asc.fasb.org/1943274/2147477796/946-210-45-20
| Name: |
us-gaap_Cash |
| Namespace Prefix: |
us-gaap_ |
| Data Type: |
xbrli:monetaryItemType |
| Balance Type: |
debit |
| Period Type: |
instant |
|
| X |
- DefinitionRepresents the caption on the face of the balance sheet to indicate that the entity has entered into (1) purchase or supply arrangements that will require expending a portion of its resources to meet the terms thereof, and (2) is exposed to potential losses or, less frequently, gains, arising from (a) possible claims against a company's resources due to future performance under contract terms, and (b) possible losses or likely gains from uncertainties that will ultimately be resolved when one or more future events that are deemed likely to occur do occur or fail to occur. Reference 1: http://fasb.org/us-gaap/role/ref/legacyRef
-Topic 942
-SubTopic 210
-Name Accounting Standards Codification
-Section S99
-Paragraph 1
-Subparagraph (SX 210.9-03(17))
-Publisher FASB
-URI https://asc.fasb.org/1943274/2147478546/942-210-S99-1
Reference 2: http://fasb.org/us-gaap/role/ref/legacyRef
-Topic 210
-SubTopic 10
-Name Accounting Standards Codification
-Section S99
-Paragraph 1
-Subparagraph (SX 210.5-02(25))
-Publisher FASB
-URI https://asc.fasb.org/1943274/2147480566/210-10-S99-1
Reference 3: http://www.xbrl.org/2003/role/disclosureRef
-Topic 944
-SubTopic 210
-Name Accounting Standards Codification
-Section S99
-Paragraph 1
-Subparagraph (SX 210.7-03(a)(19))
-Publisher FASB
-URI https://asc.fasb.org/1943274/2147478777/944-210-S99-1
Reference 4: http://www.xbrl.org/2003/role/disclosureRef
-Topic 946
-SubTopic 210
-Name Accounting Standards Codification
-Section S99
-Paragraph 1
-Subparagraph (SX 210.6-04(15))
-Publisher FASB
-URI https://asc.fasb.org/1943274/2147479170/946-210-S99-1
| Name: |
us-gaap_CommitmentsAndContingencies |
| Namespace Prefix: |
us-gaap_ |
| Data Type: |
xbrli:monetaryItemType |
| Balance Type: |
credit |
| Period Type: |
instant |
|
| X |
- DefinitionAggregate par or stated value of issued nonredeemable common stock (or common stock redeemable solely at the option of the issuer). This item includes treasury stock repurchased by the entity. Note: elements for number of nonredeemable common shares, par value and other disclosure concepts are in another section within stockholders' equity. Reference 1: http://fasb.org/us-gaap/role/ref/legacyRef
-Topic 210
-SubTopic 10
-Name Accounting Standards Codification
-Section S99
-Paragraph 1
-Subparagraph (SX 210.5-02(29))
-Publisher FASB
-URI https://asc.fasb.org/1943274/2147480566/210-10-S99-1
Reference 2: http://www.xbrl.org/2003/role/exampleRef
-Topic 852
-SubTopic 10
-Name Accounting Standards Codification
-Section 55
-Paragraph 10
-Publisher FASB
-URI https://asc.fasb.org/1943274/2147481372/852-10-55-10
Reference 3: http://www.xbrl.org/2003/role/disclosureRef
-Topic 944
-SubTopic 210
-Name Accounting Standards Codification
-Section S99
-Paragraph 1
-Subparagraph (SX 210.7-03(a)(22))
-Publisher FASB
-URI https://asc.fasb.org/1943274/2147478777/944-210-S99-1
| Name: |
us-gaap_CommonStockValue |
| Namespace Prefix: |
us-gaap_ |
| Data Type: |
xbrli:monetaryItemType |
| Balance Type: |
credit |
| Period Type: |
instant |
|
| X |
- DefinitionThis item represents the carrying amount on the entity's balance sheet of its investment in common stock of an equity method investee. This is not an indicator of the fair value of the investment, rather it is the initial cost adjusted for the entity's share of earnings and losses of the investee, adjusted for any distributions (dividends) and other than temporary impairment (OTTI) losses recognized. Reference 1: http://www.xbrl.org/2003/role/disclosureRef
-Topic 270
-SubTopic 10
-Name Accounting Standards Codification
-Section 50
-Paragraph 1
-Subparagraph (i)
-Publisher FASB
-URI https://asc.fasb.org/1943274/2147482964/270-10-50-1
Reference 2: http://www.xbrl.org/2003/role/disclosureRef
-Topic 280
-SubTopic 10
-Name Accounting Standards Codification
-Section 50
-Paragraph 32
-Subparagraph (ee)
-Publisher FASB
-URI https://asc.fasb.org/1943274/2147482810/280-10-50-32
Reference 3: http://www.xbrl.org/2003/role/disclosureRef
-Topic 323
-SubTopic 10
-Name Accounting Standards Codification
-Section 45
-Paragraph 1
-Publisher FASB
-URI https://asc.fasb.org/1943274/2147481664/323-10-45-1
Reference 4: http://www.xbrl.org/2009/role/commonPracticeRef
-Topic 323
-SubTopic 10
-Name Accounting Standards Codification
-Section 50
-Paragraph 3
-Subparagraph (a)(3)
-Publisher FASB
-URI https://asc.fasb.org/1943274/2147481687/323-10-50-3
Reference 5: http://www.xbrl.org/2009/role/commonPracticeRef
-Topic 210
-SubTopic 10
-Name Accounting Standards Codification
-Section S99
-Paragraph 1
-Subparagraph (SX 210.5-02(10))
-Publisher FASB
-URI https://asc.fasb.org/1943274/2147480566/210-10-S99-1
Reference 6: http://www.xbrl.org/2003/role/disclosureRef
-Topic 280
-SubTopic 10
-Name Accounting Standards Codification
-Section 50
-Paragraph 25
-Subparagraph (a)
-Publisher FASB
-URI https://asc.fasb.org/1943274/2147482810/280-10-50-25
| Name: |
us-gaap_EquityMethodInvestments |
| Namespace Prefix: |
us-gaap_ |
| Data Type: |
xbrli:monetaryItemType |
| Balance Type: |
debit |
| Period Type: |
instant |
|
| X |
- DefinitionAmount of liability recognized for present obligation requiring transfer or otherwise providing economic benefit to others. Reference 1: http://fasb.org/us-gaap/role/ref/legacyRef
-Name Accounting Standards Codification
-Section S99
-Paragraph 1
-Subparagraph (SX 210.5-02(22))
-SubTopic 10
-Topic 210
-Publisher FASB
-URI https://asc.fasb.org/1943274/2147480566/210-10-S99-1
Reference 2: http://fasb.org/us-gaap/role/ref/legacyRef
-Topic 210
-SubTopic 10
-Name Accounting Standards Codification
-Section S99
-Paragraph 1
-Subparagraph (SX 210.5-02(20))
-Publisher FASB
-URI https://asc.fasb.org/1943274/2147480566/210-10-S99-1
Reference 3: http://fasb.org/us-gaap/role/ref/legacyRef
-Topic 210
-SubTopic 10
-Name Accounting Standards Codification
-Section S99
-Paragraph 1
-Subparagraph (SX 210.5-02(24))
-Publisher FASB
-URI https://asc.fasb.org/1943274/2147480566/210-10-S99-1
Reference 4: http://fasb.org/us-gaap/role/ref/legacyRef
-Topic 210
-SubTopic 10
-Name Accounting Standards Codification
-Section S99
-Paragraph 1
-Subparagraph (SX 210.5-02(19))
-Publisher FASB
-URI https://asc.fasb.org/1943274/2147480566/210-10-S99-1
Reference 5: http://fasb.org/us-gaap/role/ref/legacyRef
-Topic 210
-SubTopic 10
-Name Accounting Standards Codification
-Section S99
-Paragraph 1
-Subparagraph (SX 210.5-02(25))
-Publisher FASB
-URI https://asc.fasb.org/1943274/2147480566/210-10-S99-1
Reference 6: http://fasb.org/us-gaap/role/ref/legacyRef
-Topic 210
-SubTopic 10
-Name Accounting Standards Codification
-Section S99
-Paragraph 1
-Subparagraph (SX 210.5-02(26))
-Publisher FASB
-URI https://asc.fasb.org/1943274/2147480566/210-10-S99-1
Reference 7: http://fasb.org/us-gaap/role/ref/legacyRef
-Topic 210
-SubTopic 10
-Name Accounting Standards Codification
-Section S99
-Paragraph 1
-Subparagraph (SX 210.5-02(23))
-Publisher FASB
-URI https://asc.fasb.org/1943274/2147480566/210-10-S99-1
Reference 8: http://fasb.org/us-gaap/role/ref/legacyRef
-Topic 210
-SubTopic 10
-Name Accounting Standards Codification
-Section S99
-Paragraph 1
-Subparagraph (SX 210.5-02(21))
-Publisher FASB
-URI https://asc.fasb.org/1943274/2147480566/210-10-S99-1
Reference 9: http://www.xbrl.org/2003/role/disclosureRef
-Topic 810
-SubTopic 10
-Name Accounting Standards Codification
-Section 50
-Paragraph 3
-Subparagraph (c)
-Publisher FASB
-URI https://asc.fasb.org/1943274/2147481203/810-10-50-3
Reference 10: http://www.xbrl.org/2003/role/disclosureRef
-Topic 810
-SubTopic 10
-Name Accounting Standards Codification
-Section 45
-Paragraph 25
-Subparagraph (b)
-Publisher FASB
-URI https://asc.fasb.org/1943274/2147481231/810-10-45-25
Reference 11: http://www.xbrl.org/2003/role/disclosureRef
-Topic 810
-SubTopic 10
-Name Accounting Standards Codification
-Section 50
-Paragraph 3
-Subparagraph (bb)
-Publisher FASB
-URI https://asc.fasb.org/1943274/2147481203/810-10-50-3
Reference 12: http://www.xbrl.org/2003/role/disclosureRef
-Topic 235
-SubTopic 10
-Name Accounting Standards Codification
-Section S99
-Paragraph 1
-Subparagraph (SX 210.4-08(g)(1)(ii))
-Publisher FASB
-URI https://asc.fasb.org/1943274/2147480678/235-10-S99-1
Reference 13: http://www.xbrl.org/2003/role/disclosureRef
-Topic 323
-SubTopic 10
-Name Accounting Standards Codification
-Section 50
-Paragraph 3
-Subparagraph (c)
-Publisher FASB
-URI https://asc.fasb.org/1943274/2147481687/323-10-50-3
Reference 14: http://www.xbrl.org/2003/role/disclosureRef
-Topic 825
-SubTopic 10
-Name Accounting Standards Codification
-Section 50
-Paragraph 28
-Subparagraph (f)
-Publisher FASB
-URI https://asc.fasb.org/1943274/2147482907/825-10-50-28
Reference 15: http://www.xbrl.org/2003/role/exampleRef
-Topic 946
-SubTopic 830
-Name Accounting Standards Codification
-Section 55
-Paragraph 12
-Publisher FASB
-URI https://asc.fasb.org/1943274/2147479168/946-830-55-12
Reference 16: http://www.xbrl.org/2003/role/disclosureRef
-Topic 946
-SubTopic 210
-Name Accounting Standards Codification
-Section S99
-Paragraph 1
-Subparagraph (SX 210.6-04(14))
-Publisher FASB
-URI https://asc.fasb.org/1943274/2147479170/946-210-S99-1
Reference 17: http://www.xbrl.org/2003/role/disclosureRef
-Topic 470
-SubTopic 10
-Name Accounting Standards Codification
-Section S99
-Paragraph 1A
-Subparagraph (SX 210.13-01(a)(4)(i))
-Publisher FASB
-URI https://asc.fasb.org/1943274/2147480097/470-10-S99-1A
Reference 18: http://www.xbrl.org/2009/role/commonPracticeRef
-Topic 470
-SubTopic 10
-Name Accounting Standards Codification
-Section S99
-Paragraph 1A
-Subparagraph (SX 210.13-01(a)(4)(ii))
-Publisher FASB
-URI https://asc.fasb.org/1943274/2147480097/470-10-S99-1A
Reference 19: http://www.xbrl.org/2003/role/disclosureRef
-Topic 470
-SubTopic 10
-Name Accounting Standards Codification
-Section S99
-Paragraph 1A
-Subparagraph (SX 210.13-01(a)(4)(iii)(A))
-Publisher FASB
-URI https://asc.fasb.org/1943274/2147480097/470-10-S99-1A
Reference 20: http://www.xbrl.org/2003/role/disclosureRef
-Topic 470
-SubTopic 10
-Name Accounting Standards Codification
-Section S99
-Paragraph 1A
-Subparagraph (SX 210.13-01(a)(4)(iv))
-Publisher FASB
-URI https://asc.fasb.org/1943274/2147480097/470-10-S99-1A
Reference 21: http://www.xbrl.org/2003/role/disclosureRef
-Topic 470
-SubTopic 10
-Name Accounting Standards Codification
-Section S99
-Paragraph 1A
-Subparagraph (SX 210.13-01(a)(5))
-Publisher FASB
-URI https://asc.fasb.org/1943274/2147480097/470-10-S99-1A
Reference 22: http://www.xbrl.org/2003/role/disclosureRef
-Topic 470
-SubTopic 10
-Name Accounting Standards Codification
-Section S99
-Paragraph 1B
-Subparagraph (SX 210.13-02(a)(4)(i))
-Publisher FASB
-URI https://asc.fasb.org/1943274/2147480097/470-10-S99-1B
Reference 23: http://www.xbrl.org/2003/role/disclosureRef
-Topic 470
-SubTopic 10
-Name Accounting Standards Codification
-Section S99
-Paragraph 1B
-Subparagraph (SX 210.13-02(a)(4)(iii)(A))
-Publisher FASB
-URI https://asc.fasb.org/1943274/2147480097/470-10-S99-1B
Reference 24: http://www.xbrl.org/2003/role/disclosureRef
-Topic 470
-SubTopic 10
-Name Accounting Standards Codification
-Section S99
-Paragraph 1B
-Subparagraph (SX 210.13-02(a)(4)(iii)(B))
-Publisher FASB
-URI https://asc.fasb.org/1943274/2147480097/470-10-S99-1B
Reference 25: http://www.xbrl.org/2003/role/disclosureRef
-Topic 470
-SubTopic 10
-Name Accounting Standards Codification
-Section S99
-Paragraph 1B
-Subparagraph (SX 210.13-02(a)(4)(iv))
-Publisher FASB
-URI https://asc.fasb.org/1943274/2147480097/470-10-S99-1B
Reference 26: http://www.xbrl.org/2003/role/disclosureRef
-Topic 470
-SubTopic 10
-Name Accounting Standards Codification
-Section S99
-Paragraph 1B
-Subparagraph (SX 210.13-02(a)(5))
-Publisher FASB
-URI https://asc.fasb.org/1943274/2147480097/470-10-S99-1B
Reference 27: http://www.xbrl.org/2009/role/commonPracticeRef
-Topic 852
-SubTopic 10
-Name Accounting Standards Codification
-Section 50
-Paragraph 7
-Subparagraph (a)
-Publisher FASB
-URI https://asc.fasb.org/1943274/2147481404/852-10-50-7
Reference 28: http://www.xbrl.org/2009/role/commonPracticeRef
-Topic 852
-SubTopic 10
-Name Accounting Standards Codification
-Section 50
-Paragraph 7
-Subparagraph (b)
-Publisher FASB
-URI https://asc.fasb.org/1943274/2147481404/852-10-50-7
Reference 29: http://www.xbrl.org/2003/role/exampleRef
-Topic 280
-SubTopic 10
-Name Accounting Standards Codification
-Section 50
-Paragraph 30
-Subparagraph (d)
-Publisher FASB
-URI https://asc.fasb.org/1943274/2147482810/280-10-50-30
| Name: |
us-gaap_Liabilities |
| Namespace Prefix: |
us-gaap_ |
| Data Type: |
xbrli:monetaryItemType |
| Balance Type: |
credit |
| Period Type: |
instant |
|
| X |
- DefinitionAmount of liabilities and equity items, including the portion of equity attributable to noncontrolling interests, if any. Reference 1: http://www.xbrl.org/2003/role/exampleRef
-Topic 852
-SubTopic 10
-Name Accounting Standards Codification
-Section 55
-Paragraph 10
-Publisher FASB
-URI https://asc.fasb.org/1943274/2147481372/852-10-55-10
Reference 2: http://www.xbrl.org/2003/role/disclosureRef
-Topic 944
-SubTopic 210
-Name Accounting Standards Codification
-Section S99
-Paragraph 1
-Subparagraph (SX 210.7-03(a)(25))
-Publisher FASB
-URI https://asc.fasb.org/1943274/2147478777/944-210-S99-1
Reference 3: http://www.xbrl.org/2009/role/commonPracticeRef
-Topic 235
-SubTopic 10
-Name Accounting Standards Codification
-Section S99
-Paragraph 1
-Subparagraph (SX 210.4-08(g)(1)(ii))
-Publisher FASB
-URI https://asc.fasb.org/1943274/2147480678/235-10-S99-1
Reference 4: http://www.xbrl.org/2009/role/commonPracticeRef
-Topic 323
-SubTopic 10
-Name Accounting Standards Codification
-Section 50
-Paragraph 3
-Subparagraph (c)
-Publisher FASB
-URI https://asc.fasb.org/1943274/2147481687/323-10-50-3
Reference 5: http://www.xbrl.org/2009/role/commonPracticeRef
-Topic 825
-SubTopic 10
-Name Accounting Standards Codification
-Section 50
-Paragraph 28
-Subparagraph (f)
-Publisher FASB
-URI https://asc.fasb.org/1943274/2147482907/825-10-50-28
Reference 6: http://fasb.org/us-gaap/role/ref/legacyRef
-Topic 942
-SubTopic 210
-Name Accounting Standards Codification
-Section S99
-Paragraph 1
-Subparagraph (SX 210.9-03(23))
-Publisher FASB
-URI https://asc.fasb.org/1943274/2147478546/942-210-S99-1
Reference 7: http://fasb.org/us-gaap/role/ref/legacyRef
-Topic 210
-SubTopic 10
-Name Accounting Standards Codification
-Section S99
-Paragraph 1
-Subparagraph (SX 210.5-02(32))
-Publisher FASB
-URI https://asc.fasb.org/1943274/2147480566/210-10-S99-1
| Name: |
us-gaap_LiabilitiesAndStockholdersEquity |
| Namespace Prefix: |
us-gaap_ |
| Data Type: |
xbrli:monetaryItemType |
| Balance Type: |
credit |
| Period Type: |
instant |
|
| X |
- DefinitionTotal obligations incurred as part of normal operations that are expected to be paid during the following twelve months or within one business cycle, if longer. Reference 1: http://fasb.org/us-gaap/role/ref/legacyRef
-Topic 210
-SubTopic 10
-Name Accounting Standards Codification
-Section S99
-Paragraph 1
-Subparagraph (SX 210.5-02(21))
-Publisher FASB
-URI https://asc.fasb.org/1943274/2147480566/210-10-S99-1
Reference 2: http://www.xbrl.org/2003/role/disclosureRef
-Topic 810
-SubTopic 10
-Name Accounting Standards Codification
-Section 50
-Paragraph 3
-Subparagraph (c)
-Publisher FASB
-URI https://asc.fasb.org/1943274/2147481203/810-10-50-3
Reference 3: http://www.xbrl.org/2003/role/disclosureRef
-Topic 810
-SubTopic 10
-Name Accounting Standards Codification
-Section 45
-Paragraph 25
-Subparagraph (b)
-Publisher FASB
-URI https://asc.fasb.org/1943274/2147481231/810-10-45-25
Reference 4: http://www.xbrl.org/2003/role/disclosureRef
-Topic 810
-SubTopic 10
-Name Accounting Standards Codification
-Section 50
-Paragraph 3
-Subparagraph (bb)
-Publisher FASB
-URI https://asc.fasb.org/1943274/2147481203/810-10-50-3
Reference 5: http://www.xbrl.org/2003/role/disclosureRef
-Topic 235
-SubTopic 10
-Name Accounting Standards Codification
-Section S99
-Paragraph 1
-Subparagraph (SX 210.4-08(g)(1)(ii))
-Publisher FASB
-URI https://asc.fasb.org/1943274/2147480678/235-10-S99-1
Reference 6: http://www.xbrl.org/2003/role/disclosureRef
-Topic 323
-SubTopic 10
-Name Accounting Standards Codification
-Section 50
-Paragraph 3
-Subparagraph (c)
-Publisher FASB
-URI https://asc.fasb.org/1943274/2147481687/323-10-50-3
Reference 7: http://www.xbrl.org/2003/role/disclosureRef
-Topic 825
-SubTopic 10
-Name Accounting Standards Codification
-Section 50
-Paragraph 28
-Subparagraph (f)
-Publisher FASB
-URI https://asc.fasb.org/1943274/2147482907/825-10-50-28
Reference 8: http://www.xbrl.org/2003/role/exampleRef
-Topic 852
-SubTopic 10
-Name Accounting Standards Codification
-Section 55
-Paragraph 10
-Publisher FASB
-URI https://asc.fasb.org/1943274/2147481372/852-10-55-10
Reference 9: http://www.xbrl.org/2003/role/disclosureRef
-Topic 210
-SubTopic 10
-Name Accounting Standards Codification
-Section 45
-Paragraph 5
-Publisher FASB
-URI https://asc.fasb.org/1943274/2147483467/210-10-45-5
Reference 10: http://www.xbrl.org/2003/role/disclosureRef
-Topic 470
-SubTopic 10
-Name Accounting Standards Codification
-Section S99
-Paragraph 1A
-Subparagraph (SX 210.13-01(a)(4)(i))
-Publisher FASB
-URI https://asc.fasb.org/1943274/2147480097/470-10-S99-1A
Reference 11: http://www.xbrl.org/2009/role/commonPracticeRef
-Topic 470
-SubTopic 10
-Name Accounting Standards Codification
-Section S99
-Paragraph 1A
-Subparagraph (SX 210.13-01(a)(4)(ii))
-Publisher FASB
-URI https://asc.fasb.org/1943274/2147480097/470-10-S99-1A
Reference 12: http://www.xbrl.org/2003/role/disclosureRef
-Topic 470
-SubTopic 10
-Name Accounting Standards Codification
-Section S99
-Paragraph 1A
-Subparagraph (SX 210.13-01(a)(4)(iii)(A))
-Publisher FASB
-URI https://asc.fasb.org/1943274/2147480097/470-10-S99-1A
Reference 13: http://www.xbrl.org/2003/role/disclosureRef
-Topic 470
-SubTopic 10
-Name Accounting Standards Codification
-Section S99
-Paragraph 1A
-Subparagraph (SX 210.13-01(a)(4)(iv))
-Publisher FASB
-URI https://asc.fasb.org/1943274/2147480097/470-10-S99-1A
Reference 14: http://www.xbrl.org/2003/role/disclosureRef
-Topic 470
-SubTopic 10
-Name Accounting Standards Codification
-Section S99
-Paragraph 1A
-Subparagraph (SX 210.13-01(a)(5))
-Publisher FASB
-URI https://asc.fasb.org/1943274/2147480097/470-10-S99-1A
Reference 15: http://www.xbrl.org/2003/role/disclosureRef
-Topic 470
-SubTopic 10
-Name Accounting Standards Codification
-Section S99
-Paragraph 1B
-Subparagraph (SX 210.13-02(a)(4)(i))
-Publisher FASB
-URI https://asc.fasb.org/1943274/2147480097/470-10-S99-1B
Reference 16: http://www.xbrl.org/2003/role/disclosureRef
-Topic 470
-SubTopic 10
-Name Accounting Standards Codification
-Section S99
-Paragraph 1B
-Subparagraph (SX 210.13-02(a)(4)(iii)(A))
-Publisher FASB
-URI https://asc.fasb.org/1943274/2147480097/470-10-S99-1B
Reference 17: http://www.xbrl.org/2003/role/disclosureRef
-Topic 470
-SubTopic 10
-Name Accounting Standards Codification
-Section S99
-Paragraph 1B
-Subparagraph (SX 210.13-02(a)(4)(iii)(B))
-Publisher FASB
-URI https://asc.fasb.org/1943274/2147480097/470-10-S99-1B
Reference 18: http://www.xbrl.org/2003/role/disclosureRef
-Topic 470
-SubTopic 10
-Name Accounting Standards Codification
-Section S99
-Paragraph 1B
-Subparagraph (SX 210.13-02(a)(4)(iv))
-Publisher FASB
-URI https://asc.fasb.org/1943274/2147480097/470-10-S99-1B
Reference 19: http://www.xbrl.org/2003/role/disclosureRef
-Topic 470
-SubTopic 10
-Name Accounting Standards Codification
-Section S99
-Paragraph 1B
-Subparagraph (SX 210.13-02(a)(5))
-Publisher FASB
-URI https://asc.fasb.org/1943274/2147480097/470-10-S99-1B
Reference 20: http://www.xbrl.org/2009/role/commonPracticeRef
-Topic 852
-SubTopic 10
-Name Accounting Standards Codification
-Section 50
-Paragraph 7
-Subparagraph (a)
-Publisher FASB
-URI https://asc.fasb.org/1943274/2147481404/852-10-50-7
Reference 21: http://www.xbrl.org/2009/role/commonPracticeRef
-Topic 852
-SubTopic 10
-Name Accounting Standards Codification
-Section 50
-Paragraph 7
-Subparagraph (b)
-Publisher FASB
-URI https://asc.fasb.org/1943274/2147481404/852-10-50-7
| Name: |
us-gaap_LiabilitiesCurrent |
| Namespace Prefix: |
us-gaap_ |
| Data Type: |
xbrli:monetaryItemType |
| Balance Type: |
credit |
| Period Type: |
instant |
|
| X |
- References
+ Details
| Name: |
us-gaap_LiabilitiesCurrentAbstract |
| Namespace Prefix: |
us-gaap_ |
| Data Type: |
xbrli:stringItemType |
| Balance Type: |
na |
| Period Type: |
duration |
|
| X |
- DefinitionAmount of obligation due after one year or beyond the normal operating cycle, if longer. Reference 1: http://fasb.org/us-gaap/role/ref/legacyRef
-Name Accounting Standards Codification
-Section S99
-Paragraph 1
-Subparagraph (SX 210.5-02(22))
-SubTopic 10
-Topic 210
-Publisher FASB
-URI https://asc.fasb.org/1943274/2147480566/210-10-S99-1
Reference 2: http://fasb.org/us-gaap/role/ref/legacyRef
-Topic 210
-SubTopic 10
-Name Accounting Standards Codification
-Section S99
-Paragraph 1
-Subparagraph (SX 210.5-02(24))
-Publisher FASB
-URI https://asc.fasb.org/1943274/2147480566/210-10-S99-1
Reference 3: http://fasb.org/us-gaap/role/ref/legacyRef
-Topic 210
-SubTopic 10
-Name Accounting Standards Codification
-Section S99
-Paragraph 1
-Subparagraph (SX 210.5-02(25))
-Publisher FASB
-URI https://asc.fasb.org/1943274/2147480566/210-10-S99-1
Reference 4: http://fasb.org/us-gaap/role/ref/legacyRef
-Topic 210
-SubTopic 10
-Name Accounting Standards Codification
-Section S99
-Paragraph 1
-Subparagraph (SX 210.5-02(26))
-Publisher FASB
-URI https://asc.fasb.org/1943274/2147480566/210-10-S99-1
Reference 5: http://fasb.org/us-gaap/role/ref/legacyRef
-Topic 210
-SubTopic 10
-Name Accounting Standards Codification
-Section S99
-Paragraph 1
-Subparagraph (SX 210.5-02(23))
-Publisher FASB
-URI https://asc.fasb.org/1943274/2147480566/210-10-S99-1
Reference 6: http://www.xbrl.org/2003/role/disclosureRef
-Topic 810
-SubTopic 10
-Name Accounting Standards Codification
-Section 50
-Paragraph 3
-Subparagraph (c)
-Publisher FASB
-URI https://asc.fasb.org/1943274/2147481203/810-10-50-3
Reference 7: http://www.xbrl.org/2003/role/disclosureRef
-Topic 810
-SubTopic 10
-Name Accounting Standards Codification
-Section 45
-Paragraph 25
-Subparagraph (b)
-Publisher FASB
-URI https://asc.fasb.org/1943274/2147481231/810-10-45-25
Reference 8: http://www.xbrl.org/2003/role/disclosureRef
-Topic 810
-SubTopic 10
-Name Accounting Standards Codification
-Section 50
-Paragraph 3
-Subparagraph (bb)
-Publisher FASB
-URI https://asc.fasb.org/1943274/2147481203/810-10-50-3
Reference 9: http://www.xbrl.org/2003/role/disclosureRef
-Topic 235
-SubTopic 10
-Name Accounting Standards Codification
-Section S99
-Paragraph 1
-Subparagraph (SX 210.4-08(g)(1)(ii))
-Publisher FASB
-URI https://asc.fasb.org/1943274/2147480678/235-10-S99-1
Reference 10: http://www.xbrl.org/2003/role/disclosureRef
-Topic 323
-SubTopic 10
-Name Accounting Standards Codification
-Section 50
-Paragraph 3
-Subparagraph (c)
-Publisher FASB
-URI https://asc.fasb.org/1943274/2147481687/323-10-50-3
Reference 11: http://www.xbrl.org/2003/role/disclosureRef
-Topic 825
-SubTopic 10
-Name Accounting Standards Codification
-Section 50
-Paragraph 28
-Subparagraph (f)
-Publisher FASB
-URI https://asc.fasb.org/1943274/2147482907/825-10-50-28
Reference 12: http://www.xbrl.org/2003/role/disclosureRef
-Topic 470
-SubTopic 10
-Name Accounting Standards Codification
-Section S99
-Paragraph 1A
-Subparagraph (SX 210.13-01(a)(4)(i))
-Publisher FASB
-URI https://asc.fasb.org/1943274/2147480097/470-10-S99-1A
Reference 13: http://www.xbrl.org/2009/role/commonPracticeRef
-Topic 470
-SubTopic 10
-Name Accounting Standards Codification
-Section S99
-Paragraph 1A
-Subparagraph (SX 210.13-01(a)(4)(ii))
-Publisher FASB
-URI https://asc.fasb.org/1943274/2147480097/470-10-S99-1A
Reference 14: http://www.xbrl.org/2003/role/disclosureRef
-Topic 470
-SubTopic 10
-Name Accounting Standards Codification
-Section S99
-Paragraph 1A
-Subparagraph (SX 210.13-01(a)(4)(iii)(A))
-Publisher FASB
-URI https://asc.fasb.org/1943274/2147480097/470-10-S99-1A
Reference 15: http://www.xbrl.org/2003/role/disclosureRef
-Topic 470
-SubTopic 10
-Name Accounting Standards Codification
-Section S99
-Paragraph 1A
-Subparagraph (SX 210.13-01(a)(4)(iv))
-Publisher FASB
-URI https://asc.fasb.org/1943274/2147480097/470-10-S99-1A
Reference 16: http://www.xbrl.org/2003/role/disclosureRef
-Topic 470
-SubTopic 10
-Name Accounting Standards Codification
-Section S99
-Paragraph 1A
-Subparagraph (SX 210.13-01(a)(5))
-Publisher FASB
-URI https://asc.fasb.org/1943274/2147480097/470-10-S99-1A
Reference 17: http://www.xbrl.org/2003/role/disclosureRef
-Topic 470
-SubTopic 10
-Name Accounting Standards Codification
-Section S99
-Paragraph 1B
-Subparagraph (SX 210.13-02(a)(4)(i))
-Publisher FASB
-URI https://asc.fasb.org/1943274/2147480097/470-10-S99-1B
Reference 18: http://www.xbrl.org/2003/role/disclosureRef
-Topic 470
-SubTopic 10
-Name Accounting Standards Codification
-Section S99
-Paragraph 1B
-Subparagraph (SX 210.13-02(a)(4)(iii)(A))
-Publisher FASB
-URI https://asc.fasb.org/1943274/2147480097/470-10-S99-1B
Reference 19: http://www.xbrl.org/2003/role/disclosureRef
-Topic 470
-SubTopic 10
-Name Accounting Standards Codification
-Section S99
-Paragraph 1B
-Subparagraph (SX 210.13-02(a)(4)(iii)(B))
-Publisher FASB
-URI https://asc.fasb.org/1943274/2147480097/470-10-S99-1B
Reference 20: http://www.xbrl.org/2003/role/disclosureRef
-Topic 470
-SubTopic 10
-Name Accounting Standards Codification
-Section S99
-Paragraph 1B
-Subparagraph (SX 210.13-02(a)(4)(iv))
-Publisher FASB
-URI https://asc.fasb.org/1943274/2147480097/470-10-S99-1B
Reference 21: http://www.xbrl.org/2003/role/disclosureRef
-Topic 470
-SubTopic 10
-Name Accounting Standards Codification
-Section S99
-Paragraph 1B
-Subparagraph (SX 210.13-02(a)(5))
-Publisher FASB
-URI https://asc.fasb.org/1943274/2147480097/470-10-S99-1B
Reference 22: http://www.xbrl.org/2009/role/commonPracticeRef
-Topic 852
-SubTopic 10
-Name Accounting Standards Codification
-Section 50
-Paragraph 7
-Subparagraph (a)
-Publisher FASB
-URI https://asc.fasb.org/1943274/2147481404/852-10-50-7
Reference 23: http://www.xbrl.org/2009/role/commonPracticeRef
-Topic 852
-SubTopic 10
-Name Accounting Standards Codification
-Section 50
-Paragraph 7
-Subparagraph (b)
-Publisher FASB
-URI https://asc.fasb.org/1943274/2147481404/852-10-50-7
| Name: |
us-gaap_LiabilitiesNoncurrent |
| Namespace Prefix: |
us-gaap_ |
| Data Type: |
xbrli:monetaryItemType |
| Balance Type: |
credit |
| Period Type: |
instant |
|
| X |
- References
+ Details
| Name: |
us-gaap_LiabilitiesNoncurrentAbstract |
| Namespace Prefix: |
us-gaap_ |
| Data Type: |
xbrli:stringItemType |
| Balance Type: |
na |
| Period Type: |
duration |
|
| X |
- DefinitionAmount before accumulated depreciation of tangible personal property used to produce goods and services, including, but is not limited to, tools, dies and molds, computer and office equipment. Reference 1: http://fasb.org/us-gaap/role/ref/legacyRef
-Topic 360
-SubTopic 10
-Name Accounting Standards Codification
-Section 50
-Paragraph 1
-Subparagraph (b)
-Publisher FASB
-URI https://asc.fasb.org/1943274/2147482099/360-10-50-1
| Name: |
us-gaap_MachineryAndEquipmentGross |
| Namespace Prefix: |
us-gaap_ |
| Data Type: |
xbrli:monetaryItemType |
| Balance Type: |
debit |
| Period Type: |
instant |
|
| X |
- DefinitionPresent value of lessee's discounted obligation for lease payments from operating lease, classified as current. Reference 1: http://www.xbrl.org/2003/role/disclosureRef
-Topic 842
-SubTopic 20
-Name Accounting Standards Codification
-Section 45
-Paragraph 1
-Subparagraph (b)
-Publisher FASB
-URI https://asc.fasb.org/1943274/2147479041/842-20-45-1
| Name: |
us-gaap_OperatingLeaseLiabilityCurrent |
| Namespace Prefix: |
us-gaap_ |
| Data Type: |
xbrli:monetaryItemType |
| Balance Type: |
credit |
| Period Type: |
instant |
|
| X |
- DefinitionPresent value of lessee's discounted obligation for lease payments from operating lease, classified as noncurrent. Reference 1: http://www.xbrl.org/2003/role/disclosureRef
-Topic 842
-SubTopic 20
-Name Accounting Standards Codification
-Section 45
-Paragraph 1
-Subparagraph (b)
-Publisher FASB
-URI https://asc.fasb.org/1943274/2147479041/842-20-45-1
| Name: |
us-gaap_OperatingLeaseLiabilityNoncurrent |
| Namespace Prefix: |
us-gaap_ |
| Data Type: |
xbrli:monetaryItemType |
| Balance Type: |
credit |
| Period Type: |
instant |
|
| X |
- DefinitionAmount of lessee's right to use underlying asset under operating lease. Reference 1: http://www.xbrl.org/2003/role/disclosureRef
-Topic 842
-SubTopic 20
-Name Accounting Standards Codification
-Section 45
-Paragraph 1
-Subparagraph (a)
-Publisher FASB
-URI https://asc.fasb.org/1943274/2147479041/842-20-45-1
| Name: |
us-gaap_OperatingLeaseRightOfUseAsset |
| Namespace Prefix: |
us-gaap_ |
| Data Type: |
xbrli:monetaryItemType |
| Balance Type: |
debit |
| Period Type: |
instant |
|
| X |
- DefinitionAmount of noncurrent assets classified as other. Reference 1: http://www.xbrl.org/2003/role/disclosureRef
-Topic 210
-SubTopic 10
-Name Accounting Standards Codification
-Section S99
-Paragraph 1
-Subparagraph (SX 210.5-02(17))
-Publisher FASB
-URI https://asc.fasb.org/1943274/2147480566/210-10-S99-1
| Name: |
us-gaap_OtherAssetsNoncurrent |
| Namespace Prefix: |
us-gaap_ |
| Data Type: |
xbrli:monetaryItemType |
| Balance Type: |
debit |
| Period Type: |
instant |
|
| X |
- DefinitionAmount of asset related to consideration paid in advance for costs that provide economic benefits in future periods, and amount of other assets that are expected to be realized or consumed within one year or the normal operating cycle, if longer. Reference 1: http://www.xbrl.org/2009/role/commonPracticeRef
-Topic 210
-SubTopic 10
-Name Accounting Standards Codification
-Section S99
-Paragraph 1
-Subparagraph (SX 210.5-02(9))
-Publisher FASB
-URI https://asc.fasb.org/1943274/2147480566/210-10-S99-1
| Name: |
us-gaap_PrepaidExpenseAndOtherAssetsCurrent |
| Namespace Prefix: |
us-gaap_ |
| Data Type: |
xbrli:monetaryItemType |
| Balance Type: |
debit |
| Period Type: |
instant |
|
| X |
- DefinitionAmount before accumulated depreciation, depletion and amortization of physical assets used in the normal conduct of business and not intended for resale. Examples include, but are not limited to, land, buildings, machinery and equipment, office equipment, and furniture and fixtures. Reference 1: http://www.xbrl.org/2003/role/disclosureRef
-Topic 944
-SubTopic 210
-Name Accounting Standards Codification
-Section S99
-Paragraph 1
-Subparagraph (SX 210.7-03(a)(8))
-Publisher FASB
-URI https://asc.fasb.org/1943274/2147478777/944-210-S99-1
Reference 2: http://www.xbrl.org/2003/role/disclosureRef
-Topic 210
-SubTopic 10
-Name Accounting Standards Codification
-Section S99
-Paragraph 1
-Subparagraph (SX 210.5-02(13))
-Publisher FASB
-URI https://asc.fasb.org/1943274/2147480566/210-10-S99-1
Reference 3: http://fasb.org/us-gaap/role/ref/legacyRef
-Topic 360
-SubTopic 10
-Name Accounting Standards Codification
-Section 50
-Paragraph 1
-Subparagraph (b)
-Publisher FASB
-URI https://asc.fasb.org/1943274/2147482099/360-10-50-1
| Name: |
us-gaap_PropertyPlantAndEquipmentGross |
| Namespace Prefix: |
us-gaap_ |
| Data Type: |
xbrli:monetaryItemType |
| Balance Type: |
debit |
| Period Type: |
instant |
|
| X |
- DefinitionAmount after accumulated depreciation, depletion and amortization of physical assets used in the normal conduct of business to produce goods and services and not intended for resale. Examples include, but are not limited to, land, buildings, machinery and equipment, office equipment, and furniture and fixtures. Reference 1: http://fasb.org/us-gaap/role/ref/legacyRef
-Name Accounting Standards Codification
-Section 50
-Paragraph 1
-SubTopic 10
-Topic 360
-Publisher FASB
-URI https://asc.fasb.org/1943274/2147482099/360-10-50-1
Reference 2: http://www.xbrl.org/2003/role/disclosureRef
-Topic 842
-SubTopic 20
-Name Accounting Standards Codification
-Section 50
-Paragraph 7A
-Subparagraph (a)
-Publisher FASB
-URI https://asc.fasb.org/1943274/2147478964/842-20-50-7A
Reference 3: http://www.xbrl.org/2003/role/exampleRef
-Topic 852
-SubTopic 10
-Name Accounting Standards Codification
-Section 55
-Paragraph 10
-Publisher FASB
-URI https://asc.fasb.org/1943274/2147481372/852-10-55-10
Reference 4: http://www.xbrl.org/2003/role/disclosureRef
-Topic 944
-SubTopic 210
-Name Accounting Standards Codification
-Section S99
-Paragraph 1
-Subparagraph (SX 210.7-03(a)(8))
-Publisher FASB
-URI https://asc.fasb.org/1943274/2147478777/944-210-S99-1
Reference 5: http://www.xbrl.org/2003/role/disclosureRef
-Topic 942
-SubTopic 360
-Name Accounting Standards Codification
-Section 50
-Paragraph 1
-Publisher FASB
-URI https://asc.fasb.org/1943274/2147478451/942-360-50-1
| Name: |
us-gaap_PropertyPlantAndEquipmentNet |
| Namespace Prefix: |
us-gaap_ |
| Data Type: |
xbrli:monetaryItemType |
| Balance Type: |
debit |
| Period Type: |
instant |
|
| X |
- References
+ Details
| Name: |
us-gaap_PropertyPlantAndEquipmentNetAbstract |
| Namespace Prefix: |
us-gaap_ |
| Data Type: |
xbrli:stringItemType |
| Balance Type: |
na |
| Period Type: |
duration |
|
| X |
- DefinitionAmount of accumulated undistributed earnings (deficit). Reference 1: http://fasb.org/us-gaap/role/ref/legacyRef
-Topic 210
-SubTopic 10
-Name Accounting Standards Codification
-Section S99
-Paragraph 1
-Subparagraph (SX 210.5-02(30)(a)(3))
-Publisher FASB
-URI https://asc.fasb.org/1943274/2147480566/210-10-S99-1
Reference 2: http://www.xbrl.org/2003/role/exampleRef
-Topic 852
-SubTopic 10
-Name Accounting Standards Codification
-Section 55
-Paragraph 10
-Publisher FASB
-URI https://asc.fasb.org/1943274/2147481372/852-10-55-10
Reference 3: http://www.xbrl.org/2003/role/disclosureRef
-Topic 944
-SubTopic 40
-Name Accounting Standards Codification
-Section 65
-Paragraph 2
-Subparagraph (g)(2)(i)
-Publisher FASB
-URI https://asc.fasb.org/1943274/2147480016/944-40-65-2
Reference 4: http://www.xbrl.org/2003/role/disclosureRef
-Topic 944
-SubTopic 40
-Name Accounting Standards Codification
-Section 65
-Paragraph 2
-Subparagraph (h)(2)
-Publisher FASB
-URI https://asc.fasb.org/1943274/2147480016/944-40-65-2
Reference 5: http://www.xbrl.org/2003/role/disclosureRef
-Topic 946
-SubTopic 20
-Name Accounting Standards Codification
-Section 50
-Paragraph 11
-Publisher FASB
-URI https://asc.fasb.org/1943274/2147480990/946-20-50-11
Reference 6: http://www.xbrl.org/2003/role/disclosureRef
-Topic 944
-SubTopic 210
-Name Accounting Standards Codification
-Section S99
-Paragraph 1
-Subparagraph (SX 210.7-03(a)(23)(a)(4))
-Publisher FASB
-URI https://asc.fasb.org/1943274/2147478777/944-210-S99-1
Reference 7: http://www.xbrl.org/2003/role/disclosureRef
-Topic 946
-SubTopic 210
-Name Accounting Standards Codification
-Section S99
-Paragraph 1
-Subparagraph (SX 210.6-04(17))
-Publisher FASB
-URI https://asc.fasb.org/1943274/2147479170/946-210-S99-1
Reference 8: http://fasb.org/us-gaap/role/ref/legacyRef
-Topic 505
-SubTopic 10
-Name Accounting Standards Codification
-Section S99
-Paragraph 1
-Subparagraph (SX 210.3-04)
-Publisher FASB
-URI https://asc.fasb.org/1943274/2147480008/505-10-S99-1
| Name: |
us-gaap_RetainedEarningsAccumulatedDeficit |
| Namespace Prefix: |
us-gaap_ |
| Data Type: |
xbrli:monetaryItemType |
| Balance Type: |
credit |
| Period Type: |
instant |
|
| X |
- DefinitionAmount of equity (deficit) attributable to parent. Excludes temporary equity and equity attributable to noncontrolling interest. Reference 1: http://fasb.org/us-gaap/role/ref/legacyRef
-Topic 210
-SubTopic 10
-Name Accounting Standards Codification
-Section S99
-Paragraph 1
-Subparagraph (SX 210.5-02(29))
-Publisher FASB
-URI https://asc.fasb.org/1943274/2147480566/210-10-S99-1
Reference 2: http://fasb.org/us-gaap/role/ref/legacyRef
-Topic 210
-SubTopic 10
-Name Accounting Standards Codification
-Section S99
-Paragraph 1
-Subparagraph (SX 210.5-02(30))
-Publisher FASB
-URI https://asc.fasb.org/1943274/2147480566/210-10-S99-1
Reference 3: http://fasb.org/us-gaap/role/ref/legacyRef
-Topic 210
-SubTopic 10
-Name Accounting Standards Codification
-Section S99
-Paragraph 1
-Subparagraph (SX 210.5-02(31))
-Publisher FASB
-URI https://asc.fasb.org/1943274/2147480566/210-10-S99-1
Reference 4: http://www.xbrl.org/2003/role/exampleRef
-Topic 852
-SubTopic 10
-Name Accounting Standards Codification
-Section 55
-Paragraph 10
-Publisher FASB
-URI https://asc.fasb.org/1943274/2147481372/852-10-55-10
Reference 5: http://www.xbrl.org/2003/role/exampleRef
-Topic 946
-SubTopic 830
-Name Accounting Standards Codification
-Section 55
-Paragraph 12
-Publisher FASB
-URI https://asc.fasb.org/1943274/2147479168/946-830-55-12
Reference 6: http://www.xbrl.org/2003/role/disclosureRef
-Topic 946
-SubTopic 210
-Name Accounting Standards Codification
-Section S99
-Paragraph 1
-Subparagraph (SX 210.6-04(19))
-Publisher FASB
-URI https://asc.fasb.org/1943274/2147479170/946-210-S99-1
Reference 7: http://www.xbrl.org/2003/role/disclosureRef
-Topic 946
-SubTopic 210
-Name Accounting Standards Codification
-Section S99
-Paragraph 2
-Subparagraph (SX 210.6-05(4))
-Publisher FASB
-URI https://asc.fasb.org/1943274/2147479170/946-210-S99-2
Reference 8: http://www.xbrl.org/2009/role/commonPracticeRef
-Topic 946
-SubTopic 220
-Name Accounting Standards Codification
-Section S99
-Paragraph 3
-Subparagraph (SX 210.6-09(4)(b))
-Publisher FASB
-URI https://asc.fasb.org/1943274/2147479134/946-220-S99-3
Reference 9: http://www.xbrl.org/2003/role/disclosureRef
-Topic 946
-SubTopic 220
-Name Accounting Standards Codification
-Section S99
-Paragraph 3
-Subparagraph (SX 210.6-09(6))
-Publisher FASB
-URI https://asc.fasb.org/1943274/2147479134/946-220-S99-3
Reference 10: http://www.xbrl.org/2003/role/disclosureRef
-Topic 946
-SubTopic 220
-Name Accounting Standards Codification
-Section S99
-Paragraph 3
-Subparagraph (SX 210.6-09(7))
-Publisher FASB
-URI https://asc.fasb.org/1943274/2147479134/946-220-S99-3
Reference 11: http://www.xbrl.org/2009/role/commonPracticeRef
-Topic 235
-SubTopic 10
-Name Accounting Standards Codification
-Section S99
-Paragraph 1
-Subparagraph (SX 210.4-08(g)(1)(ii))
-Publisher FASB
-URI https://asc.fasb.org/1943274/2147480678/235-10-S99-1
Reference 12: http://www.xbrl.org/2009/role/commonPracticeRef
-Topic 323
-SubTopic 10
-Name Accounting Standards Codification
-Section 50
-Paragraph 3
-Subparagraph (c)
-Publisher FASB
-URI https://asc.fasb.org/1943274/2147481687/323-10-50-3
Reference 13: http://www.xbrl.org/2009/role/commonPracticeRef
-Topic 825
-SubTopic 10
-Name Accounting Standards Codification
-Section 50
-Paragraph 28
-Subparagraph (f)
-Publisher FASB
-URI https://asc.fasb.org/1943274/2147482907/825-10-50-28
Reference 14: http://fasb.org/us-gaap/role/ref/legacyRef
-Topic 310
-SubTopic 10
-Name Accounting Standards Codification
-Section S99
-Paragraph 2
-Subparagraph (SAB Topic 4.E)
-Publisher FASB
-URI https://asc.fasb.org/1943274/2147480418/310-10-S99-2
| Name: |
us-gaap_StockholdersEquity |
| Namespace Prefix: |
us-gaap_ |
| Data Type: |
xbrli:monetaryItemType |
| Balance Type: |
credit |
| Period Type: |
instant |
|
| X |
- References
+ Details
| Name: |
us-gaap_StockholdersEquityAbstract |
| Namespace Prefix: |
us-gaap_ |
| Data Type: |
xbrli:stringItemType |
| Balance Type: |
na |
| Period Type: |
duration |
|
v3.25.0.1
Consolidated Balance Sheets (Parenthetical) - $ / shares
|
Dec. 31, 2024 |
Dec. 31, 2023 |
| Statement of Financial Position [Abstract] |
|
|
| Common stock, par value |
$ 0.001
|
$ 0.001
|
| Common stock, shares authorized |
20,000,000
|
20,000,000
|
| Common stock, shares issued |
13,086,533
|
10,906,353
|
| Common stock, shares outstanding |
13,086,533
|
10,906,353
|
| X |
- DefinitionFace amount or stated value per share of common stock. Reference 1: http://fasb.org/us-gaap/role/ref/legacyRef
-Topic 210
-SubTopic 10
-Name Accounting Standards Codification
-Section S99
-Paragraph 1
-Subparagraph (SX 210.5-02(29))
-Publisher FASB
-URI https://asc.fasb.org/1943274/2147480566/210-10-S99-1
| Name: |
us-gaap_CommonStockParOrStatedValuePerShare |
| Namespace Prefix: |
us-gaap_ |
| Data Type: |
dtr-types:perShareItemType |
| Balance Type: |
na |
| Period Type: |
instant |
|
| X |
- DefinitionThe maximum number of common shares permitted to be issued by an entity's charter and bylaws. Reference 1: http://fasb.org/us-gaap/role/ref/legacyRef
-Topic 210
-SubTopic 10
-Name Accounting Standards Codification
-Section S99
-Paragraph 1
-Subparagraph (SX 210.5-02(29))
-Publisher FASB
-URI https://asc.fasb.org/1943274/2147480566/210-10-S99-1
Reference 2: http://www.xbrl.org/2003/role/disclosureRef
-Topic 946
-SubTopic 210
-Name Accounting Standards Codification
-Section S99
-Paragraph 1
-Subparagraph (SX 210.6-04(16)(a))
-Publisher FASB
-URI https://asc.fasb.org/1943274/2147479170/946-210-S99-1
| Name: |
us-gaap_CommonStockSharesAuthorized |
| Namespace Prefix: |
us-gaap_ |
| Data Type: |
xbrli:sharesItemType |
| Balance Type: |
na |
| Period Type: |
instant |
|
| X |
- DefinitionTotal number of common shares of an entity that have been sold or granted to shareholders (includes common shares that were issued, repurchased and remain in the treasury). These shares represent capital invested by the firm's shareholders and owners, and may be all or only a portion of the number of shares authorized. Shares issued include shares outstanding and shares held in the treasury. Reference 1: http://fasb.org/us-gaap/role/ref/legacyRef
-Topic 210
-SubTopic 10
-Name Accounting Standards Codification
-Section S99
-Paragraph 1
-Subparagraph (SX 210.5-02(29))
-Publisher FASB
-URI https://asc.fasb.org/1943274/2147480566/210-10-S99-1
| Name: |
us-gaap_CommonStockSharesIssued |
| Namespace Prefix: |
us-gaap_ |
| Data Type: |
xbrli:sharesItemType |
| Balance Type: |
na |
| Period Type: |
instant |
|
| X |
- DefinitionNumber of shares of common stock outstanding. Common stock represent the ownership interest in a corporation. Reference 1: http://fasb.org/us-gaap/role/ref/legacyRef
-Name Accounting Standards Codification
-Section 50
-Paragraph 2
-SubTopic 10
-Topic 505
-Publisher FASB
-URI https://asc.fasb.org/1943274/2147481112/505-10-50-2
Reference 2: http://fasb.org/us-gaap/role/ref/legacyRef
-Topic 210
-SubTopic 10
-Name Accounting Standards Codification
-Section S99
-Paragraph 1
-Subparagraph (SX 210.5-02(29))
-Publisher FASB
-URI https://asc.fasb.org/1943274/2147480566/210-10-S99-1
Reference 3: http://www.xbrl.org/2003/role/disclosureRef
-Topic 946
-SubTopic 210
-Name Accounting Standards Codification
-Section S99
-Paragraph 2
-Subparagraph (SX 210.6-05(4))
-Publisher FASB
-URI https://asc.fasb.org/1943274/2147479170/946-210-S99-2
Reference 4: http://www.xbrl.org/2009/role/commonPracticeRef
-Topic 946
-SubTopic 220
-Name Accounting Standards Codification
-Section S99
-Paragraph 3
-Subparagraph (SX 210.6-09(4)(b))
-Publisher FASB
-URI https://asc.fasb.org/1943274/2147479134/946-220-S99-3
Reference 5: http://www.xbrl.org/2003/role/disclosureRef
-Topic 946
-SubTopic 210
-Name Accounting Standards Codification
-Section S99
-Paragraph 1
-Subparagraph (SX 210.6-04(16)(a))
-Publisher FASB
-URI https://asc.fasb.org/1943274/2147479170/946-210-S99-1
Reference 6: http://www.xbrl.org/2009/role/commonPracticeRef
-Topic 946
-SubTopic 220
-Name Accounting Standards Codification
-Section S99
-Paragraph 3
-Subparagraph (SX 210.6-09(7))
-Publisher FASB
-URI https://asc.fasb.org/1943274/2147479134/946-220-S99-3
| Name: |
us-gaap_CommonStockSharesOutstanding |
| Namespace Prefix: |
us-gaap_ |
| Data Type: |
xbrli:sharesItemType |
| Balance Type: |
na |
| Period Type: |
instant |
|
| X |
- References
+ Details
| Name: |
us-gaap_StatementOfFinancialPositionAbstract |
| Namespace Prefix: |
us-gaap_ |
| Data Type: |
xbrli:stringItemType |
| Balance Type: |
na |
| Period Type: |
duration |
|
v3.25.0.1
Consolidated Statements of Operations - USD ($)
|
12 Months Ended |
Dec. 31, 2024 |
Dec. 31, 2023 |
| REVENUES |
|
|
| Oil and gas revenue |
$ 560,180
|
$ 794,027
|
| Total operating revenue |
560,180
|
794,027
|
| EXPENSES OF OPERATIONS |
|
|
| Lease operating expense and severance tax |
747,559
|
473,925
|
| General and administrative expense |
2,224,559
|
1,852,559
|
| Depreciation and depletion |
160,001
|
167,527
|
| Loss on disposal of oil and gas properties – Colombia |
|
2,343,126
|
| Impairment expense – oil and gas properties |
275,760
|
537,686
|
| Impairment expense – equity investment in Hupecol Meta LLC |
6,392,874
|
|
| Total operating expenses |
9,800,753
|
5,374,823
|
| Loss from operations |
(9,240,573)
|
(4,580,796)
|
| OTHER INCOME |
|
|
| Interest income |
101,742
|
148,565
|
| Other income |
922,719
|
1,220,954
|
| Total other income |
1,024,461
|
1,369,519
|
| Net loss before taxes |
(8,216,112)
|
(3,211,277)
|
| Income tax expense (benefit) |
|
|
| Net loss |
$ (8,216,112)
|
$ (3,211,277)
|
| Basic net loss per common share outstanding |
$ (0.73)
|
$ (0.30)
|
| Diluted net loss per common share outstanding |
$ (0.73)
|
$ (0.30)
|
| Basic weighted average number of common shares outstanding |
11,288,019
|
10,783,731
|
| Diluted weighted average number of common shares outstanding |
11,288,019
|
10,783,731
|
| X |
- DefinitionImpairment charges on equity method investments.
| Name: |
HUSA_ImpairmentChargesOnEquityMethodInvestments |
| Namespace Prefix: |
HUSA_ |
| Data Type: |
xbrli:monetaryItemType |
| Balance Type: |
debit |
| Period Type: |
duration |
|
| X |
- DefinitionAmount of write-down of assets recognized in the income statement. Includes, but is not limited to, losses from tangible assets, intangible assets and goodwill. Reference 1: http://fasb.org/us-gaap/role/ref/legacyRef
-Name Accounting Standards Codification
-Section 45
-Paragraph 28
-Subparagraph (b)
-SubTopic 10
-Topic 230
-Publisher FASB
-URI https://asc.fasb.org/1943274/2147482740/230-10-45-28
Reference 2: http://fasb.org/us-gaap/role/ref/legacyRef
-Name Accounting Standards Codification
-Topic 360
-SubTopic 10
-Section 45
-Paragraph 4
-Publisher FASB
-URI https://asc.fasb.org/1943274/2147482130/360-10-45-4
| Name: |
us-gaap_AssetImpairmentCharges |
| Namespace Prefix: |
us-gaap_ |
| Data Type: |
xbrli:monetaryItemType |
| Balance Type: |
debit |
| Period Type: |
duration |
|
| X |
- DefinitionThe aggregate expense recognized in the current period that allocates the cost of tangible assets, intangible assets, or depleting assets to periods that benefit from use of the assets. Reference 1: http://fasb.org/us-gaap/role/ref/legacyRef
-Name Accounting Standards Codification
-Section 45
-Paragraph 28
-Subparagraph (b)
-SubTopic 10
-Topic 230
-Publisher FASB
-URI https://asc.fasb.org/1943274/2147482740/230-10-45-28
Reference 2: http://www.xbrl.org/2003/role/exampleRef
-Topic 280
-SubTopic 10
-Name Accounting Standards Codification
-Section 55
-Paragraph 48
-Publisher FASB
-URI https://asc.fasb.org/1943274/2147482785/280-10-55-48
Reference 3: http://www.xbrl.org/2003/role/exampleRef
-Topic 280
-SubTopic 10
-Name Accounting Standards Codification
-Section 55
-Paragraph 49
-Publisher FASB
-URI https://asc.fasb.org/1943274/2147482785/280-10-55-49
Reference 4: http://www.xbrl.org/2003/role/disclosureRef
-Topic 270
-SubTopic 10
-Name Accounting Standards Codification
-Section 50
-Paragraph 1
-Subparagraph (i)
-Publisher FASB
-URI https://asc.fasb.org/1943274/2147482964/270-10-50-1
Reference 5: http://www.xbrl.org/2003/role/disclosureRef
-Topic 280
-SubTopic 10
-Name Accounting Standards Codification
-Section 50
-Paragraph 32
-Subparagraph (ee)
-Publisher FASB
-URI https://asc.fasb.org/1943274/2147482810/280-10-50-32
Reference 6: http://www.xbrl.org/2003/role/disclosureRef
-Topic 280
-SubTopic 10
-Name Accounting Standards Codification
-Section 50
-Paragraph 22
-Subparagraph (e)
-Publisher FASB
-URI https://asc.fasb.org/1943274/2147482810/280-10-50-22
| Name: |
us-gaap_DepreciationDepletionAndAmortization |
| Namespace Prefix: |
us-gaap_ |
| Data Type: |
xbrli:monetaryItemType |
| Balance Type: |
debit |
| Period Type: |
duration |
|
| X |
- DefinitionThe amount of net income (loss) for the period per each share of common stock or unit outstanding during the reporting period. Reference 1: http://www.xbrl.org/2003/role/disclosureRef
-Topic 250
-SubTopic 10
-Name Accounting Standards Codification
-Section 50
-Paragraph 6
-Publisher FASB
-URI https://asc.fasb.org/1943274/2147483443/250-10-50-6
Reference 2: http://www.xbrl.org/2003/role/exampleRef
-Topic 260
-SubTopic 10
-Name Accounting Standards Codification
-Section 55
-Paragraph 52
-Publisher FASB
-URI https://asc.fasb.org/1943274/2147482635/260-10-55-52
Reference 3: http://www.xbrl.org/2003/role/disclosureRef
-Topic 805
-SubTopic 60
-Name Accounting Standards Codification
-Section 65
-Paragraph 1
-Subparagraph (g)
-Publisher FASB
-URI https://asc.fasb.org/1943274/2147476176/805-60-65-1
Reference 4: http://www.xbrl.org/2003/role/disclosureRef
-Topic 740
-SubTopic 323
-Name Accounting Standards Codification
-Section 65
-Paragraph 2
-Subparagraph (g)(3)
-Publisher FASB
-URI https://asc.fasb.org/1943274/2147478666/740-323-65-2
Reference 5: http://www.xbrl.org/2003/role/disclosureRef
-Topic 250
-SubTopic 10
-Name Accounting Standards Codification
-Section 50
-Paragraph 3
-Publisher FASB
-URI https://asc.fasb.org/1943274/2147483443/250-10-50-3
Reference 6: http://www.xbrl.org/2003/role/disclosureRef
-Topic 260
-SubTopic 10
-Name Accounting Standards Codification
-Section 55
-Paragraph 15
-Publisher FASB
-URI https://asc.fasb.org/1943274/2147482635/260-10-55-15
Reference 7: http://www.xbrl.org/2003/role/disclosureRef
-Topic 815
-SubTopic 40
-Name Accounting Standards Codification
-Section 65
-Paragraph 1
-Subparagraph (e)(4)
-Publisher FASB
-URI https://asc.fasb.org/1943274/2147480175/815-40-65-1
Reference 8: http://www.xbrl.org/2003/role/disclosureRef
-Topic 815
-SubTopic 40
-Name Accounting Standards Codification
-Section 65
-Paragraph 1
-Subparagraph (f)
-Publisher FASB
-URI https://asc.fasb.org/1943274/2147480175/815-40-65-1
Reference 9: http://www.xbrl.org/2003/role/disclosureRef
-Topic 250
-SubTopic 10
-Name Accounting Standards Codification
-Section 50
-Paragraph 11
-Subparagraph (a)
-Publisher FASB
-URI https://asc.fasb.org/1943274/2147483443/250-10-50-11
Reference 10: http://www.xbrl.org/2003/role/disclosureRef
-Topic 250
-SubTopic 10
-Name Accounting Standards Codification
-Section 50
-Paragraph 11
-Subparagraph (b)
-Publisher FASB
-URI https://asc.fasb.org/1943274/2147483443/250-10-50-11
Reference 11: http://www.xbrl.org/2003/role/disclosureRef
-Topic 250
-SubTopic 10
-Name Accounting Standards Codification
-Section 50
-Paragraph 7
-Subparagraph (a)
-Publisher FASB
-URI https://asc.fasb.org/1943274/2147483443/250-10-50-7
Reference 12: http://www.xbrl.org/2003/role/disclosureRef
-Topic 260
-SubTopic 10
-Name Accounting Standards Codification
-Section 45
-Paragraph 2
-Publisher FASB
-URI https://asc.fasb.org/1943274/2147482689/260-10-45-2
Reference 13: http://www.xbrl.org/2003/role/disclosureRef
-Topic 260
-SubTopic 10
-Name Accounting Standards Codification
-Section 45
-Paragraph 60B
-Subparagraph (d)
-Publisher FASB
-URI https://asc.fasb.org/1943274/2147482689/260-10-45-60B
Reference 14: http://www.xbrl.org/2003/role/disclosureRef
-Topic 250
-SubTopic 10
-Name Accounting Standards Codification
-Section 50
-Paragraph 4
-Publisher FASB
-URI https://asc.fasb.org/1943274/2147483443/250-10-50-4
Reference 15: http://www.xbrl.org/2003/role/disclosureRef
-Topic 260
-SubTopic 10
-Name Accounting Standards Codification
-Section 50
-Paragraph 1
-Subparagraph (a)
-Publisher FASB
-URI https://asc.fasb.org/1943274/2147482662/260-10-50-1
Reference 16: http://www.xbrl.org/2003/role/disclosureRef
-Topic 260
-SubTopic 10
-Name Accounting Standards Codification
-Section 45
-Paragraph 10
-Publisher FASB
-URI https://asc.fasb.org/1943274/2147482689/260-10-45-10
Reference 17: http://www.xbrl.org/2003/role/disclosureRef
-Topic 220
-SubTopic 10
-Name Accounting Standards Codification
-Section S99
-Paragraph 2
-Subparagraph (SX 210.5-03(25))
-Publisher FASB
-URI https://asc.fasb.org/1943274/2147483621/220-10-S99-2
Reference 18: http://www.xbrl.org/2003/role/disclosureRef
-Topic 942
-SubTopic 220
-Name Accounting Standards Codification
-Section S99
-Paragraph 1
-Subparagraph (SX 210.9-04(27))
-Publisher FASB
-URI https://asc.fasb.org/1943274/2147478524/942-220-S99-1
Reference 19: http://www.xbrl.org/2003/role/disclosureRef
-Topic 944
-SubTopic 220
-Name Accounting Standards Codification
-Section S99
-Paragraph 1
-Subparagraph (SX 210.7-04(23))
-Publisher FASB
-URI https://asc.fasb.org/1943274/2147477250/944-220-S99-1
Reference 20: http://www.xbrl.org/2003/role/disclosureRef
-Topic 260
-SubTopic 10
-Name Accounting Standards Codification
-Section 45
-Paragraph 7
-Publisher FASB
-URI https://asc.fasb.org/1943274/2147482689/260-10-45-7
| Name: |
us-gaap_EarningsPerShareBasic |
| Namespace Prefix: |
us-gaap_ |
| Data Type: |
dtr-types:perShareItemType |
| Balance Type: |
na |
| Period Type: |
duration |
|
| X |
- DefinitionThe amount of net income (loss) for the period available to each share of common stock or common unit outstanding during the reporting period and to each share or unit that would have been outstanding assuming the issuance of common shares or units for all dilutive potential common shares or units outstanding during the reporting period. Reference 1: http://www.xbrl.org/2003/role/disclosureRef
-Topic 250
-SubTopic 10
-Name Accounting Standards Codification
-Section 50
-Paragraph 6
-Publisher FASB
-URI https://asc.fasb.org/1943274/2147483443/250-10-50-6
Reference 2: http://www.xbrl.org/2003/role/exampleRef
-Topic 260
-SubTopic 10
-Name Accounting Standards Codification
-Section 55
-Paragraph 52
-Publisher FASB
-URI https://asc.fasb.org/1943274/2147482635/260-10-55-52
Reference 3: http://www.xbrl.org/2003/role/disclosureRef
-Topic 805
-SubTopic 60
-Name Accounting Standards Codification
-Section 65
-Paragraph 1
-Subparagraph (g)
-Publisher FASB
-URI https://asc.fasb.org/1943274/2147476176/805-60-65-1
Reference 4: http://www.xbrl.org/2003/role/disclosureRef
-Topic 740
-SubTopic 323
-Name Accounting Standards Codification
-Section 65
-Paragraph 2
-Subparagraph (g)(3)
-Publisher FASB
-URI https://asc.fasb.org/1943274/2147478666/740-323-65-2
Reference 5: http://www.xbrl.org/2003/role/disclosureRef
-Topic 250
-SubTopic 10
-Name Accounting Standards Codification
-Section 50
-Paragraph 3
-Publisher FASB
-URI https://asc.fasb.org/1943274/2147483443/250-10-50-3
Reference 6: http://www.xbrl.org/2003/role/disclosureRef
-Topic 260
-SubTopic 10
-Name Accounting Standards Codification
-Section 55
-Paragraph 15
-Publisher FASB
-URI https://asc.fasb.org/1943274/2147482635/260-10-55-15
Reference 7: http://www.xbrl.org/2003/role/disclosureRef
-Topic 815
-SubTopic 40
-Name Accounting Standards Codification
-Section 65
-Paragraph 1
-Subparagraph (e)(4)
-Publisher FASB
-URI https://asc.fasb.org/1943274/2147480175/815-40-65-1
Reference 8: http://www.xbrl.org/2003/role/disclosureRef
-Topic 815
-SubTopic 40
-Name Accounting Standards Codification
-Section 65
-Paragraph 1
-Subparagraph (f)
-Publisher FASB
-URI https://asc.fasb.org/1943274/2147480175/815-40-65-1
Reference 9: http://www.xbrl.org/2003/role/disclosureRef
-Topic 250
-SubTopic 10
-Name Accounting Standards Codification
-Section 50
-Paragraph 11
-Subparagraph (a)
-Publisher FASB
-URI https://asc.fasb.org/1943274/2147483443/250-10-50-11
Reference 10: http://www.xbrl.org/2003/role/disclosureRef
-Topic 250
-SubTopic 10
-Name Accounting Standards Codification
-Section 50
-Paragraph 11
-Subparagraph (b)
-Publisher FASB
-URI https://asc.fasb.org/1943274/2147483443/250-10-50-11
Reference 11: http://www.xbrl.org/2003/role/disclosureRef
-Topic 250
-SubTopic 10
-Name Accounting Standards Codification
-Section 50
-Paragraph 7
-Subparagraph (a)
-Publisher FASB
-URI https://asc.fasb.org/1943274/2147483443/250-10-50-7
Reference 12: http://www.xbrl.org/2003/role/disclosureRef
-Topic 260
-SubTopic 10
-Name Accounting Standards Codification
-Section 45
-Paragraph 2
-Publisher FASB
-URI https://asc.fasb.org/1943274/2147482689/260-10-45-2
Reference 13: http://www.xbrl.org/2003/role/disclosureRef
-Topic 260
-SubTopic 10
-Name Accounting Standards Codification
-Section 45
-Paragraph 60B
-Subparagraph (d)
-Publisher FASB
-URI https://asc.fasb.org/1943274/2147482689/260-10-45-60B
Reference 14: http://www.xbrl.org/2003/role/disclosureRef
-Topic 250
-SubTopic 10
-Name Accounting Standards Codification
-Section 50
-Paragraph 4
-Publisher FASB
-URI https://asc.fasb.org/1943274/2147483443/250-10-50-4
Reference 15: http://www.xbrl.org/2003/role/disclosureRef
-Topic 260
-SubTopic 10
-Name Accounting Standards Codification
-Section 50
-Paragraph 1
-Subparagraph (a)
-Publisher FASB
-URI https://asc.fasb.org/1943274/2147482662/260-10-50-1
Reference 16: http://www.xbrl.org/2003/role/disclosureRef
-Topic 220
-SubTopic 10
-Name Accounting Standards Codification
-Section S99
-Paragraph 2
-Subparagraph (SX 210.5-03(25))
-Publisher FASB
-URI https://asc.fasb.org/1943274/2147483621/220-10-S99-2
Reference 17: http://www.xbrl.org/2003/role/disclosureRef
-Topic 942
-SubTopic 220
-Name Accounting Standards Codification
-Section S99
-Paragraph 1
-Subparagraph (SX 210.9-04(27))
-Publisher FASB
-URI https://asc.fasb.org/1943274/2147478524/942-220-S99-1
Reference 18: http://www.xbrl.org/2003/role/disclosureRef
-Topic 944
-SubTopic 220
-Name Accounting Standards Codification
-Section S99
-Paragraph 1
-Subparagraph (SX 210.7-04(23))
-Publisher FASB
-URI https://asc.fasb.org/1943274/2147477250/944-220-S99-1
Reference 19: http://www.xbrl.org/2003/role/disclosureRef
-Topic 260
-SubTopic 10
-Name Accounting Standards Codification
-Section 45
-Paragraph 7
-Publisher FASB
-URI https://asc.fasb.org/1943274/2147482689/260-10-45-7
| Name: |
us-gaap_EarningsPerShareDiluted |
| Namespace Prefix: |
us-gaap_ |
| Data Type: |
dtr-types:perShareItemType |
| Balance Type: |
na |
| Period Type: |
duration |
|
| X |
- DefinitionAmount of gain (loss) on sale or disposal of oil and gas property or timber property. Reference 1: http://fasb.org/us-gaap/role/ref/legacyRef
-Name Accounting Standards Codification
-Section 45
-Paragraph 28
-Subparagraph (b)
-SubTopic 10
-Topic 230
-Publisher FASB
-URI https://asc.fasb.org/1943274/2147482740/230-10-45-28
| Name: |
us-gaap_GainLossOnSaleOfProperty |
| Namespace Prefix: |
us-gaap_ |
| Data Type: |
xbrli:monetaryItemType |
| Balance Type: |
credit |
| Period Type: |
duration |
|
| X |
- DefinitionThe aggregate total of expenses of managing and administering the affairs of an entity, including affiliates of the reporting entity, which are not directly or indirectly associated with the manufacture, sale or creation of a product or product line. Reference 1: http://fasb.org/us-gaap/role/ref/legacyRef
-Topic 220
-SubTopic 10
-Name Accounting Standards Codification
-Section S99
-Paragraph 2
-Subparagraph (SX 210.5-03(4))
-Publisher FASB
-URI https://asc.fasb.org/1943274/2147483621/220-10-S99-2
Reference 2: http://www.xbrl.org/2003/role/disclosureRef
-Topic 946
-SubTopic 220
-Name Accounting Standards Codification
-Section S99
-Paragraph 1
-Subparagraph (SX 210.6-07(2)(a))
-Publisher FASB
-URI https://asc.fasb.org/1943274/2147479134/946-220-S99-1
| Name: |
us-gaap_GeneralAndAdministrativeExpense |
| Namespace Prefix: |
us-gaap_ |
| Data Type: |
xbrli:monetaryItemType |
| Balance Type: |
debit |
| Period Type: |
duration |
|
| X |
- DefinitionAmount before accretion (amortization) of purchase discount (premium) of interest income on nonoperating securities. Reference 1: http://www.xbrl.org/2003/role/disclosureRef
-Topic 280
-SubTopic 10
-Name Accounting Standards Codification
-Section 50
-Paragraph 22
-Subparagraph (c)
-Publisher FASB
-URI https://asc.fasb.org/1943274/2147482810/280-10-50-22
Reference 2: http://www.xbrl.org/2003/role/exampleRef
-Topic 280
-SubTopic 10
-Name Accounting Standards Codification
-Section 55
-Paragraph 48
-Publisher FASB
-URI https://asc.fasb.org/1943274/2147482785/280-10-55-48
Reference 3: http://www.xbrl.org/2009/role/commonPracticeRef
-Topic 220
-SubTopic 10
-Name Accounting Standards Codification
-Section S99
-Paragraph 2
-Subparagraph (SX 210.5-03(7)(b))
-Publisher FASB
-URI https://asc.fasb.org/1943274/2147483621/220-10-S99-2
Reference 4: http://www.xbrl.org/2003/role/disclosureRef
-Topic 270
-SubTopic 10
-Name Accounting Standards Codification
-Section 50
-Paragraph 1
-Subparagraph (i)
-Publisher FASB
-URI https://asc.fasb.org/1943274/2147482964/270-10-50-1
Reference 5: http://www.xbrl.org/2003/role/disclosureRef
-Topic 280
-SubTopic 10
-Name Accounting Standards Codification
-Section 50
-Paragraph 32
-Subparagraph (ee)
-Publisher FASB
-URI https://asc.fasb.org/1943274/2147482810/280-10-50-32
| Name: |
us-gaap_InvestmentIncomeInterest |
| Namespace Prefix: |
us-gaap_ |
| Data Type: |
xbrli:monetaryItemType |
| Balance Type: |
credit |
| Period Type: |
duration |
|
| X |
- DefinitionThe portion of profit or loss for the period, net of income taxes, which is attributable to the parent. Reference 1: http://www.xbrl.org/2003/role/disclosureRef
-Topic 250
-SubTopic 10
-Name Accounting Standards Codification
-Section 50
-Paragraph 6
-Publisher FASB
-URI https://asc.fasb.org/1943274/2147483443/250-10-50-6
Reference 2: http://www.xbrl.org/2003/role/disclosureRef
-Topic 250
-SubTopic 10
-Name Accounting Standards Codification
-Section 50
-Paragraph 9
-Publisher FASB
-URI https://asc.fasb.org/1943274/2147483443/250-10-50-9
Reference 3: http://www.xbrl.org/2003/role/disclosureRef
-Topic 805
-SubTopic 60
-Name Accounting Standards Codification
-Section 65
-Paragraph 1
-Subparagraph (g)
-Publisher FASB
-URI https://asc.fasb.org/1943274/2147476176/805-60-65-1
Reference 4: http://www.xbrl.org/2003/role/disclosureRef
-Topic 740
-SubTopic 323
-Name Accounting Standards Codification
-Section 65
-Paragraph 2
-Subparagraph (g)(3)
-Publisher FASB
-URI https://asc.fasb.org/1943274/2147478666/740-323-65-2
Reference 5: http://fasb.org/us-gaap/role/ref/legacyRef
-Topic 220
-SubTopic 10
-Name Accounting Standards Codification
-Section S99
-Paragraph 2
-Subparagraph (SX 210.5-03(20))
-Publisher FASB
-URI https://asc.fasb.org/1943274/2147483621/220-10-S99-2
Reference 6: http://www.xbrl.org/2003/role/disclosureRef
-Topic 235
-SubTopic 10
-Name Accounting Standards Codification
-Section S99
-Paragraph 1
-Subparagraph (SX 210.4-08(g)(1)(ii))
-Publisher FASB
-URI https://asc.fasb.org/1943274/2147480678/235-10-S99-1
Reference 7: http://www.xbrl.org/2003/role/disclosureRef
-Topic 323
-SubTopic 10
-Name Accounting Standards Codification
-Section 50
-Paragraph 3
-Subparagraph (c)
-Publisher FASB
-URI https://asc.fasb.org/1943274/2147481687/323-10-50-3
Reference 8: http://www.xbrl.org/2003/role/disclosureRef
-Topic 825
-SubTopic 10
-Name Accounting Standards Codification
-Section 50
-Paragraph 28
-Subparagraph (f)
-Publisher FASB
-URI https://asc.fasb.org/1943274/2147482907/825-10-50-28
Reference 9: http://www.xbrl.org/2003/role/disclosureRef
-Topic 220
-SubTopic 10
-Name Accounting Standards Codification
-Section 50
-Paragraph 6
-Publisher FASB
-URI https://asc.fasb.org/1943274/2147482765/220-10-50-6
Reference 10: http://www.xbrl.org/2003/role/disclosureRef
-Topic 250
-SubTopic 10
-Name Accounting Standards Codification
-Section 50
-Paragraph 3
-Publisher FASB
-URI https://asc.fasb.org/1943274/2147483443/250-10-50-3
Reference 11: http://www.xbrl.org/2003/role/disclosureRef
-Topic 250
-SubTopic 10
-Name Accounting Standards Codification
-Section 50
-Paragraph 1
-Subparagraph (b)(2)
-Publisher FASB
-URI https://asc.fasb.org/1943274/2147483443/250-10-50-1
Reference 12: http://www.xbrl.org/2003/role/disclosureRef
-Topic 815
-SubTopic 40
-Name Accounting Standards Codification
-Section 65
-Paragraph 1
-Subparagraph (f)
-Publisher FASB
-URI https://asc.fasb.org/1943274/2147480175/815-40-65-1
Reference 13: http://www.xbrl.org/2003/role/disclosureRef
-Topic 250
-SubTopic 10
-Name Accounting Standards Codification
-Section 50
-Paragraph 8
-Publisher FASB
-URI https://asc.fasb.org/1943274/2147483443/250-10-50-8
Reference 14: http://www.xbrl.org/2003/role/disclosureRef
-Topic 250
-SubTopic 10
-Name Accounting Standards Codification
-Section 50
-Paragraph 11
-Subparagraph (a)
-Publisher FASB
-URI https://asc.fasb.org/1943274/2147483443/250-10-50-11
Reference 15: http://www.xbrl.org/2003/role/disclosureRef
-Topic 250
-SubTopic 10
-Name Accounting Standards Codification
-Section 50
-Paragraph 11
-Subparagraph (b)
-Publisher FASB
-URI https://asc.fasb.org/1943274/2147483443/250-10-50-11
Reference 16: http://www.xbrl.org/2003/role/disclosureRef
-Topic 250
-SubTopic 10
-Name Accounting Standards Codification
-Section 50
-Paragraph 4
-Publisher FASB
-URI https://asc.fasb.org/1943274/2147483443/250-10-50-4
Reference 17: http://www.xbrl.org/2003/role/exampleRef
-Topic 946
-SubTopic 830
-Name Accounting Standards Codification
-Section 55
-Paragraph 10
-Publisher FASB
-URI https://asc.fasb.org/1943274/2147479168/946-830-55-10
Reference 18: http://www.xbrl.org/2003/role/disclosureRef
-Topic 946
-SubTopic 220
-Name Accounting Standards Codification
-Section 45
-Paragraph 7
-Publisher FASB
-URI https://asc.fasb.org/1943274/2147479105/946-220-45-7
Reference 19: http://www.xbrl.org/2003/role/disclosureRef
-Topic 944
-SubTopic 220
-Name Accounting Standards Codification
-Section S99
-Paragraph 1
-Subparagraph (SX 210.7-04(18))
-Publisher FASB
-URI https://asc.fasb.org/1943274/2147477250/944-220-S99-1
Reference 20: http://www.xbrl.org/2003/role/disclosureRef
-Topic 946
-SubTopic 220
-Name Accounting Standards Codification
-Section S99
-Paragraph 1
-Subparagraph (SX 210.6-07(9))
-Publisher FASB
-URI https://asc.fasb.org/1943274/2147479134/946-220-S99-1
Reference 21: http://www.xbrl.org/2003/role/disclosureRef
-Topic 946
-SubTopic 220
-Name Accounting Standards Codification
-Section S99
-Paragraph 3
-Subparagraph (SX 210.6-09(1)(d))
-Publisher FASB
-URI https://asc.fasb.org/1943274/2147479134/946-220-S99-3
Reference 22: http://www.xbrl.org/2003/role/disclosureRef
-Topic 470
-SubTopic 10
-Name Accounting Standards Codification
-Section S99
-Paragraph 1A
-Subparagraph (SX 210.13-01(a)(4)(i))
-Publisher FASB
-URI https://asc.fasb.org/1943274/2147480097/470-10-S99-1A
Reference 23: http://www.xbrl.org/2009/role/commonPracticeRef
-Topic 470
-SubTopic 10
-Name Accounting Standards Codification
-Section S99
-Paragraph 1A
-Subparagraph (SX 210.13-01(a)(4)(ii))
-Publisher FASB
-URI https://asc.fasb.org/1943274/2147480097/470-10-S99-1A
Reference 24: http://www.xbrl.org/2003/role/disclosureRef
-Topic 470
-SubTopic 10
-Name Accounting Standards Codification
-Section S99
-Paragraph 1A
-Subparagraph (SX 210.13-01(a)(4)(iii)(A))
-Publisher FASB
-URI https://asc.fasb.org/1943274/2147480097/470-10-S99-1A
Reference 25: http://www.xbrl.org/2003/role/disclosureRef
-Topic 470
-SubTopic 10
-Name Accounting Standards Codification
-Section S99
-Paragraph 1A
-Subparagraph (SX 210.13-01(a)(4)(iv))
-Publisher FASB
-URI https://asc.fasb.org/1943274/2147480097/470-10-S99-1A
Reference 26: http://www.xbrl.org/2003/role/disclosureRef
-Topic 470
-SubTopic 10
-Name Accounting Standards Codification
-Section S99
-Paragraph 1A
-Subparagraph (SX 210.13-01(a)(5))
-Publisher FASB
-URI https://asc.fasb.org/1943274/2147480097/470-10-S99-1A
Reference 27: http://www.xbrl.org/2003/role/disclosureRef
-Topic 470
-SubTopic 10
-Name Accounting Standards Codification
-Section S99
-Paragraph 1B
-Subparagraph (SX 210.13-02(a)(4)(i))
-Publisher FASB
-URI https://asc.fasb.org/1943274/2147480097/470-10-S99-1B
Reference 28: http://www.xbrl.org/2003/role/disclosureRef
-Topic 470
-SubTopic 10
-Name Accounting Standards Codification
-Section S99
-Paragraph 1B
-Subparagraph (SX 210.13-02(a)(4)(iii)(A))
-Publisher FASB
-URI https://asc.fasb.org/1943274/2147480097/470-10-S99-1B
Reference 29: http://www.xbrl.org/2003/role/disclosureRef
-Topic 470
-SubTopic 10
-Name Accounting Standards Codification
-Section S99
-Paragraph 1B
-Subparagraph (SX 210.13-02(a)(4)(iii)(B))
-Publisher FASB
-URI https://asc.fasb.org/1943274/2147480097/470-10-S99-1B
Reference 30: http://www.xbrl.org/2003/role/disclosureRef
-Topic 470
-SubTopic 10
-Name Accounting Standards Codification
-Section S99
-Paragraph 1B
-Subparagraph (SX 210.13-02(a)(4)(iv))
-Publisher FASB
-URI https://asc.fasb.org/1943274/2147480097/470-10-S99-1B
Reference 31: http://www.xbrl.org/2003/role/disclosureRef
-Topic 470
-SubTopic 10
-Name Accounting Standards Codification
-Section S99
-Paragraph 1B
-Subparagraph (SX 210.13-02(a)(5))
-Publisher FASB
-URI https://asc.fasb.org/1943274/2147480097/470-10-S99-1B
Reference 32: http://www.xbrl.org/2003/role/disclosureRef
-Topic 260
-SubTopic 10
-Name Accounting Standards Codification
-Section 45
-Paragraph 60B
-Subparagraph (a)
-Publisher FASB
-URI https://asc.fasb.org/1943274/2147482689/260-10-45-60B
Reference 33: http://www.xbrl.org/2003/role/disclosureRef
-Topic 205
-SubTopic 20
-Name Accounting Standards Codification
-Section 50
-Paragraph 7
-Publisher FASB
-URI https://asc.fasb.org/1943274/2147483499/205-20-50-7
Reference 34: http://fasb.org/us-gaap/role/ref/legacyRef
-Topic 230
-SubTopic 10
-Name Accounting Standards Codification
-Section 45
-Paragraph 28
-Publisher FASB
-URI https://asc.fasb.org/1943274/2147482740/230-10-45-28
Reference 35: http://www.xbrl.org/2003/role/disclosureRef
-Topic 220
-SubTopic 10
-Name Accounting Standards Codification
-Section 45
-Paragraph 1A
-Subparagraph (a)
-Publisher FASB
-URI https://asc.fasb.org/1943274/2147482790/220-10-45-1A
Reference 36: http://www.xbrl.org/2003/role/disclosureRef
-Topic 220
-SubTopic 10
-Name Accounting Standards Codification
-Section 45
-Paragraph 1B
-Subparagraph (a)
-Publisher FASB
-URI https://asc.fasb.org/1943274/2147482790/220-10-45-1B
Reference 37: http://fasb.org/us-gaap/role/ref/legacyRef
-Topic 942
-SubTopic 220
-Name Accounting Standards Codification
-Section S99
-Paragraph 1
-Subparagraph (SX 210.9-04(22))
-Publisher FASB
-URI https://asc.fasb.org/1943274/2147478524/942-220-S99-1
| Name: |
us-gaap_NetIncomeLoss |
| Namespace Prefix: |
us-gaap_ |
| Data Type: |
xbrli:monetaryItemType |
| Balance Type: |
credit |
| Period Type: |
duration |
|
| X |
- DefinitionThe aggregate amount of income or expense from ancillary business-related activities (that is to say, excluding major activities considered part of the normal operations of the business). Reference 1: http://fasb.org/us-gaap/role/ref/legacyRef
-Topic 220
-SubTopic 10
-Name Accounting Standards Codification
-Section S99
-Paragraph 2
-Subparagraph (SX 210.5-03(7))
-Publisher FASB
-URI https://asc.fasb.org/1943274/2147483621/220-10-S99-2
| Name: |
us-gaap_NonoperatingIncomeExpense |
| Namespace Prefix: |
us-gaap_ |
| Data Type: |
xbrli:monetaryItemType |
| Balance Type: |
credit |
| Period Type: |
duration |
|
| X |
- References
+ Details
| Name: |
us-gaap_NonoperatingIncomeExpenseAbstract |
| Namespace Prefix: |
us-gaap_ |
| Data Type: |
xbrli:stringItemType |
| Balance Type: |
na |
| Period Type: |
duration |
|
| X |
- DefinitionGenerally recurring costs associated with normal operations except for the portion of these expenses which can be clearly related to production and included in cost of sales or services. Includes selling, general and administrative expense.
| Name: |
us-gaap_OperatingExpenses |
| Namespace Prefix: |
us-gaap_ |
| Data Type: |
xbrli:monetaryItemType |
| Balance Type: |
debit |
| Period Type: |
duration |
|
| X |
- References
+ Details
| Name: |
us-gaap_OperatingExpensesAbstract |
| Namespace Prefix: |
us-gaap_ |
| Data Type: |
xbrli:stringItemType |
| Balance Type: |
na |
| Period Type: |
duration |
|
| X |
- DefinitionThe net result for the period of deducting operating expenses from operating revenues. Reference 1: http://www.xbrl.org/2009/role/commonPracticeRef
-Topic 280
-SubTopic 10
-Name Accounting Standards Codification
-Section 50
-Paragraph 22
-Publisher FASB
-URI https://asc.fasb.org/1943274/2147482810/280-10-50-22
Reference 2: http://www.xbrl.org/2009/role/commonPracticeRef
-Topic 280
-SubTopic 10
-Name Accounting Standards Codification
-Section 50
-Paragraph 32
-Subparagraph (f)
-Publisher FASB
-URI https://asc.fasb.org/1943274/2147482810/280-10-50-32
Reference 3: http://www.xbrl.org/2009/role/commonPracticeRef
-Topic 280
-SubTopic 10
-Name Accounting Standards Codification
-Section 50
-Paragraph 30
-Subparagraph (b)
-Publisher FASB
-URI https://asc.fasb.org/1943274/2147482810/280-10-50-30
Reference 4: http://www.xbrl.org/2009/role/commonPracticeRef
-Topic 270
-SubTopic 10
-Name Accounting Standards Codification
-Section 50
-Paragraph 1
-Subparagraph (i)
-Publisher FASB
-URI https://asc.fasb.org/1943274/2147482964/270-10-50-1
Reference 5: http://www.xbrl.org/2009/role/commonPracticeRef
-Topic 280
-SubTopic 10
-Name Accounting Standards Codification
-Section 50
-Paragraph 32
-Subparagraph (ee)
-Publisher FASB
-URI https://asc.fasb.org/1943274/2147482810/280-10-50-32
Reference 6: http://fasb.org/us-gaap/role/ref/otherTransitionRef
-Topic 280
-SubTopic 10
-Name Accounting Standards Codification
-Section 50
-Paragraph 32
-Subparagraph (c)
-Publisher FASB
-URI https://asc.fasb.org/1943274/2147482810/280-10-50-32
Reference 7: http://www.xbrl.org/2003/role/exampleRef
-Topic 280
-SubTopic 10
-Name Accounting Standards Codification
-Section 50
-Paragraph 31
-Publisher FASB
-URI https://asc.fasb.org/1943274/2147482810/280-10-50-31
| Name: |
us-gaap_OperatingIncomeLoss |
| Namespace Prefix: |
us-gaap_ |
| Data Type: |
xbrli:monetaryItemType |
| Balance Type: |
credit |
| Period Type: |
duration |
|
| X |
- DefinitionAmount of operating lease expense. Excludes sublease income. Reference 1: http://www.xbrl.org/2009/role/commonPracticeRef
-Topic 842
-SubTopic 20
-Name Accounting Standards Codification
-Section 45
-Paragraph 4
-Subparagraph (b)
-Publisher FASB
-URI https://asc.fasb.org/1943274/2147479041/842-20-45-4
| Name: |
us-gaap_OperatingLeaseExpense |
| Namespace Prefix: |
us-gaap_ |
| Data Type: |
xbrli:monetaryItemType |
| Balance Type: |
debit |
| Period Type: |
duration |
|
| X |
- DefinitionAmount of income related to nonoperating activities, classified as other. Reference 1: http://www.xbrl.org/2003/role/disclosureRef
-Topic 220
-SubTopic 10
-Name Accounting Standards Codification
-Section S99
-Paragraph 2
-Subparagraph (SX 210.5-03(7)(d))
-Publisher FASB
-URI https://asc.fasb.org/1943274/2147483621/220-10-S99-2
| Name: |
us-gaap_OtherNonoperatingIncome |
| Namespace Prefix: |
us-gaap_ |
| Data Type: |
xbrli:monetaryItemType |
| Balance Type: |
credit |
| Period Type: |
duration |
|
| X |
- DefinitionAmount, excluding tax collected from customer, of revenue from satisfaction of performance obligation by transferring promised good or service to customer. Tax collected from customer is tax assessed by governmental authority that is both imposed on and concurrent with specific revenue-producing transaction, including, but not limited to, sales, use, value added and excise. Reference 1: http://www.xbrl.org/2003/role/disclosureRef
-Topic 280
-SubTopic 10
-Name Accounting Standards Codification
-Section 50
-Paragraph 41
-Subparagraph (a)
-Publisher FASB
-URI https://asc.fasb.org/1943274/2147482810/280-10-50-41
Reference 2: http://www.xbrl.org/2003/role/disclosureRef
-Topic 270
-SubTopic 10
-Name Accounting Standards Codification
-Section 50
-Paragraph 1
-Subparagraph (i)
-Publisher FASB
-URI https://asc.fasb.org/1943274/2147482964/270-10-50-1
Reference 3: http://www.xbrl.org/2003/role/disclosureRef
-Topic 280
-SubTopic 10
-Name Accounting Standards Codification
-Section 50
-Paragraph 32
-Subparagraph (ee)
-Publisher FASB
-URI https://asc.fasb.org/1943274/2147482810/280-10-50-32
Reference 4: http://fasb.org/us-gaap/role/ref/otherTransitionRef
-Topic 280
-SubTopic 10
-Name Accounting Standards Codification
-Section 50
-Paragraph 32
-Subparagraph (b)
-Publisher FASB
-URI https://asc.fasb.org/1943274/2147482810/280-10-50-32
Reference 5: http://fasb.org/us-gaap/role/ref/otherTransitionRef
-Topic 280
-SubTopic 10
-Name Accounting Standards Codification
-Section 50
-Paragraph 32
-Subparagraph (a)
-Publisher FASB
-URI https://asc.fasb.org/1943274/2147482810/280-10-50-32
Reference 6: http://www.xbrl.org/2003/role/disclosureRef
-Topic 924
-SubTopic 10
-Name Accounting Standards Codification
-Section S99
-Paragraph 1
-Subparagraph (SAB Topic 11.L)
-Publisher FASB
-URI https://asc.fasb.org/1943274/2147479941/924-10-S99-1
Reference 7: http://www.xbrl.org/2003/role/disclosureRef
-Topic 606
-SubTopic 10
-Name Accounting Standards Codification
-Section 50
-Paragraph 5
-Publisher FASB
-URI https://asc.fasb.org/1943274/2147479806/606-10-50-5
Reference 8: http://www.xbrl.org/2003/role/disclosureRef
-Topic 280
-SubTopic 10
-Name Accounting Standards Codification
-Section 50
-Paragraph 30
-Subparagraph (a)
-Publisher FASB
-URI https://asc.fasb.org/1943274/2147482810/280-10-50-30
Reference 9: http://www.xbrl.org/2003/role/disclosureRef
-Topic 280
-SubTopic 10
-Name Accounting Standards Codification
-Section 50
-Paragraph 42
-Publisher FASB
-URI https://asc.fasb.org/1943274/2147482810/280-10-50-42
Reference 10: http://www.xbrl.org/2003/role/disclosureRef
-Topic 280
-SubTopic 10
-Name Accounting Standards Codification
-Section 50
-Paragraph 22
-Subparagraph (b)
-Publisher FASB
-URI https://asc.fasb.org/1943274/2147482810/280-10-50-22
Reference 11: http://www.xbrl.org/2003/role/disclosureRef
-Topic 280
-SubTopic 10
-Name Accounting Standards Codification
-Section 50
-Paragraph 40
-Publisher FASB
-URI https://asc.fasb.org/1943274/2147482810/280-10-50-40
Reference 12: http://www.xbrl.org/2003/role/disclosureRef
-Topic 280
-SubTopic 10
-Name Accounting Standards Codification
-Section 50
-Paragraph 22
-Subparagraph (a)
-Publisher FASB
-URI https://asc.fasb.org/1943274/2147482810/280-10-50-22
Reference 13: http://www.xbrl.org/2003/role/disclosureRef
-Topic 606
-SubTopic 10
-Name Accounting Standards Codification
-Section 50
-Paragraph 4
-Subparagraph (a)
-Publisher FASB
-URI https://asc.fasb.org/1943274/2147479806/606-10-50-4
| Name: |
us-gaap_RevenueFromContractWithCustomerExcludingAssessedTax |
| Namespace Prefix: |
us-gaap_ |
| Data Type: |
xbrli:monetaryItemType |
| Balance Type: |
credit |
| Period Type: |
duration |
|
| X |
- DefinitionAmount of revenue recognized from goods sold, services rendered, insurance premiums, or other activities that constitute an earning process. Includes, but is not limited to, investment and interest income before deduction of interest expense when recognized as a component of revenue, and sales and trading gain (loss). Reference 1: http://www.xbrl.org/2003/role/exampleRef
-Topic 280
-SubTopic 10
-Name Accounting Standards Codification
-Section 55
-Paragraph 48
-Publisher FASB
-URI https://asc.fasb.org/1943274/2147482785/280-10-55-48
Reference 2: http://www.xbrl.org/2003/role/disclosureRef
-Topic 280
-SubTopic 10
-Name Accounting Standards Codification
-Section 50
-Paragraph 41
-Subparagraph (a)
-Publisher FASB
-URI https://asc.fasb.org/1943274/2147482810/280-10-50-41
Reference 3: http://www.xbrl.org/2003/role/disclosureRef
-Topic 270
-SubTopic 10
-Name Accounting Standards Codification
-Section 50
-Paragraph 1
-Subparagraph (i)
-Publisher FASB
-URI https://asc.fasb.org/1943274/2147482964/270-10-50-1
Reference 4: http://www.xbrl.org/2003/role/disclosureRef
-Topic 280
-SubTopic 10
-Name Accounting Standards Codification
-Section 50
-Paragraph 32
-Subparagraph (ee)
-Publisher FASB
-URI https://asc.fasb.org/1943274/2147482810/280-10-50-32
Reference 5: http://fasb.org/us-gaap/role/ref/otherTransitionRef
-Topic 280
-SubTopic 10
-Name Accounting Standards Codification
-Section 50
-Paragraph 32
-Subparagraph (b)
-Publisher FASB
-URI https://asc.fasb.org/1943274/2147482810/280-10-50-32
Reference 6: http://fasb.org/us-gaap/role/ref/otherTransitionRef
-Topic 280
-SubTopic 10
-Name Accounting Standards Codification
-Section 50
-Paragraph 32
-Subparagraph (a)
-Publisher FASB
-URI https://asc.fasb.org/1943274/2147482810/280-10-50-32
Reference 7: http://www.xbrl.org/2003/role/disclosureRef
-Topic 235
-SubTopic 10
-Name Accounting Standards Codification
-Section S99
-Paragraph 1
-Subparagraph (SX 210.4-08(g)(1)(ii))
-Publisher FASB
-URI https://asc.fasb.org/1943274/2147480678/235-10-S99-1
Reference 8: http://www.xbrl.org/2003/role/disclosureRef
-Topic 323
-SubTopic 10
-Name Accounting Standards Codification
-Section 50
-Paragraph 3
-Subparagraph (c)
-Publisher FASB
-URI https://asc.fasb.org/1943274/2147481687/323-10-50-3
Reference 9: http://www.xbrl.org/2003/role/disclosureRef
-Topic 825
-SubTopic 10
-Name Accounting Standards Codification
-Section 50
-Paragraph 28
-Subparagraph (f)
-Publisher FASB
-URI https://asc.fasb.org/1943274/2147482907/825-10-50-28
Reference 10: http://www.xbrl.org/2003/role/disclosureRef
-Topic 470
-SubTopic 10
-Name Accounting Standards Codification
-Section S99
-Paragraph 1A
-Subparagraph (SX 210.13-01(a)(4)(i))
-Publisher FASB
-URI https://asc.fasb.org/1943274/2147480097/470-10-S99-1A
Reference 11: http://www.xbrl.org/2009/role/commonPracticeRef
-Topic 470
-SubTopic 10
-Name Accounting Standards Codification
-Section S99
-Paragraph 1A
-Subparagraph (SX 210.13-01(a)(4)(ii))
-Publisher FASB
-URI https://asc.fasb.org/1943274/2147480097/470-10-S99-1A
Reference 12: http://www.xbrl.org/2003/role/disclosureRef
-Topic 470
-SubTopic 10
-Name Accounting Standards Codification
-Section S99
-Paragraph 1A
-Subparagraph (SX 210.13-01(a)(4)(iii)(A))
-Publisher FASB
-URI https://asc.fasb.org/1943274/2147480097/470-10-S99-1A
Reference 13: http://www.xbrl.org/2003/role/disclosureRef
-Topic 470
-SubTopic 10
-Name Accounting Standards Codification
-Section S99
-Paragraph 1A
-Subparagraph (SX 210.13-01(a)(4)(iv))
-Publisher FASB
-URI https://asc.fasb.org/1943274/2147480097/470-10-S99-1A
Reference 14: http://www.xbrl.org/2003/role/disclosureRef
-Topic 470
-SubTopic 10
-Name Accounting Standards Codification
-Section S99
-Paragraph 1A
-Subparagraph (SX 210.13-01(a)(5))
-Publisher FASB
-URI https://asc.fasb.org/1943274/2147480097/470-10-S99-1A
Reference 15: http://www.xbrl.org/2003/role/disclosureRef
-Topic 470
-SubTopic 10
-Name Accounting Standards Codification
-Section S99
-Paragraph 1B
-Subparagraph (SX 210.13-02(a)(4)(i))
-Publisher FASB
-URI https://asc.fasb.org/1943274/2147480097/470-10-S99-1B
Reference 16: http://www.xbrl.org/2003/role/disclosureRef
-Topic 470
-SubTopic 10
-Name Accounting Standards Codification
-Section S99
-Paragraph 1B
-Subparagraph (SX 210.13-02(a)(4)(iii)(A))
-Publisher FASB
-URI https://asc.fasb.org/1943274/2147480097/470-10-S99-1B
Reference 17: http://www.xbrl.org/2003/role/disclosureRef
-Topic 470
-SubTopic 10
-Name Accounting Standards Codification
-Section S99
-Paragraph 1B
-Subparagraph (SX 210.13-02(a)(4)(iii)(B))
-Publisher FASB
-URI https://asc.fasb.org/1943274/2147480097/470-10-S99-1B
Reference 18: http://www.xbrl.org/2003/role/disclosureRef
-Topic 470
-SubTopic 10
-Name Accounting Standards Codification
-Section S99
-Paragraph 1B
-Subparagraph (SX 210.13-02(a)(4)(iv))
-Publisher FASB
-URI https://asc.fasb.org/1943274/2147480097/470-10-S99-1B
Reference 19: http://www.xbrl.org/2003/role/disclosureRef
-Topic 470
-SubTopic 10
-Name Accounting Standards Codification
-Section S99
-Paragraph 1B
-Subparagraph (SX 210.13-02(a)(5))
-Publisher FASB
-URI https://asc.fasb.org/1943274/2147480097/470-10-S99-1B
Reference 20: http://www.xbrl.org/2003/role/disclosureRef
-Topic 280
-SubTopic 10
-Name Accounting Standards Codification
-Section 50
-Paragraph 30
-Subparagraph (a)
-Publisher FASB
-URI https://asc.fasb.org/1943274/2147482810/280-10-50-30
Reference 21: http://www.xbrl.org/2003/role/disclosureRef
-Topic 280
-SubTopic 10
-Name Accounting Standards Codification
-Section 50
-Paragraph 42
-Publisher FASB
-URI https://asc.fasb.org/1943274/2147482810/280-10-50-42
Reference 22: http://www.xbrl.org/2003/role/disclosureRef
-Topic 280
-SubTopic 10
-Name Accounting Standards Codification
-Section 50
-Paragraph 22
-Subparagraph (b)
-Publisher FASB
-URI https://asc.fasb.org/1943274/2147482810/280-10-50-22
Reference 23: http://www.xbrl.org/2003/role/disclosureRef
-Topic 280
-SubTopic 10
-Name Accounting Standards Codification
-Section 50
-Paragraph 40
-Publisher FASB
-URI https://asc.fasb.org/1943274/2147482810/280-10-50-40
Reference 24: http://www.xbrl.org/2003/role/disclosureRef
-Topic 280
-SubTopic 10
-Name Accounting Standards Codification
-Section 50
-Paragraph 22
-Subparagraph (a)
-Publisher FASB
-URI https://asc.fasb.org/1943274/2147482810/280-10-50-22
Reference 25: http://www.xbrl.org/2003/role/disclosureRef
-Topic 942
-SubTopic 235
-Name Accounting Standards Codification
-Section S99
-Paragraph 1
-Subparagraph (SX 210.9-05(b)(2))
-Publisher FASB
-URI https://asc.fasb.org/1943274/2147477314/942-235-S99-1
Reference 26: http://www.xbrl.org/2003/role/disclosureRef
-Topic 220
-SubTopic 10
-Name Accounting Standards Codification
-Section S99
-Paragraph 2
-Subparagraph (SX 210.5-03(1))
-Publisher FASB
-URI https://asc.fasb.org/1943274/2147483621/220-10-S99-2
| Name: |
us-gaap_Revenues |
| Namespace Prefix: |
us-gaap_ |
| Data Type: |
xbrli:monetaryItemType |
| Balance Type: |
credit |
| Period Type: |
duration |
|
| X |
- References
+ Details
| Name: |
us-gaap_RevenuesAbstract |
| Namespace Prefix: |
us-gaap_ |
| Data Type: |
xbrli:stringItemType |
| Balance Type: |
na |
| Period Type: |
duration |
|
| X |
- DefinitionThe average number of shares or units issued and outstanding that are used in calculating diluted EPS or earnings per unit (EPU), determined based on the timing of issuance of shares or units in the period. Reference 1: http://www.xbrl.org/2003/role/disclosureRef
-Topic 260
-SubTopic 10
-Name Accounting Standards Codification
-Section 50
-Paragraph 1
-Subparagraph (a)
-Publisher FASB
-URI https://asc.fasb.org/1943274/2147482662/260-10-50-1
Reference 2: http://www.xbrl.org/2003/role/disclosureRef
-Topic 260
-SubTopic 10
-Name Accounting Standards Codification
-Section 45
-Paragraph 16
-Publisher FASB
-URI https://asc.fasb.org/1943274/2147482689/260-10-45-16
| Name: |
us-gaap_WeightedAverageNumberOfDilutedSharesOutstanding |
| Namespace Prefix: |
us-gaap_ |
| Data Type: |
xbrli:sharesItemType |
| Balance Type: |
na |
| Period Type: |
duration |
|
| X |
- DefinitionNumber of [basic] shares or units, after adjustment for contingently issuable shares or units and other shares or units not deemed outstanding, determined by relating the portion of time within a reporting period that common shares or units have been outstanding to the total time in that period. Reference 1: http://www.xbrl.org/2003/role/disclosureRef
-Topic 260
-SubTopic 10
-Name Accounting Standards Codification
-Section 50
-Paragraph 1
-Subparagraph (a)
-Publisher FASB
-URI https://asc.fasb.org/1943274/2147482662/260-10-50-1
Reference 2: http://www.xbrl.org/2003/role/disclosureRef
-Topic 260
-SubTopic 10
-Name Accounting Standards Codification
-Section 45
-Paragraph 10
-Publisher FASB
-URI https://asc.fasb.org/1943274/2147482689/260-10-45-10
| Name: |
us-gaap_WeightedAverageNumberOfSharesOutstandingBasic |
| Namespace Prefix: |
us-gaap_ |
| Data Type: |
xbrli:sharesItemType |
| Balance Type: |
na |
| Period Type: |
duration |
|
v3.25.0.1
Consolidated Statement of Changes in Shareholders' Equity - USD ($)
|
Common Stock [Member] |
Additional Paid-in Capital [Member] |
Retained Earnings [Member] |
Total |
| Balance at Dec. 31, 2022 |
$ 10,328
|
$ 85,094,266
|
$ (73,787,720)
|
$ 11,316,874
|
| Balance, shares at Dec. 31, 2022 |
10,327,646
|
|
|
|
| Issuance of common stock for cash, net |
$ 579
|
1,651,421
|
|
1,652,000
|
| Issuance of common stock for cash, net, shares |
578,707
|
|
|
|
| Stock-based compensation |
|
238,314
|
|
238,314
|
| Net loss |
|
|
(3,211,277)
|
(3,211,277)
|
| Balance at Dec. 31, 2023 |
$ 10,907
|
86,984,001
|
(76,998,997)
|
9,995,911
|
| Balance, shares at Dec. 31, 2023 |
10,906,353
|
|
|
|
| Issuance of common stock for cash, net |
$ 2,180
|
2,322,820
|
|
$ 2,325,000
|
| Issuance of common stock for cash, net, shares |
2,180,180
|
|
|
87,680
|
| Stock-based compensation |
|
101,508
|
|
$ 101,508
|
| Net loss |
|
|
(8,216,112)
|
(8,216,112)
|
| Balance at Dec. 31, 2024 |
$ 13,087
|
$ 89,408,329
|
$ (85,215,109)
|
$ 4,206,307
|
| Balance, shares at Dec. 31, 2024 |
13,086,533
|
|
|
|
| X |
- DefinitionAmount of increase to additional paid-in capital (APIC) for recognition of cost for award under share-based payment arrangement. Reference 1: http://www.xbrl.org/2003/role/disclosureRef
-Topic 718
-SubTopic 10
-Name Accounting Standards Codification
-Section 35
-Paragraph 2
-Publisher FASB
-URI https://asc.fasb.org/1943274/2147480483/718-10-35-2
Reference 2: http://fasb.org/us-gaap/role/ref/legacyRef
-Name Accounting Standards Codification
-Topic 718
-SubTopic 20
-Section 55
-Paragraph 13
-Publisher FASB
-URI https://asc.fasb.org/1943274/2147481089/718-20-55-13
Reference 3: http://fasb.org/us-gaap/role/ref/legacyRef
-Name Accounting Standards Codification
-Topic 718
-SubTopic 20
-Section 55
-Paragraph 12
-Publisher FASB
-URI https://asc.fasb.org/1943274/2147481089/718-20-55-12
| Name: |
us-gaap_AdjustmentsToAdditionalPaidInCapitalSharebasedCompensationRequisiteServicePeriodRecognitionValue |
| Namespace Prefix: |
us-gaap_ |
| Data Type: |
xbrli:monetaryItemType |
| Balance Type: |
credit |
| Period Type: |
duration |
|
| X |
- DefinitionThe portion of profit or loss for the period, net of income taxes, which is attributable to the parent. Reference 1: http://www.xbrl.org/2003/role/disclosureRef
-Topic 250
-SubTopic 10
-Name Accounting Standards Codification
-Section 50
-Paragraph 6
-Publisher FASB
-URI https://asc.fasb.org/1943274/2147483443/250-10-50-6
Reference 2: http://www.xbrl.org/2003/role/disclosureRef
-Topic 250
-SubTopic 10
-Name Accounting Standards Codification
-Section 50
-Paragraph 9
-Publisher FASB
-URI https://asc.fasb.org/1943274/2147483443/250-10-50-9
Reference 3: http://www.xbrl.org/2003/role/disclosureRef
-Topic 805
-SubTopic 60
-Name Accounting Standards Codification
-Section 65
-Paragraph 1
-Subparagraph (g)
-Publisher FASB
-URI https://asc.fasb.org/1943274/2147476176/805-60-65-1
Reference 4: http://www.xbrl.org/2003/role/disclosureRef
-Topic 740
-SubTopic 323
-Name Accounting Standards Codification
-Section 65
-Paragraph 2
-Subparagraph (g)(3)
-Publisher FASB
-URI https://asc.fasb.org/1943274/2147478666/740-323-65-2
Reference 5: http://fasb.org/us-gaap/role/ref/legacyRef
-Topic 220
-SubTopic 10
-Name Accounting Standards Codification
-Section S99
-Paragraph 2
-Subparagraph (SX 210.5-03(20))
-Publisher FASB
-URI https://asc.fasb.org/1943274/2147483621/220-10-S99-2
Reference 6: http://www.xbrl.org/2003/role/disclosureRef
-Topic 235
-SubTopic 10
-Name Accounting Standards Codification
-Section S99
-Paragraph 1
-Subparagraph (SX 210.4-08(g)(1)(ii))
-Publisher FASB
-URI https://asc.fasb.org/1943274/2147480678/235-10-S99-1
Reference 7: http://www.xbrl.org/2003/role/disclosureRef
-Topic 323
-SubTopic 10
-Name Accounting Standards Codification
-Section 50
-Paragraph 3
-Subparagraph (c)
-Publisher FASB
-URI https://asc.fasb.org/1943274/2147481687/323-10-50-3
Reference 8: http://www.xbrl.org/2003/role/disclosureRef
-Topic 825
-SubTopic 10
-Name Accounting Standards Codification
-Section 50
-Paragraph 28
-Subparagraph (f)
-Publisher FASB
-URI https://asc.fasb.org/1943274/2147482907/825-10-50-28
Reference 9: http://www.xbrl.org/2003/role/disclosureRef
-Topic 220
-SubTopic 10
-Name Accounting Standards Codification
-Section 50
-Paragraph 6
-Publisher FASB
-URI https://asc.fasb.org/1943274/2147482765/220-10-50-6
Reference 10: http://www.xbrl.org/2003/role/disclosureRef
-Topic 250
-SubTopic 10
-Name Accounting Standards Codification
-Section 50
-Paragraph 3
-Publisher FASB
-URI https://asc.fasb.org/1943274/2147483443/250-10-50-3
Reference 11: http://www.xbrl.org/2003/role/disclosureRef
-Topic 250
-SubTopic 10
-Name Accounting Standards Codification
-Section 50
-Paragraph 1
-Subparagraph (b)(2)
-Publisher FASB
-URI https://asc.fasb.org/1943274/2147483443/250-10-50-1
Reference 12: http://www.xbrl.org/2003/role/disclosureRef
-Topic 815
-SubTopic 40
-Name Accounting Standards Codification
-Section 65
-Paragraph 1
-Subparagraph (f)
-Publisher FASB
-URI https://asc.fasb.org/1943274/2147480175/815-40-65-1
Reference 13: http://www.xbrl.org/2003/role/disclosureRef
-Topic 250
-SubTopic 10
-Name Accounting Standards Codification
-Section 50
-Paragraph 8
-Publisher FASB
-URI https://asc.fasb.org/1943274/2147483443/250-10-50-8
Reference 14: http://www.xbrl.org/2003/role/disclosureRef
-Topic 250
-SubTopic 10
-Name Accounting Standards Codification
-Section 50
-Paragraph 11
-Subparagraph (a)
-Publisher FASB
-URI https://asc.fasb.org/1943274/2147483443/250-10-50-11
Reference 15: http://www.xbrl.org/2003/role/disclosureRef
-Topic 250
-SubTopic 10
-Name Accounting Standards Codification
-Section 50
-Paragraph 11
-Subparagraph (b)
-Publisher FASB
-URI https://asc.fasb.org/1943274/2147483443/250-10-50-11
Reference 16: http://www.xbrl.org/2003/role/disclosureRef
-Topic 250
-SubTopic 10
-Name Accounting Standards Codification
-Section 50
-Paragraph 4
-Publisher FASB
-URI https://asc.fasb.org/1943274/2147483443/250-10-50-4
Reference 17: http://www.xbrl.org/2003/role/exampleRef
-Topic 946
-SubTopic 830
-Name Accounting Standards Codification
-Section 55
-Paragraph 10
-Publisher FASB
-URI https://asc.fasb.org/1943274/2147479168/946-830-55-10
Reference 18: http://www.xbrl.org/2003/role/disclosureRef
-Topic 946
-SubTopic 220
-Name Accounting Standards Codification
-Section 45
-Paragraph 7
-Publisher FASB
-URI https://asc.fasb.org/1943274/2147479105/946-220-45-7
Reference 19: http://www.xbrl.org/2003/role/disclosureRef
-Topic 944
-SubTopic 220
-Name Accounting Standards Codification
-Section S99
-Paragraph 1
-Subparagraph (SX 210.7-04(18))
-Publisher FASB
-URI https://asc.fasb.org/1943274/2147477250/944-220-S99-1
Reference 20: http://www.xbrl.org/2003/role/disclosureRef
-Topic 946
-SubTopic 220
-Name Accounting Standards Codification
-Section S99
-Paragraph 1
-Subparagraph (SX 210.6-07(9))
-Publisher FASB
-URI https://asc.fasb.org/1943274/2147479134/946-220-S99-1
Reference 21: http://www.xbrl.org/2003/role/disclosureRef
-Topic 946
-SubTopic 220
-Name Accounting Standards Codification
-Section S99
-Paragraph 3
-Subparagraph (SX 210.6-09(1)(d))
-Publisher FASB
-URI https://asc.fasb.org/1943274/2147479134/946-220-S99-3
Reference 22: http://www.xbrl.org/2003/role/disclosureRef
-Topic 470
-SubTopic 10
-Name Accounting Standards Codification
-Section S99
-Paragraph 1A
-Subparagraph (SX 210.13-01(a)(4)(i))
-Publisher FASB
-URI https://asc.fasb.org/1943274/2147480097/470-10-S99-1A
Reference 23: http://www.xbrl.org/2009/role/commonPracticeRef
-Topic 470
-SubTopic 10
-Name Accounting Standards Codification
-Section S99
-Paragraph 1A
-Subparagraph (SX 210.13-01(a)(4)(ii))
-Publisher FASB
-URI https://asc.fasb.org/1943274/2147480097/470-10-S99-1A
Reference 24: http://www.xbrl.org/2003/role/disclosureRef
-Topic 470
-SubTopic 10
-Name Accounting Standards Codification
-Section S99
-Paragraph 1A
-Subparagraph (SX 210.13-01(a)(4)(iii)(A))
-Publisher FASB
-URI https://asc.fasb.org/1943274/2147480097/470-10-S99-1A
Reference 25: http://www.xbrl.org/2003/role/disclosureRef
-Topic 470
-SubTopic 10
-Name Accounting Standards Codification
-Section S99
-Paragraph 1A
-Subparagraph (SX 210.13-01(a)(4)(iv))
-Publisher FASB
-URI https://asc.fasb.org/1943274/2147480097/470-10-S99-1A
Reference 26: http://www.xbrl.org/2003/role/disclosureRef
-Topic 470
-SubTopic 10
-Name Accounting Standards Codification
-Section S99
-Paragraph 1A
-Subparagraph (SX 210.13-01(a)(5))
-Publisher FASB
-URI https://asc.fasb.org/1943274/2147480097/470-10-S99-1A
Reference 27: http://www.xbrl.org/2003/role/disclosureRef
-Topic 470
-SubTopic 10
-Name Accounting Standards Codification
-Section S99
-Paragraph 1B
-Subparagraph (SX 210.13-02(a)(4)(i))
-Publisher FASB
-URI https://asc.fasb.org/1943274/2147480097/470-10-S99-1B
Reference 28: http://www.xbrl.org/2003/role/disclosureRef
-Topic 470
-SubTopic 10
-Name Accounting Standards Codification
-Section S99
-Paragraph 1B
-Subparagraph (SX 210.13-02(a)(4)(iii)(A))
-Publisher FASB
-URI https://asc.fasb.org/1943274/2147480097/470-10-S99-1B
Reference 29: http://www.xbrl.org/2003/role/disclosureRef
-Topic 470
-SubTopic 10
-Name Accounting Standards Codification
-Section S99
-Paragraph 1B
-Subparagraph (SX 210.13-02(a)(4)(iii)(B))
-Publisher FASB
-URI https://asc.fasb.org/1943274/2147480097/470-10-S99-1B
Reference 30: http://www.xbrl.org/2003/role/disclosureRef
-Topic 470
-SubTopic 10
-Name Accounting Standards Codification
-Section S99
-Paragraph 1B
-Subparagraph (SX 210.13-02(a)(4)(iv))
-Publisher FASB
-URI https://asc.fasb.org/1943274/2147480097/470-10-S99-1B
Reference 31: http://www.xbrl.org/2003/role/disclosureRef
-Topic 470
-SubTopic 10
-Name Accounting Standards Codification
-Section S99
-Paragraph 1B
-Subparagraph (SX 210.13-02(a)(5))
-Publisher FASB
-URI https://asc.fasb.org/1943274/2147480097/470-10-S99-1B
Reference 32: http://www.xbrl.org/2003/role/disclosureRef
-Topic 260
-SubTopic 10
-Name Accounting Standards Codification
-Section 45
-Paragraph 60B
-Subparagraph (a)
-Publisher FASB
-URI https://asc.fasb.org/1943274/2147482689/260-10-45-60B
Reference 33: http://www.xbrl.org/2003/role/disclosureRef
-Topic 205
-SubTopic 20
-Name Accounting Standards Codification
-Section 50
-Paragraph 7
-Publisher FASB
-URI https://asc.fasb.org/1943274/2147483499/205-20-50-7
Reference 34: http://fasb.org/us-gaap/role/ref/legacyRef
-Topic 230
-SubTopic 10
-Name Accounting Standards Codification
-Section 45
-Paragraph 28
-Publisher FASB
-URI https://asc.fasb.org/1943274/2147482740/230-10-45-28
Reference 35: http://www.xbrl.org/2003/role/disclosureRef
-Topic 220
-SubTopic 10
-Name Accounting Standards Codification
-Section 45
-Paragraph 1A
-Subparagraph (a)
-Publisher FASB
-URI https://asc.fasb.org/1943274/2147482790/220-10-45-1A
Reference 36: http://www.xbrl.org/2003/role/disclosureRef
-Topic 220
-SubTopic 10
-Name Accounting Standards Codification
-Section 45
-Paragraph 1B
-Subparagraph (a)
-Publisher FASB
-URI https://asc.fasb.org/1943274/2147482790/220-10-45-1B
Reference 37: http://fasb.org/us-gaap/role/ref/legacyRef
-Topic 942
-SubTopic 220
-Name Accounting Standards Codification
-Section S99
-Paragraph 1
-Subparagraph (SX 210.9-04(22))
-Publisher FASB
-URI https://asc.fasb.org/1943274/2147478524/942-220-S99-1
| Name: |
us-gaap_NetIncomeLoss |
| Namespace Prefix: |
us-gaap_ |
| Data Type: |
xbrli:monetaryItemType |
| Balance Type: |
credit |
| Period Type: |
duration |
|
| X |
- DefinitionNumber of shares issued which are neither cancelled nor held in the treasury.
| Name: |
us-gaap_SharesOutstanding |
| Namespace Prefix: |
us-gaap_ |
| Data Type: |
xbrli:sharesItemType |
| Balance Type: |
na |
| Period Type: |
instant |
|
| X |
- DefinitionNumber of new stock issued during the period. Reference 1: http://fasb.org/us-gaap/role/ref/legacyRef
-Name Accounting Standards Codification
-Section 50
-Paragraph 2
-SubTopic 10
-Topic 505
-Publisher FASB
-URI https://asc.fasb.org/1943274/2147481112/505-10-50-2
Reference 2: http://fasb.org/us-gaap/role/ref/legacyRef
-Topic 210
-SubTopic 10
-Name Accounting Standards Codification
-Section S99
-Paragraph 1
-Subparagraph (SX 210.5-02(28))
-Publisher FASB
-URI https://asc.fasb.org/1943274/2147480566/210-10-S99-1
Reference 3: http://fasb.org/us-gaap/role/ref/legacyRef
-Topic 210
-SubTopic 10
-Name Accounting Standards Codification
-Section S99
-Paragraph 1
-Subparagraph (SX 210.5-02(29))
-Publisher FASB
-URI https://asc.fasb.org/1943274/2147480566/210-10-S99-1
Reference 4: http://www.xbrl.org/2003/role/disclosureRef
-Topic 946
-SubTopic 505
-Name Accounting Standards Codification
-Section 50
-Paragraph 2
-Subparagraph (a)
-Publisher FASB
-URI https://asc.fasb.org/1943274/2147478448/946-505-50-2
Reference 5: http://www.xbrl.org/2003/role/disclosureRef
-Topic 946
-SubTopic 220
-Name Accounting Standards Codification
-Section S99
-Paragraph 3
-Subparagraph (SX 210.6-09(4)(b))
-Publisher FASB
-URI https://asc.fasb.org/1943274/2147479134/946-220-S99-3
Reference 6: http://www.xbrl.org/2003/role/disclosureRef
-Topic 946
-SubTopic 10
-Name Accounting Standards Codification
-Section S99
-Paragraph 3
-Subparagraph (SX 210.6-03(i)(1))
-Publisher FASB
-URI https://asc.fasb.org/1943274/2147479886/946-10-S99-3
Reference 7: http://fasb.org/us-gaap/role/ref/legacyRef
-Topic 505
-SubTopic 10
-Name Accounting Standards Codification
-Section S99
-Paragraph 1
-Subparagraph (SX 210.3-04)
-Publisher FASB
-URI https://asc.fasb.org/1943274/2147480008/505-10-S99-1
| Name: |
us-gaap_StockIssuedDuringPeriodSharesNewIssues |
| Namespace Prefix: |
us-gaap_ |
| Data Type: |
xbrli:sharesItemType |
| Balance Type: |
na |
| Period Type: |
duration |
|
| X |
- DefinitionEquity impact of the value of new stock issued during the period. Includes shares issued in an initial public offering or a secondary public offering. Reference 1: http://fasb.org/us-gaap/role/ref/legacyRef
-Name Accounting Standards Codification
-Section 50
-Paragraph 2
-SubTopic 10
-Topic 505
-Publisher FASB
-URI https://asc.fasb.org/1943274/2147481112/505-10-50-2
Reference 2: http://fasb.org/us-gaap/role/ref/legacyRef
-Topic 210
-SubTopic 10
-Name Accounting Standards Codification
-Section S99
-Paragraph 1
-Subparagraph (SX 210.5-02(28))
-Publisher FASB
-URI https://asc.fasb.org/1943274/2147480566/210-10-S99-1
Reference 3: http://fasb.org/us-gaap/role/ref/legacyRef
-Topic 210
-SubTopic 10
-Name Accounting Standards Codification
-Section S99
-Paragraph 1
-Subparagraph (SX 210.5-02(29))
-Publisher FASB
-URI https://asc.fasb.org/1943274/2147480566/210-10-S99-1
Reference 4: http://www.xbrl.org/2003/role/exampleRef
-Topic 946
-SubTopic 830
-Name Accounting Standards Codification
-Section 55
-Paragraph 11
-Publisher FASB
-URI https://asc.fasb.org/1943274/2147479168/946-830-55-11
Reference 5: http://www.xbrl.org/2003/role/disclosureRef
-Topic 946
-SubTopic 205
-Name Accounting Standards Codification
-Section 45
-Paragraph 4
-Subparagraph (a)
-Publisher FASB
-URI https://asc.fasb.org/1943274/2147478009/946-205-45-4
Reference 6: http://www.xbrl.org/2003/role/disclosureRef
-Topic 946
-SubTopic 505
-Name Accounting Standards Codification
-Section 50
-Paragraph 2
-Subparagraph (a)
-Publisher FASB
-URI https://asc.fasb.org/1943274/2147478448/946-505-50-2
Reference 7: http://www.xbrl.org/2003/role/disclosureRef
-Topic 946
-SubTopic 220
-Name Accounting Standards Codification
-Section S99
-Paragraph 3
-Subparagraph (SX 210.6-09(4)(b))
-Publisher FASB
-URI https://asc.fasb.org/1943274/2147479134/946-220-S99-3
Reference 8: http://fasb.org/us-gaap/role/ref/legacyRef
-Topic 505
-SubTopic 10
-Name Accounting Standards Codification
-Section S99
-Paragraph 1
-Subparagraph (SX 210.3-04)
-Publisher FASB
-URI https://asc.fasb.org/1943274/2147480008/505-10-S99-1
| Name: |
us-gaap_StockIssuedDuringPeriodValueNewIssues |
| Namespace Prefix: |
us-gaap_ |
| Data Type: |
xbrli:monetaryItemType |
| Balance Type: |
credit |
| Period Type: |
duration |
|
| X |
- DefinitionAmount of equity (deficit) attributable to parent. Excludes temporary equity and equity attributable to noncontrolling interest. Reference 1: http://fasb.org/us-gaap/role/ref/legacyRef
-Topic 210
-SubTopic 10
-Name Accounting Standards Codification
-Section S99
-Paragraph 1
-Subparagraph (SX 210.5-02(29))
-Publisher FASB
-URI https://asc.fasb.org/1943274/2147480566/210-10-S99-1
Reference 2: http://fasb.org/us-gaap/role/ref/legacyRef
-Topic 210
-SubTopic 10
-Name Accounting Standards Codification
-Section S99
-Paragraph 1
-Subparagraph (SX 210.5-02(30))
-Publisher FASB
-URI https://asc.fasb.org/1943274/2147480566/210-10-S99-1
Reference 3: http://fasb.org/us-gaap/role/ref/legacyRef
-Topic 210
-SubTopic 10
-Name Accounting Standards Codification
-Section S99
-Paragraph 1
-Subparagraph (SX 210.5-02(31))
-Publisher FASB
-URI https://asc.fasb.org/1943274/2147480566/210-10-S99-1
Reference 4: http://www.xbrl.org/2003/role/exampleRef
-Topic 852
-SubTopic 10
-Name Accounting Standards Codification
-Section 55
-Paragraph 10
-Publisher FASB
-URI https://asc.fasb.org/1943274/2147481372/852-10-55-10
Reference 5: http://www.xbrl.org/2003/role/exampleRef
-Topic 946
-SubTopic 830
-Name Accounting Standards Codification
-Section 55
-Paragraph 12
-Publisher FASB
-URI https://asc.fasb.org/1943274/2147479168/946-830-55-12
Reference 6: http://www.xbrl.org/2003/role/disclosureRef
-Topic 946
-SubTopic 210
-Name Accounting Standards Codification
-Section S99
-Paragraph 1
-Subparagraph (SX 210.6-04(19))
-Publisher FASB
-URI https://asc.fasb.org/1943274/2147479170/946-210-S99-1
Reference 7: http://www.xbrl.org/2003/role/disclosureRef
-Topic 946
-SubTopic 210
-Name Accounting Standards Codification
-Section S99
-Paragraph 2
-Subparagraph (SX 210.6-05(4))
-Publisher FASB
-URI https://asc.fasb.org/1943274/2147479170/946-210-S99-2
Reference 8: http://www.xbrl.org/2009/role/commonPracticeRef
-Topic 946
-SubTopic 220
-Name Accounting Standards Codification
-Section S99
-Paragraph 3
-Subparagraph (SX 210.6-09(4)(b))
-Publisher FASB
-URI https://asc.fasb.org/1943274/2147479134/946-220-S99-3
Reference 9: http://www.xbrl.org/2003/role/disclosureRef
-Topic 946
-SubTopic 220
-Name Accounting Standards Codification
-Section S99
-Paragraph 3
-Subparagraph (SX 210.6-09(6))
-Publisher FASB
-URI https://asc.fasb.org/1943274/2147479134/946-220-S99-3
Reference 10: http://www.xbrl.org/2003/role/disclosureRef
-Topic 946
-SubTopic 220
-Name Accounting Standards Codification
-Section S99
-Paragraph 3
-Subparagraph (SX 210.6-09(7))
-Publisher FASB
-URI https://asc.fasb.org/1943274/2147479134/946-220-S99-3
Reference 11: http://www.xbrl.org/2009/role/commonPracticeRef
-Topic 235
-SubTopic 10
-Name Accounting Standards Codification
-Section S99
-Paragraph 1
-Subparagraph (SX 210.4-08(g)(1)(ii))
-Publisher FASB
-URI https://asc.fasb.org/1943274/2147480678/235-10-S99-1
Reference 12: http://www.xbrl.org/2009/role/commonPracticeRef
-Topic 323
-SubTopic 10
-Name Accounting Standards Codification
-Section 50
-Paragraph 3
-Subparagraph (c)
-Publisher FASB
-URI https://asc.fasb.org/1943274/2147481687/323-10-50-3
Reference 13: http://www.xbrl.org/2009/role/commonPracticeRef
-Topic 825
-SubTopic 10
-Name Accounting Standards Codification
-Section 50
-Paragraph 28
-Subparagraph (f)
-Publisher FASB
-URI https://asc.fasb.org/1943274/2147482907/825-10-50-28
Reference 14: http://fasb.org/us-gaap/role/ref/legacyRef
-Topic 310
-SubTopic 10
-Name Accounting Standards Codification
-Section S99
-Paragraph 2
-Subparagraph (SAB Topic 4.E)
-Publisher FASB
-URI https://asc.fasb.org/1943274/2147480418/310-10-S99-2
| Name: |
us-gaap_StockholdersEquity |
| Namespace Prefix: |
us-gaap_ |
| Data Type: |
xbrli:monetaryItemType |
| Balance Type: |
credit |
| Period Type: |
instant |
|
v3.25.0.1
Consolidated Statements of Cash Flows - USD ($)
|
12 Months Ended |
Dec. 31, 2024 |
Dec. 31, 2023 |
| CASH FLOW FROM OPERATING ACTIVITIES |
|
|
| Net loss |
$ (8,216,112)
|
$ (3,211,277)
|
| Adjustments to reconcile net loss to net cash used in operations |
|
|
| Depreciation and depletion |
160,001
|
167,527
|
| Impairment of oil and gas properties |
275,760
|
537,686
|
| Impairment of equity investment – Hupecol Meta LLC |
6,392,874
|
|
| Loss on disposal of oil and gas properties – Colombia |
|
2,343,126
|
| Accretion of plugging and abandonment costs |
|
2,707
|
| Stock-based compensation |
101,508
|
238,314
|
| Amortization of right of use asset |
75,120
|
67,181
|
| Change in operating assets and liabilities: |
|
|
| (Increase)/Decrease in accounts receivable |
(3,338)
|
92,839
|
| Decrease in accrued earning distributions from Hupecol Meta, LLC |
|
17,358
|
| (Increase)/Decrease in prepaid expense and other current assets |
(140,622)
|
31,942
|
| (Decrease)/Increase in accounts payable and accrued expenses |
(106,429)
|
41,174
|
| Decrease in operating lease liability |
(75,277)
|
(65,385)
|
| Net cash (used in) provided by operating activities |
(1,536,515)
|
263,191
|
| CASH FLOW FROM INVESTING ACTIVITIES |
|
|
| Payments for capital contribution for equity investment |
(1,887,516)
|
(2,403,219)
|
| Net cash used in investing activities |
(1,887,516)
|
(2,403,219)
|
| CASH FLOW FROM FINANCING ACTIVITIES |
|
|
| Proceeds from issuance of common stock for cash, net of offering costs |
2,325,000
|
1,652,000
|
| Net cash provided by financing activities |
2,325,000
|
1,652,000
|
| (DECREASE)/INCREASE IN CASH |
(1,099,031)
|
(488,028)
|
| Cash, beginning of year |
4,059,182
|
4,547,210
|
| Cash, end of year |
2,960,151
|
4,059,182
|
| SUPPLEMENTAL CASH FLOW INFORMATION: |
|
|
| Interest paid |
|
|
| Taxes paid |
|
|
| SUPPLEMENTAL NON-CASH INVESTING AND FINANCING ACTIVITIES |
|
|
| Change in estimate of asset retirement obligations, net |
$ 5,904
|
$ 9,706
|
| X |
- DefinitionImpairment charges on equity method investments.
| Name: |
HUSA_ImpairmentChargesOnEquityMethodInvestments |
| Namespace Prefix: |
HUSA_ |
| Data Type: |
xbrli:monetaryItemType |
| Balance Type: |
debit |
| Period Type: |
duration |
|
| X |
- DefinitionAmount recognized for the passage of time, typically for liabilities, that have been discounted to their net present values. Excludes accretion associated with asset retirement obligations. Reference 1: http://www.xbrl.org/2003/role/exampleRef
-Topic 420
-SubTopic 10
-Name Accounting Standards Codification
-Section 35
-Paragraph 4
-Publisher FASB
-URI https://asc.fasb.org/1943274/2147481639/420-10-35-4
Reference 2: http://www.xbrl.org/2009/role/commonPracticeRef
-Topic 420
-SubTopic 10
-Name Accounting Standards Codification
-Section 50
-Paragraph 1
-Subparagraph (b)(2)
-Publisher FASB
-URI https://asc.fasb.org/1943274/2147482017/420-10-50-1
| Name: |
us-gaap_AccretionExpense |
| Namespace Prefix: |
us-gaap_ |
| Data Type: |
xbrli:monetaryItemType |
| Balance Type: |
debit |
| Period Type: |
duration |
|
| X |
- References
+ Details
| Name: |
us-gaap_AdjustmentsToReconcileNetIncomeLossToCashProvidedByUsedInOperatingActivitiesAbstract |
| Namespace Prefix: |
us-gaap_ |
| Data Type: |
xbrli:stringItemType |
| Balance Type: |
na |
| Period Type: |
duration |
|
| X |
- DefinitionAmount of cash and cash equivalents, and cash and cash equivalents restricted to withdrawal or usage; including, but not limited to, disposal group and discontinued operations. Cash includes, but is not limited to, currency on hand, demand deposits with banks or financial institutions, and other accounts with general characteristics of demand deposits. Cash equivalents include, but are not limited to, short-term, highly liquid investments that are both readily convertible to known amounts of cash and so near their maturity that they present insignificant risk of changes in value because of changes in interest rates. Reference 1: http://www.xbrl.org/2003/role/disclosureRef
-Topic 230
-SubTopic 10
-Name Accounting Standards Codification
-Section 50
-Paragraph 8
-Publisher FASB
-URI https://asc.fasb.org/1943274/2147482913/230-10-50-8
Reference 2: http://fasb.org/us-gaap/role/ref/legacyRef
-Topic 230
-SubTopic 10
-Name Accounting Standards Codification
-Section 45
-Paragraph 24
-Publisher FASB
-URI https://asc.fasb.org/1943274/2147482740/230-10-45-24
Reference 3: http://fasb.org/us-gaap/role/ref/legacyRef
-Name Accounting Standards Codification
-Topic 230
-SubTopic 10
-Section 45
-Paragraph 4
-Publisher FASB
-URI https://asc.fasb.org/1943274/2147482740/230-10-45-4
| Name: |
us-gaap_CashCashEquivalentsRestrictedCashAndRestrictedCashEquivalentsIncludingDisposalGroupAndDiscontinuedOperations |
| Namespace Prefix: |
us-gaap_ |
| Data Type: |
xbrli:monetaryItemType |
| Balance Type: |
debit |
| Period Type: |
instant |
|
| X |
- DefinitionAmount of increase (decrease) in cash, cash equivalents, and cash and cash equivalents restricted to withdrawal or usage; including effect from exchange rate change. Cash includes, but is not limited to, currency on hand, demand deposits with banks or financial institutions, and other accounts with general characteristics of demand deposits. Cash equivalents include, but are not limited to, short-term, highly liquid investments that are both readily convertible to known amounts of cash and so near their maturity that they present insignificant risk of changes in value because of changes in interest rates. Reference 1: http://fasb.org/us-gaap/role/ref/legacyRef
-Topic 230
-SubTopic 10
-Name Accounting Standards Codification
-Section 45
-Paragraph 24
-Publisher FASB
-URI https://asc.fasb.org/1943274/2147482740/230-10-45-24
Reference 2: http://fasb.org/us-gaap/role/ref/legacyRef
-Name Accounting Standards Codification
-Section 45
-Paragraph 1
-SubTopic 230
-Topic 830
-Publisher FASB
-URI https://asc.fasb.org/1943274/2147477401/830-230-45-1
| Name: |
us-gaap_CashCashEquivalentsRestrictedCashAndRestrictedCashEquivalentsPeriodIncreaseDecreaseIncludingExchangeRateEffect |
| Namespace Prefix: |
us-gaap_ |
| Data Type: |
xbrli:monetaryItemType |
| Balance Type: |
debit |
| Period Type: |
duration |
|
| X |
- DefinitionThe aggregate expense recognized in the current period that allocates the cost of tangible assets, intangible assets, or depleting assets to periods that benefit from use of the assets. Reference 1: http://fasb.org/us-gaap/role/ref/legacyRef
-Name Accounting Standards Codification
-Section 45
-Paragraph 28
-Subparagraph (b)
-SubTopic 10
-Topic 230
-Publisher FASB
-URI https://asc.fasb.org/1943274/2147482740/230-10-45-28
Reference 2: http://www.xbrl.org/2003/role/exampleRef
-Topic 280
-SubTopic 10
-Name Accounting Standards Codification
-Section 55
-Paragraph 48
-Publisher FASB
-URI https://asc.fasb.org/1943274/2147482785/280-10-55-48
Reference 3: http://www.xbrl.org/2003/role/exampleRef
-Topic 280
-SubTopic 10
-Name Accounting Standards Codification
-Section 55
-Paragraph 49
-Publisher FASB
-URI https://asc.fasb.org/1943274/2147482785/280-10-55-49
Reference 4: http://www.xbrl.org/2003/role/disclosureRef
-Topic 270
-SubTopic 10
-Name Accounting Standards Codification
-Section 50
-Paragraph 1
-Subparagraph (i)
-Publisher FASB
-URI https://asc.fasb.org/1943274/2147482964/270-10-50-1
Reference 5: http://www.xbrl.org/2003/role/disclosureRef
-Topic 280
-SubTopic 10
-Name Accounting Standards Codification
-Section 50
-Paragraph 32
-Subparagraph (ee)
-Publisher FASB
-URI https://asc.fasb.org/1943274/2147482810/280-10-50-32
Reference 6: http://www.xbrl.org/2003/role/disclosureRef
-Topic 280
-SubTopic 10
-Name Accounting Standards Codification
-Section 50
-Paragraph 22
-Subparagraph (e)
-Publisher FASB
-URI https://asc.fasb.org/1943274/2147482810/280-10-50-22
| Name: |
us-gaap_DepreciationDepletionAndAmortization |
| Namespace Prefix: |
us-gaap_ |
| Data Type: |
xbrli:monetaryItemType |
| Balance Type: |
debit |
| Period Type: |
duration |
|
| X |
- DefinitionAmount of gain (loss) on sale or disposal of oil and gas property or timber property. Reference 1: http://fasb.org/us-gaap/role/ref/legacyRef
-Name Accounting Standards Codification
-Section 45
-Paragraph 28
-Subparagraph (b)
-SubTopic 10
-Topic 230
-Publisher FASB
-URI https://asc.fasb.org/1943274/2147482740/230-10-45-28
| Name: |
us-gaap_GainLossOnSaleOfProperty |
| Namespace Prefix: |
us-gaap_ |
| Data Type: |
xbrli:monetaryItemType |
| Balance Type: |
credit |
| Period Type: |
duration |
|
| X |
- DefinitionAmount of impairment loss for oil and gas properties with proved and unproved reserves in oil- and gas-producing activities. Reference 1: http://fasb.org/us-gaap/role/ref/legacyRef
-Name Accounting Standards Codification
-Section 45
-Paragraph 28
-Subparagraph (b)
-SubTopic 10
-Topic 230
-Publisher FASB
-URI https://asc.fasb.org/1943274/2147482740/230-10-45-28
Reference 2: http://fasb.org/us-gaap/role/ref/legacyRef
-Topic 360
-SubTopic 10
-Name Accounting Standards Codification
-Section 50
-Paragraph 2
-Subparagraph (b)
-Publisher FASB
-URI https://asc.fasb.org/1943274/2147482099/360-10-50-2
| Name: |
us-gaap_ImpairmentOfOilAndGasProperties |
| Namespace Prefix: |
us-gaap_ |
| Data Type: |
xbrli:monetaryItemType |
| Balance Type: |
debit |
| Period Type: |
duration |
|
| X |
- DefinitionThe increase (decrease) during the reporting period in the amounts payable to vendors for goods and services received and the amount of obligations and expenses incurred but not paid. Reference 1: http://fasb.org/us-gaap/role/ref/legacyRef
-Name Accounting Standards Codification
-Section 45
-Paragraph 28
-Subparagraph (a)
-SubTopic 10
-Topic 230
-Publisher FASB
-URI https://asc.fasb.org/1943274/2147482740/230-10-45-28
| Name: |
us-gaap_IncreaseDecreaseInAccountsPayableAndAccruedLiabilities |
| Namespace Prefix: |
us-gaap_ |
| Data Type: |
xbrli:monetaryItemType |
| Balance Type: |
debit |
| Period Type: |
duration |
|
| X |
- DefinitionThe increase (decrease) during the reporting period in amount due within one year (or one business cycle) from customers for the credit sale of goods and services. Reference 1: http://fasb.org/us-gaap/role/ref/legacyRef
-Name Accounting Standards Codification
-Section 45
-Paragraph 28
-Subparagraph (a)
-SubTopic 10
-Topic 230
-Publisher FASB
-URI https://asc.fasb.org/1943274/2147482740/230-10-45-28
| Name: |
us-gaap_IncreaseDecreaseInAccountsReceivable |
| Namespace Prefix: |
us-gaap_ |
| Data Type: |
xbrli:monetaryItemType |
| Balance Type: |
credit |
| Period Type: |
duration |
|
| X |
- DefinitionThe increase (decrease) during the reporting period in the amount due from borrowers for interest payments. Reference 1: http://fasb.org/us-gaap/role/ref/legacyRef
-Name Accounting Standards Codification
-Section 45
-Paragraph 28
-Subparagraph (a)
-SubTopic 10
-Topic 230
-Publisher FASB
-URI https://asc.fasb.org/1943274/2147482740/230-10-45-28
| Name: |
us-gaap_IncreaseDecreaseInAccruedInterestReceivableNet |
| Namespace Prefix: |
us-gaap_ |
| Data Type: |
xbrli:monetaryItemType |
| Balance Type: |
credit |
| Period Type: |
duration |
|
| X |
- References
+ Details
| Name: |
us-gaap_IncreaseDecreaseInOperatingCapitalAbstract |
| Namespace Prefix: |
us-gaap_ |
| Data Type: |
xbrli:stringItemType |
| Balance Type: |
na |
| Period Type: |
duration |
|
| X |
- DefinitionAmount of increase (decrease) in obligation for operating lease. Reference 1: http://www.xbrl.org/2009/role/commonPracticeRef
-Topic 230
-SubTopic 10
-Name Accounting Standards Codification
-Section 45
-Paragraph 28
-Subparagraph (a)
-Publisher FASB
-URI https://asc.fasb.org/1943274/2147482740/230-10-45-28
Reference 2: http://www.xbrl.org/2009/role/commonPracticeRef
-Name Accounting Standards Codification
-Section 50
-Paragraph 4
-Subparagraph (g)(1)
-SubTopic 20
-Topic 842
-Publisher FASB
-URI https://asc.fasb.org/1943274/2147478964/842-20-50-4
| Name: |
us-gaap_IncreaseDecreaseInOperatingLeaseLiability |
| Namespace Prefix: |
us-gaap_ |
| Data Type: |
xbrli:monetaryItemType |
| Balance Type: |
debit |
| Period Type: |
duration |
|
| X |
- DefinitionAmount of increase (decrease) in prepaid expenses, and assets classified as other. Reference 1: http://fasb.org/us-gaap/role/ref/legacyRef
-Name Accounting Standards Codification
-Section 45
-Paragraph 28
-Subparagraph (a)
-SubTopic 10
-Topic 230
-Publisher FASB
-URI https://asc.fasb.org/1943274/2147482740/230-10-45-28
| Name: |
us-gaap_IncreaseDecreaseInPrepaidDeferredExpenseAndOtherAssets |
| Namespace Prefix: |
us-gaap_ |
| Data Type: |
xbrli:monetaryItemType |
| Balance Type: |
credit |
| Period Type: |
duration |
|
| X |
- DefinitionAmount of cash paid for interest, excluding capitalized interest, classified as operating activity. Includes, but is not limited to, payment to settle zero-coupon bond for accreted interest of debt discount and debt instrument with insignificant coupon interest rate in relation to effective interest rate of borrowing attributable to accreted interest of debt discount. Reference 1: http://www.xbrl.org/2003/role/disclosureRef
-Topic 230
-SubTopic 10
-Name Accounting Standards Codification
-Section 45
-Paragraph 17
-Subparagraph (d)
-Publisher FASB
-URI https://asc.fasb.org/1943274/2147482740/230-10-45-17
Reference 2: http://www.xbrl.org/2003/role/disclosureRef
-Topic 230
-SubTopic 10
-Name Accounting Standards Codification
-Section 45
-Paragraph 25
-Subparagraph (e)
-Publisher FASB
-URI https://asc.fasb.org/1943274/2147482740/230-10-45-25
Reference 3: http://www.xbrl.org/2003/role/disclosureRef
-Topic 230
-SubTopic 10
-Name Accounting Standards Codification
-Section 50
-Paragraph 2
-Publisher FASB
-URI https://asc.fasb.org/1943274/2147482913/230-10-50-2
| Name: |
us-gaap_InterestPaidNet |
| Namespace Prefix: |
us-gaap_ |
| Data Type: |
xbrli:monetaryItemType |
| Balance Type: |
credit |
| Period Type: |
duration |
|
| X |
- DefinitionAmount of cash inflow (outflow) from financing activities, including discontinued operations. Financing activity cash flows include obtaining resources from owners and providing them with a return on, and a return of, their investment; borrowing money and repaying amounts borrowed, or settling the obligation; and obtaining and paying for other resources obtained from creditors on long-term credit. Reference 1: http://www.xbrl.org/2003/role/disclosureRef
-Topic 230
-SubTopic 10
-Name Accounting Standards Codification
-Section 45
-Paragraph 24
-Publisher FASB
-URI https://asc.fasb.org/1943274/2147482740/230-10-45-24
| Name: |
us-gaap_NetCashProvidedByUsedInFinancingActivities |
| Namespace Prefix: |
us-gaap_ |
| Data Type: |
xbrli:monetaryItemType |
| Balance Type: |
debit |
| Period Type: |
duration |
|
| X |
- References
+ Details
| Name: |
us-gaap_NetCashProvidedByUsedInFinancingActivitiesAbstract |
| Namespace Prefix: |
us-gaap_ |
| Data Type: |
xbrli:stringItemType |
| Balance Type: |
na |
| Period Type: |
duration |
|
| X |
- DefinitionAmount of cash inflow (outflow) from investing activities, including discontinued operations. Investing activity cash flows include making and collecting loans and acquiring and disposing of debt or equity instruments and property, plant, and equipment and other productive assets. Reference 1: http://www.xbrl.org/2003/role/disclosureRef
-Topic 230
-SubTopic 10
-Name Accounting Standards Codification
-Section 45
-Paragraph 24
-Publisher FASB
-URI https://asc.fasb.org/1943274/2147482740/230-10-45-24
| Name: |
us-gaap_NetCashProvidedByUsedInInvestingActivities |
| Namespace Prefix: |
us-gaap_ |
| Data Type: |
xbrli:monetaryItemType |
| Balance Type: |
debit |
| Period Type: |
duration |
|
| X |
- References
+ Details
| Name: |
us-gaap_NetCashProvidedByUsedInInvestingActivitiesAbstract |
| Namespace Prefix: |
us-gaap_ |
| Data Type: |
xbrli:stringItemType |
| Balance Type: |
na |
| Period Type: |
duration |
|
| X |
- DefinitionAmount of cash inflow (outflow) from operating activities, including discontinued operations. Operating activity cash flows include transactions, adjustments, and changes in value not defined as investing or financing activities. Reference 1: http://fasb.org/us-gaap/role/ref/legacyRef
-Topic 230
-SubTopic 10
-Name Accounting Standards Codification
-Section 45
-Paragraph 28
-Publisher FASB
-URI https://asc.fasb.org/1943274/2147482740/230-10-45-28
Reference 2: http://fasb.org/us-gaap/role/ref/legacyRef
-Topic 230
-SubTopic 10
-Name Accounting Standards Codification
-Section 45
-Paragraph 24
-Publisher FASB
-URI https://asc.fasb.org/1943274/2147482740/230-10-45-24
Reference 3: http://fasb.org/us-gaap/role/ref/legacyRef
-Topic 230
-SubTopic 10
-Name Accounting Standards Codification
-Section 45
-Paragraph 25
-Publisher FASB
-URI https://asc.fasb.org/1943274/2147482740/230-10-45-25
| Name: |
us-gaap_NetCashProvidedByUsedInOperatingActivities |
| Namespace Prefix: |
us-gaap_ |
| Data Type: |
xbrli:monetaryItemType |
| Balance Type: |
na |
| Period Type: |
duration |
|
| X |
- References
+ Details
| Name: |
us-gaap_NetCashProvidedByUsedInOperatingActivitiesAbstract |
| Namespace Prefix: |
us-gaap_ |
| Data Type: |
xbrli:stringItemType |
| Balance Type: |
na |
| Period Type: |
duration |
|
| X |
- DefinitionThe portion of profit or loss for the period, net of income taxes, which is attributable to the parent. Reference 1: http://www.xbrl.org/2003/role/disclosureRef
-Topic 250
-SubTopic 10
-Name Accounting Standards Codification
-Section 50
-Paragraph 6
-Publisher FASB
-URI https://asc.fasb.org/1943274/2147483443/250-10-50-6
Reference 2: http://www.xbrl.org/2003/role/disclosureRef
-Topic 250
-SubTopic 10
-Name Accounting Standards Codification
-Section 50
-Paragraph 9
-Publisher FASB
-URI https://asc.fasb.org/1943274/2147483443/250-10-50-9
Reference 3: http://www.xbrl.org/2003/role/disclosureRef
-Topic 805
-SubTopic 60
-Name Accounting Standards Codification
-Section 65
-Paragraph 1
-Subparagraph (g)
-Publisher FASB
-URI https://asc.fasb.org/1943274/2147476176/805-60-65-1
Reference 4: http://www.xbrl.org/2003/role/disclosureRef
-Topic 740
-SubTopic 323
-Name Accounting Standards Codification
-Section 65
-Paragraph 2
-Subparagraph (g)(3)
-Publisher FASB
-URI https://asc.fasb.org/1943274/2147478666/740-323-65-2
Reference 5: http://fasb.org/us-gaap/role/ref/legacyRef
-Topic 220
-SubTopic 10
-Name Accounting Standards Codification
-Section S99
-Paragraph 2
-Subparagraph (SX 210.5-03(20))
-Publisher FASB
-URI https://asc.fasb.org/1943274/2147483621/220-10-S99-2
Reference 6: http://www.xbrl.org/2003/role/disclosureRef
-Topic 235
-SubTopic 10
-Name Accounting Standards Codification
-Section S99
-Paragraph 1
-Subparagraph (SX 210.4-08(g)(1)(ii))
-Publisher FASB
-URI https://asc.fasb.org/1943274/2147480678/235-10-S99-1
Reference 7: http://www.xbrl.org/2003/role/disclosureRef
-Topic 323
-SubTopic 10
-Name Accounting Standards Codification
-Section 50
-Paragraph 3
-Subparagraph (c)
-Publisher FASB
-URI https://asc.fasb.org/1943274/2147481687/323-10-50-3
Reference 8: http://www.xbrl.org/2003/role/disclosureRef
-Topic 825
-SubTopic 10
-Name Accounting Standards Codification
-Section 50
-Paragraph 28
-Subparagraph (f)
-Publisher FASB
-URI https://asc.fasb.org/1943274/2147482907/825-10-50-28
Reference 9: http://www.xbrl.org/2003/role/disclosureRef
-Topic 220
-SubTopic 10
-Name Accounting Standards Codification
-Section 50
-Paragraph 6
-Publisher FASB
-URI https://asc.fasb.org/1943274/2147482765/220-10-50-6
Reference 10: http://www.xbrl.org/2003/role/disclosureRef
-Topic 250
-SubTopic 10
-Name Accounting Standards Codification
-Section 50
-Paragraph 3
-Publisher FASB
-URI https://asc.fasb.org/1943274/2147483443/250-10-50-3
Reference 11: http://www.xbrl.org/2003/role/disclosureRef
-Topic 250
-SubTopic 10
-Name Accounting Standards Codification
-Section 50
-Paragraph 1
-Subparagraph (b)(2)
-Publisher FASB
-URI https://asc.fasb.org/1943274/2147483443/250-10-50-1
Reference 12: http://www.xbrl.org/2003/role/disclosureRef
-Topic 815
-SubTopic 40
-Name Accounting Standards Codification
-Section 65
-Paragraph 1
-Subparagraph (f)
-Publisher FASB
-URI https://asc.fasb.org/1943274/2147480175/815-40-65-1
Reference 13: http://www.xbrl.org/2003/role/disclosureRef
-Topic 250
-SubTopic 10
-Name Accounting Standards Codification
-Section 50
-Paragraph 8
-Publisher FASB
-URI https://asc.fasb.org/1943274/2147483443/250-10-50-8
Reference 14: http://www.xbrl.org/2003/role/disclosureRef
-Topic 250
-SubTopic 10
-Name Accounting Standards Codification
-Section 50
-Paragraph 11
-Subparagraph (a)
-Publisher FASB
-URI https://asc.fasb.org/1943274/2147483443/250-10-50-11
Reference 15: http://www.xbrl.org/2003/role/disclosureRef
-Topic 250
-SubTopic 10
-Name Accounting Standards Codification
-Section 50
-Paragraph 11
-Subparagraph (b)
-Publisher FASB
-URI https://asc.fasb.org/1943274/2147483443/250-10-50-11
Reference 16: http://www.xbrl.org/2003/role/disclosureRef
-Topic 250
-SubTopic 10
-Name Accounting Standards Codification
-Section 50
-Paragraph 4
-Publisher FASB
-URI https://asc.fasb.org/1943274/2147483443/250-10-50-4
Reference 17: http://www.xbrl.org/2003/role/exampleRef
-Topic 946
-SubTopic 830
-Name Accounting Standards Codification
-Section 55
-Paragraph 10
-Publisher FASB
-URI https://asc.fasb.org/1943274/2147479168/946-830-55-10
Reference 18: http://www.xbrl.org/2003/role/disclosureRef
-Topic 946
-SubTopic 220
-Name Accounting Standards Codification
-Section 45
-Paragraph 7
-Publisher FASB
-URI https://asc.fasb.org/1943274/2147479105/946-220-45-7
Reference 19: http://www.xbrl.org/2003/role/disclosureRef
-Topic 944
-SubTopic 220
-Name Accounting Standards Codification
-Section S99
-Paragraph 1
-Subparagraph (SX 210.7-04(18))
-Publisher FASB
-URI https://asc.fasb.org/1943274/2147477250/944-220-S99-1
Reference 20: http://www.xbrl.org/2003/role/disclosureRef
-Topic 946
-SubTopic 220
-Name Accounting Standards Codification
-Section S99
-Paragraph 1
-Subparagraph (SX 210.6-07(9))
-Publisher FASB
-URI https://asc.fasb.org/1943274/2147479134/946-220-S99-1
Reference 21: http://www.xbrl.org/2003/role/disclosureRef
-Topic 946
-SubTopic 220
-Name Accounting Standards Codification
-Section S99
-Paragraph 3
-Subparagraph (SX 210.6-09(1)(d))
-Publisher FASB
-URI https://asc.fasb.org/1943274/2147479134/946-220-S99-3
Reference 22: http://www.xbrl.org/2003/role/disclosureRef
-Topic 470
-SubTopic 10
-Name Accounting Standards Codification
-Section S99
-Paragraph 1A
-Subparagraph (SX 210.13-01(a)(4)(i))
-Publisher FASB
-URI https://asc.fasb.org/1943274/2147480097/470-10-S99-1A
Reference 23: http://www.xbrl.org/2009/role/commonPracticeRef
-Topic 470
-SubTopic 10
-Name Accounting Standards Codification
-Section S99
-Paragraph 1A
-Subparagraph (SX 210.13-01(a)(4)(ii))
-Publisher FASB
-URI https://asc.fasb.org/1943274/2147480097/470-10-S99-1A
Reference 24: http://www.xbrl.org/2003/role/disclosureRef
-Topic 470
-SubTopic 10
-Name Accounting Standards Codification
-Section S99
-Paragraph 1A
-Subparagraph (SX 210.13-01(a)(4)(iii)(A))
-Publisher FASB
-URI https://asc.fasb.org/1943274/2147480097/470-10-S99-1A
Reference 25: http://www.xbrl.org/2003/role/disclosureRef
-Topic 470
-SubTopic 10
-Name Accounting Standards Codification
-Section S99
-Paragraph 1A
-Subparagraph (SX 210.13-01(a)(4)(iv))
-Publisher FASB
-URI https://asc.fasb.org/1943274/2147480097/470-10-S99-1A
Reference 26: http://www.xbrl.org/2003/role/disclosureRef
-Topic 470
-SubTopic 10
-Name Accounting Standards Codification
-Section S99
-Paragraph 1A
-Subparagraph (SX 210.13-01(a)(5))
-Publisher FASB
-URI https://asc.fasb.org/1943274/2147480097/470-10-S99-1A
Reference 27: http://www.xbrl.org/2003/role/disclosureRef
-Topic 470
-SubTopic 10
-Name Accounting Standards Codification
-Section S99
-Paragraph 1B
-Subparagraph (SX 210.13-02(a)(4)(i))
-Publisher FASB
-URI https://asc.fasb.org/1943274/2147480097/470-10-S99-1B
Reference 28: http://www.xbrl.org/2003/role/disclosureRef
-Topic 470
-SubTopic 10
-Name Accounting Standards Codification
-Section S99
-Paragraph 1B
-Subparagraph (SX 210.13-02(a)(4)(iii)(A))
-Publisher FASB
-URI https://asc.fasb.org/1943274/2147480097/470-10-S99-1B
Reference 29: http://www.xbrl.org/2003/role/disclosureRef
-Topic 470
-SubTopic 10
-Name Accounting Standards Codification
-Section S99
-Paragraph 1B
-Subparagraph (SX 210.13-02(a)(4)(iii)(B))
-Publisher FASB
-URI https://asc.fasb.org/1943274/2147480097/470-10-S99-1B
Reference 30: http://www.xbrl.org/2003/role/disclosureRef
-Topic 470
-SubTopic 10
-Name Accounting Standards Codification
-Section S99
-Paragraph 1B
-Subparagraph (SX 210.13-02(a)(4)(iv))
-Publisher FASB
-URI https://asc.fasb.org/1943274/2147480097/470-10-S99-1B
Reference 31: http://www.xbrl.org/2003/role/disclosureRef
-Topic 470
-SubTopic 10
-Name Accounting Standards Codification
-Section S99
-Paragraph 1B
-Subparagraph (SX 210.13-02(a)(5))
-Publisher FASB
-URI https://asc.fasb.org/1943274/2147480097/470-10-S99-1B
Reference 32: http://www.xbrl.org/2003/role/disclosureRef
-Topic 260
-SubTopic 10
-Name Accounting Standards Codification
-Section 45
-Paragraph 60B
-Subparagraph (a)
-Publisher FASB
-URI https://asc.fasb.org/1943274/2147482689/260-10-45-60B
Reference 33: http://www.xbrl.org/2003/role/disclosureRef
-Topic 205
-SubTopic 20
-Name Accounting Standards Codification
-Section 50
-Paragraph 7
-Publisher FASB
-URI https://asc.fasb.org/1943274/2147483499/205-20-50-7
Reference 34: http://fasb.org/us-gaap/role/ref/legacyRef
-Topic 230
-SubTopic 10
-Name Accounting Standards Codification
-Section 45
-Paragraph 28
-Publisher FASB
-URI https://asc.fasb.org/1943274/2147482740/230-10-45-28
Reference 35: http://www.xbrl.org/2003/role/disclosureRef
-Topic 220
-SubTopic 10
-Name Accounting Standards Codification
-Section 45
-Paragraph 1A
-Subparagraph (a)
-Publisher FASB
-URI https://asc.fasb.org/1943274/2147482790/220-10-45-1A
Reference 36: http://www.xbrl.org/2003/role/disclosureRef
-Topic 220
-SubTopic 10
-Name Accounting Standards Codification
-Section 45
-Paragraph 1B
-Subparagraph (a)
-Publisher FASB
-URI https://asc.fasb.org/1943274/2147482790/220-10-45-1B
Reference 37: http://fasb.org/us-gaap/role/ref/legacyRef
-Topic 942
-SubTopic 220
-Name Accounting Standards Codification
-Section S99
-Paragraph 1
-Subparagraph (SX 210.9-04(22))
-Publisher FASB
-URI https://asc.fasb.org/1943274/2147478524/942-220-S99-1
| Name: |
us-gaap_NetIncomeLoss |
| Namespace Prefix: |
us-gaap_ |
| Data Type: |
xbrli:monetaryItemType |
| Balance Type: |
credit |
| Period Type: |
duration |
|
| X |
- References
+ Details
| Name: |
us-gaap_NoncashInvestingAndFinancingItemsAbstract |
| Namespace Prefix: |
us-gaap_ |
| Data Type: |
xbrli:stringItemType |
| Balance Type: |
na |
| Period Type: |
duration |
|
| X |
- DefinitionAmount of periodic reduction over lease term of carrying amount of right-of-use asset from operating lease. Reference 1: http://www.xbrl.org/2009/role/commonPracticeRef
-Topic 230
-SubTopic 10
-Name Accounting Standards Codification
-Section 45
-Paragraph 28
-Subparagraph (b)
-Publisher FASB
-URI https://asc.fasb.org/1943274/2147482740/230-10-45-28
| Name: |
us-gaap_OperatingLeaseRightOfUseAssetAmortizationExpense |
| Namespace Prefix: |
us-gaap_ |
| Data Type: |
xbrli:monetaryItemType |
| Balance Type: |
debit |
| Period Type: |
duration |
|
| X |
- DefinitionThe cash outflow associated with the purchase of all investments (debt, security, other) during the period. Reference 1: http://fasb.org/us-gaap/role/ref/legacyRef
-Topic 230
-SubTopic 10
-Name Accounting Standards Codification
-Section 45
-Paragraph 13
-Publisher FASB
-URI https://asc.fasb.org/1943274/2147482740/230-10-45-13
| Name: |
us-gaap_PaymentsToAcquireInvestments |
| Namespace Prefix: |
us-gaap_ |
| Data Type: |
xbrli:monetaryItemType |
| Balance Type: |
credit |
| Period Type: |
duration |
|
| X |
- DefinitionThe cash inflow from the additional capital contribution to the entity. Reference 1: http://fasb.org/us-gaap/role/ref/legacyRef
-Name Accounting Standards Codification
-Section 45
-Paragraph 14
-Subparagraph (a)
-SubTopic 10
-Topic 230
-Publisher FASB
-URI https://asc.fasb.org/1943274/2147482740/230-10-45-14
| Name: |
us-gaap_ProceedsFromIssuanceOfCommonStock |
| Namespace Prefix: |
us-gaap_ |
| Data Type: |
xbrli:monetaryItemType |
| Balance Type: |
debit |
| Period Type: |
duration |
|
| X |
- DefinitionAmount of asset retirement obligations settled through noncash transactions. An asset retirement obligation is a legal obligation associated with the disposal or retirement from service of a tangible long-lived asset. Reference 1: http://fasb.org/us-gaap/role/ref/legacyRef
-Name Accounting Standards Codification
-Topic 230
-SubTopic 10
-Section 50
-Paragraph 4
-Publisher FASB
-URI https://asc.fasb.org/1943274/2147482913/230-10-50-4
Reference 2: http://fasb.org/us-gaap/role/ref/legacyRef
-Name Accounting Standards Codification
-Topic 230
-SubTopic 10
-Section 50
-Paragraph 3
-Publisher FASB
-URI https://asc.fasb.org/1943274/2147482913/230-10-50-3
Reference 3: http://fasb.org/us-gaap/role/ref/legacyRef
-Name Accounting Standards Codification
-Topic 230
-SubTopic 10
-Section 50
-Paragraph 5
-Publisher FASB
-URI https://asc.fasb.org/1943274/2147482913/230-10-50-5
| Name: |
us-gaap_SettlementOfAssetRetirementObligationsThroughNoncashPaymentsAmount |
| Namespace Prefix: |
us-gaap_ |
| Data Type: |
xbrli:monetaryItemType |
| Balance Type: |
debit |
| Period Type: |
duration |
|
| X |
- DefinitionAmount of noncash expense for share-based payment arrangement. Reference 1: http://fasb.org/us-gaap/role/ref/legacyRef
-Name Accounting Standards Codification
-Section 45
-Paragraph 28
-Subparagraph (a)
-SubTopic 10
-Topic 230
-Publisher FASB
-URI https://asc.fasb.org/1943274/2147482740/230-10-45-28
| Name: |
us-gaap_ShareBasedCompensation |
| Namespace Prefix: |
us-gaap_ |
| Data Type: |
xbrli:monetaryItemType |
| Balance Type: |
debit |
| Period Type: |
duration |
|
v3.25.0.1
| X |
- ReferencesReference 1: http://www.xbrl.org/2003/role/presentationRef
-Publisher SEC
-Name Regulation S-K
-Number 229
-Section 402
-Subsection v
-Paragraph 1
| Name: |
ecd_PvpTable |
| Namespace Prefix: |
ecd_ |
| Data Type: |
xbrli:stringItemType |
| Balance Type: |
na |
| Period Type: |
duration |
|
| X |
- DefinitionThe portion of profit or loss for the period, net of income taxes, which is attributable to the parent. Reference 1: http://www.xbrl.org/2003/role/disclosureRef
-Topic 250
-SubTopic 10
-Name Accounting Standards Codification
-Section 50
-Paragraph 6
-Publisher FASB
-URI https://asc.fasb.org/1943274/2147483443/250-10-50-6
Reference 2: http://www.xbrl.org/2003/role/disclosureRef
-Topic 250
-SubTopic 10
-Name Accounting Standards Codification
-Section 50
-Paragraph 9
-Publisher FASB
-URI https://asc.fasb.org/1943274/2147483443/250-10-50-9
Reference 3: http://www.xbrl.org/2003/role/disclosureRef
-Topic 805
-SubTopic 60
-Name Accounting Standards Codification
-Section 65
-Paragraph 1
-Subparagraph (g)
-Publisher FASB
-URI https://asc.fasb.org/1943274/2147476176/805-60-65-1
Reference 4: http://www.xbrl.org/2003/role/disclosureRef
-Topic 740
-SubTopic 323
-Name Accounting Standards Codification
-Section 65
-Paragraph 2
-Subparagraph (g)(3)
-Publisher FASB
-URI https://asc.fasb.org/1943274/2147478666/740-323-65-2
Reference 5: http://fasb.org/us-gaap/role/ref/legacyRef
-Topic 220
-SubTopic 10
-Name Accounting Standards Codification
-Section S99
-Paragraph 2
-Subparagraph (SX 210.5-03(20))
-Publisher FASB
-URI https://asc.fasb.org/1943274/2147483621/220-10-S99-2
Reference 6: http://www.xbrl.org/2003/role/disclosureRef
-Topic 235
-SubTopic 10
-Name Accounting Standards Codification
-Section S99
-Paragraph 1
-Subparagraph (SX 210.4-08(g)(1)(ii))
-Publisher FASB
-URI https://asc.fasb.org/1943274/2147480678/235-10-S99-1
Reference 7: http://www.xbrl.org/2003/role/disclosureRef
-Topic 323
-SubTopic 10
-Name Accounting Standards Codification
-Section 50
-Paragraph 3
-Subparagraph (c)
-Publisher FASB
-URI https://asc.fasb.org/1943274/2147481687/323-10-50-3
Reference 8: http://www.xbrl.org/2003/role/disclosureRef
-Topic 825
-SubTopic 10
-Name Accounting Standards Codification
-Section 50
-Paragraph 28
-Subparagraph (f)
-Publisher FASB
-URI https://asc.fasb.org/1943274/2147482907/825-10-50-28
Reference 9: http://www.xbrl.org/2003/role/disclosureRef
-Topic 220
-SubTopic 10
-Name Accounting Standards Codification
-Section 50
-Paragraph 6
-Publisher FASB
-URI https://asc.fasb.org/1943274/2147482765/220-10-50-6
Reference 10: http://www.xbrl.org/2003/role/disclosureRef
-Topic 250
-SubTopic 10
-Name Accounting Standards Codification
-Section 50
-Paragraph 3
-Publisher FASB
-URI https://asc.fasb.org/1943274/2147483443/250-10-50-3
Reference 11: http://www.xbrl.org/2003/role/disclosureRef
-Topic 250
-SubTopic 10
-Name Accounting Standards Codification
-Section 50
-Paragraph 1
-Subparagraph (b)(2)
-Publisher FASB
-URI https://asc.fasb.org/1943274/2147483443/250-10-50-1
Reference 12: http://www.xbrl.org/2003/role/disclosureRef
-Topic 815
-SubTopic 40
-Name Accounting Standards Codification
-Section 65
-Paragraph 1
-Subparagraph (f)
-Publisher FASB
-URI https://asc.fasb.org/1943274/2147480175/815-40-65-1
Reference 13: http://www.xbrl.org/2003/role/disclosureRef
-Topic 250
-SubTopic 10
-Name Accounting Standards Codification
-Section 50
-Paragraph 8
-Publisher FASB
-URI https://asc.fasb.org/1943274/2147483443/250-10-50-8
Reference 14: http://www.xbrl.org/2003/role/disclosureRef
-Topic 250
-SubTopic 10
-Name Accounting Standards Codification
-Section 50
-Paragraph 11
-Subparagraph (a)
-Publisher FASB
-URI https://asc.fasb.org/1943274/2147483443/250-10-50-11
Reference 15: http://www.xbrl.org/2003/role/disclosureRef
-Topic 250
-SubTopic 10
-Name Accounting Standards Codification
-Section 50
-Paragraph 11
-Subparagraph (b)
-Publisher FASB
-URI https://asc.fasb.org/1943274/2147483443/250-10-50-11
Reference 16: http://www.xbrl.org/2003/role/disclosureRef
-Topic 250
-SubTopic 10
-Name Accounting Standards Codification
-Section 50
-Paragraph 4
-Publisher FASB
-URI https://asc.fasb.org/1943274/2147483443/250-10-50-4
Reference 17: http://www.xbrl.org/2003/role/exampleRef
-Topic 946
-SubTopic 830
-Name Accounting Standards Codification
-Section 55
-Paragraph 10
-Publisher FASB
-URI https://asc.fasb.org/1943274/2147479168/946-830-55-10
Reference 18: http://www.xbrl.org/2003/role/disclosureRef
-Topic 946
-SubTopic 220
-Name Accounting Standards Codification
-Section 45
-Paragraph 7
-Publisher FASB
-URI https://asc.fasb.org/1943274/2147479105/946-220-45-7
Reference 19: http://www.xbrl.org/2003/role/disclosureRef
-Topic 944
-SubTopic 220
-Name Accounting Standards Codification
-Section S99
-Paragraph 1
-Subparagraph (SX 210.7-04(18))
-Publisher FASB
-URI https://asc.fasb.org/1943274/2147477250/944-220-S99-1
Reference 20: http://www.xbrl.org/2003/role/disclosureRef
-Topic 946
-SubTopic 220
-Name Accounting Standards Codification
-Section S99
-Paragraph 1
-Subparagraph (SX 210.6-07(9))
-Publisher FASB
-URI https://asc.fasb.org/1943274/2147479134/946-220-S99-1
Reference 21: http://www.xbrl.org/2003/role/disclosureRef
-Topic 946
-SubTopic 220
-Name Accounting Standards Codification
-Section S99
-Paragraph 3
-Subparagraph (SX 210.6-09(1)(d))
-Publisher FASB
-URI https://asc.fasb.org/1943274/2147479134/946-220-S99-3
Reference 22: http://www.xbrl.org/2003/role/disclosureRef
-Topic 470
-SubTopic 10
-Name Accounting Standards Codification
-Section S99
-Paragraph 1A
-Subparagraph (SX 210.13-01(a)(4)(i))
-Publisher FASB
-URI https://asc.fasb.org/1943274/2147480097/470-10-S99-1A
Reference 23: http://www.xbrl.org/2009/role/commonPracticeRef
-Topic 470
-SubTopic 10
-Name Accounting Standards Codification
-Section S99
-Paragraph 1A
-Subparagraph (SX 210.13-01(a)(4)(ii))
-Publisher FASB
-URI https://asc.fasb.org/1943274/2147480097/470-10-S99-1A
Reference 24: http://www.xbrl.org/2003/role/disclosureRef
-Topic 470
-SubTopic 10
-Name Accounting Standards Codification
-Section S99
-Paragraph 1A
-Subparagraph (SX 210.13-01(a)(4)(iii)(A))
-Publisher FASB
-URI https://asc.fasb.org/1943274/2147480097/470-10-S99-1A
Reference 25: http://www.xbrl.org/2003/role/disclosureRef
-Topic 470
-SubTopic 10
-Name Accounting Standards Codification
-Section S99
-Paragraph 1A
-Subparagraph (SX 210.13-01(a)(4)(iv))
-Publisher FASB
-URI https://asc.fasb.org/1943274/2147480097/470-10-S99-1A
Reference 26: http://www.xbrl.org/2003/role/disclosureRef
-Topic 470
-SubTopic 10
-Name Accounting Standards Codification
-Section S99
-Paragraph 1A
-Subparagraph (SX 210.13-01(a)(5))
-Publisher FASB
-URI https://asc.fasb.org/1943274/2147480097/470-10-S99-1A
Reference 27: http://www.xbrl.org/2003/role/disclosureRef
-Topic 470
-SubTopic 10
-Name Accounting Standards Codification
-Section S99
-Paragraph 1B
-Subparagraph (SX 210.13-02(a)(4)(i))
-Publisher FASB
-URI https://asc.fasb.org/1943274/2147480097/470-10-S99-1B
Reference 28: http://www.xbrl.org/2003/role/disclosureRef
-Topic 470
-SubTopic 10
-Name Accounting Standards Codification
-Section S99
-Paragraph 1B
-Subparagraph (SX 210.13-02(a)(4)(iii)(A))
-Publisher FASB
-URI https://asc.fasb.org/1943274/2147480097/470-10-S99-1B
Reference 29: http://www.xbrl.org/2003/role/disclosureRef
-Topic 470
-SubTopic 10
-Name Accounting Standards Codification
-Section S99
-Paragraph 1B
-Subparagraph (SX 210.13-02(a)(4)(iii)(B))
-Publisher FASB
-URI https://asc.fasb.org/1943274/2147480097/470-10-S99-1B
Reference 30: http://www.xbrl.org/2003/role/disclosureRef
-Topic 470
-SubTopic 10
-Name Accounting Standards Codification
-Section S99
-Paragraph 1B
-Subparagraph (SX 210.13-02(a)(4)(iv))
-Publisher FASB
-URI https://asc.fasb.org/1943274/2147480097/470-10-S99-1B
Reference 31: http://www.xbrl.org/2003/role/disclosureRef
-Topic 470
-SubTopic 10
-Name Accounting Standards Codification
-Section S99
-Paragraph 1B
-Subparagraph (SX 210.13-02(a)(5))
-Publisher FASB
-URI https://asc.fasb.org/1943274/2147480097/470-10-S99-1B
Reference 32: http://www.xbrl.org/2003/role/disclosureRef
-Topic 260
-SubTopic 10
-Name Accounting Standards Codification
-Section 45
-Paragraph 60B
-Subparagraph (a)
-Publisher FASB
-URI https://asc.fasb.org/1943274/2147482689/260-10-45-60B
Reference 33: http://www.xbrl.org/2003/role/disclosureRef
-Topic 205
-SubTopic 20
-Name Accounting Standards Codification
-Section 50
-Paragraph 7
-Publisher FASB
-URI https://asc.fasb.org/1943274/2147483499/205-20-50-7
Reference 34: http://fasb.org/us-gaap/role/ref/legacyRef
-Topic 230
-SubTopic 10
-Name Accounting Standards Codification
-Section 45
-Paragraph 28
-Publisher FASB
-URI https://asc.fasb.org/1943274/2147482740/230-10-45-28
Reference 35: http://www.xbrl.org/2003/role/disclosureRef
-Topic 220
-SubTopic 10
-Name Accounting Standards Codification
-Section 45
-Paragraph 1A
-Subparagraph (a)
-Publisher FASB
-URI https://asc.fasb.org/1943274/2147482790/220-10-45-1A
Reference 36: http://www.xbrl.org/2003/role/disclosureRef
-Topic 220
-SubTopic 10
-Name Accounting Standards Codification
-Section 45
-Paragraph 1B
-Subparagraph (a)
-Publisher FASB
-URI https://asc.fasb.org/1943274/2147482790/220-10-45-1B
Reference 37: http://fasb.org/us-gaap/role/ref/legacyRef
-Topic 942
-SubTopic 220
-Name Accounting Standards Codification
-Section S99
-Paragraph 1
-Subparagraph (SX 210.9-04(22))
-Publisher FASB
-URI https://asc.fasb.org/1943274/2147478524/942-220-S99-1
| Name: |
us-gaap_NetIncomeLoss |
| Namespace Prefix: |
us-gaap_ |
| Data Type: |
xbrli:monetaryItemType |
| Balance Type: |
credit |
| Period Type: |
duration |
|
v3.25.0.1
| X |
- ReferencesReference 1: http://www.xbrl.org/2003/role/presentationRef
-Publisher SEC
-Name Regulation S-K
-Number 229
-Section 408
-Subsection a
| Name: |
ecd_InsiderTradingArrLineItems |
| Namespace Prefix: |
ecd_ |
| Data Type: |
xbrli:stringItemType |
| Balance Type: |
na |
| Period Type: |
duration |
|
v3.25.0.1
Cybersecurity Risk Management and Strategy Disclosure
|
12 Months Ended |
Dec. 31, 2024 |
|---|
| Cybersecurity Risk Management, Strategy, and Governance [Abstract] |
|
| Cybersecurity Risk Management Processes for Assessing, Identifying, and Managing Threats [Text Block] |
We do not presently maintain any formal processes for assessing, identifying and managing material risks from cybersecurity threats.
We
engage a consultant to maintain our website, email, financial record keeping and related internet capabilities, including, as necessary,
addressing any cybersecurity incidents. To date we have not experienced any material cybersecurity incidents. Given the nature of our
operations (single location, minimal customer interface, no gathering of customer digital data, etc.), we do not believe that we are
reasonably likely to face any material cybersecurity risks.
|
| Cybersecurity Risk Management Processes Integrated [Flag] |
false
|
| Cybersecurity Risk Management Processes Integrated [Text Block] |
We do not presently maintain any formal processes for assessing, identifying and managing material risks from cybersecurity threats.
|
| Cybersecurity Risk Management Third Party Engaged [Flag] |
true
|
| Cybersecurity Risk Materially Affected or Reasonably Likely to Materially Affect Registrant [Flag] |
false
|
| Cybersecurity Risk Materially Affected or Reasonably Likely to Materially Affect Registrant [Text Block] |
we do not believe that we are
reasonably likely to face any material cybersecurity risks.
|
| Cybersecurity Risk Board of Directors Oversight [Text Block] |
Our
audit committee is tasked with oversight of risks from cybersecurity threats. Our audit committee interfaces with our consultant periodically
to assess vulnerability to cybersecurity threats and determine actions to be taken in response to such threats. In the event risks are identified and actions are recommended by our consultant, our audit committee will communicate the same to our chief executive officer
who is charged with interfacing with our consultant in addressing any identified cybersecurity threats. Similarly, if our officers become
aware of material cybersecurity threats, they are charged with communicating the same to our audit committee.
|
| Cybersecurity Risk Board Committee or Subcommittee Responsible for Oversight [Text Block] |
Our
audit committee is tasked with oversight of risks from cybersecurity threats. Our audit committee interfaces with our consultant periodically
to assess vulnerability to cybersecurity threats and determine actions to be taken in response to such threats.
|
| Cybersecurity Risk Management Positions or Committees Responsible [Flag] |
true
|
| Cybersecurity Risk Management Positions or Committees Responsible [Text Block] |
In the event risks are identified and actions are recommended by our consultant, our audit committee will communicate the same to our chief executive officer
who is charged with interfacing with our consultant in addressing any identified cybersecurity threats. Similarly, if our officers become
aware of material cybersecurity threats, they are charged with communicating the same to our audit committee.
|
| Cybersecurity Risk Board of Directors Oversight [Text Block] |
Our
audit committee is tasked with oversight of risks from cybersecurity threats. Our audit committee interfaces with our consultant periodically
to assess vulnerability to cybersecurity threats and determine actions to be taken in response to such threats. In the event risks are identified and actions are recommended by our consultant, our audit committee will communicate the same to our chief executive officer
who is charged with interfacing with our consultant in addressing any identified cybersecurity threats. Similarly, if our officers become
aware of material cybersecurity threats, they are charged with communicating the same to our audit committee.
|
| Cybersecurity Risk Process for Informing Management or Committees Responsible [Text Block] |
Similarly, if our officers become
aware of material cybersecurity threats, they are charged with communicating the same to our audit committee.
|
| X |
- ReferencesReference 1: http://www.xbrl.org/2003/role/presentationRef
-Publisher SEC
-Name Regulation S-K
-Section 106
-Subsection c
-Paragraph 1
Reference 2: http://www.xbrl.org/2003/role/presentationRef
-Publisher SEC
-Name Form 20-F
-Section 16K
-Subsection c
-Paragraph 1
| Name: |
cyd_CybersecurityRiskBoardCommitteeOrSubcommitteeResponsibleForOversightTextBlock |
| Namespace Prefix: |
cyd_ |
| Data Type: |
dtr-types:textBlockItemType |
| Balance Type: |
na |
| Period Type: |
duration |
|
| X |
- ReferencesReference 1: http://www.xbrl.org/2003/role/presentationRef
-Publisher SEC
-Name Regulation S-K
-Section 106
-Subsection c
-Paragraph 1
Reference 2: http://www.xbrl.org/2003/role/presentationRef
-Publisher SEC
-Name Form 20-F
-Section 16K
-Subsection c
-Paragraph 1
| Name: |
cyd_CybersecurityRiskBoardOfDirectorsOversightTextBlock |
| Namespace Prefix: |
cyd_ |
| Data Type: |
dtr-types:textBlockItemType |
| Balance Type: |
na |
| Period Type: |
duration |
|
| X |
- ReferencesReference 1: http://www.xbrl.org/2003/role/presentationRef
-Publisher SEC
-Name Regulation S-K
-Section 106
-Subsection c
-Paragraph 2
-Subparagraph i
Reference 2: http://www.xbrl.org/2003/role/presentationRef
-Publisher SEC
-Name Form 20-F
-Section 16K
-Subsection c
-Paragraph 2
-Subparagraph i
| Name: |
cyd_CybersecurityRiskManagementPositionsOrCommitteesResponsibleFlag |
| Namespace Prefix: |
cyd_ |
| Data Type: |
i:booleanItemType |
| Balance Type: |
na |
| Period Type: |
duration |
|
| X |
- ReferencesReference 1: http://www.xbrl.org/2003/role/presentationRef
-Publisher SEC
-Name Regulation S-K
-Section 106
-Subsection c
-Paragraph 2
-Subparagraph i
Reference 2: http://www.xbrl.org/2003/role/presentationRef
-Publisher SEC
-Name Form 20-F
-Section 16K
-Subsection c
-Paragraph 2
-Subparagraph i
| Name: |
cyd_CybersecurityRiskManagementPositionsOrCommitteesResponsibleTextBlock |
| Namespace Prefix: |
cyd_ |
| Data Type: |
dtr-types:textBlockItemType |
| Balance Type: |
na |
| Period Type: |
duration |
|
| X |
- ReferencesReference 1: http://www.xbrl.org/2003/role/presentationRef
-Publisher SEC
-Name Regulation S-K
-Section 106
-Subsection b
-Paragraph 1
Reference 2: http://www.xbrl.org/2003/role/presentationRef
-Publisher SEC
-Name Form 20-F
-Section 16K
-Subsection b
-Paragraph 1
| Name: |
cyd_CybersecurityRiskManagementProcessesForAssessingIdentifyingAndManagingThreatsTextBlock |
| Namespace Prefix: |
cyd_ |
| Data Type: |
dtr-types:textBlockItemType |
| Balance Type: |
na |
| Period Type: |
duration |
|
| X |
- ReferencesReference 1: http://www.xbrl.org/2003/role/presentationRef
-Publisher SEC
-Name Regulation S-K
-Section 106
-Subsection b
-Paragraph 1
-Subparagraph i
Reference 2: http://www.xbrl.org/2003/role/presentationRef
-Publisher SEC
-Name Form 20-F
-Section 16K
-Subsection b
-Paragraph 1
-Subparagraph i
| Name: |
cyd_CybersecurityRiskManagementProcessesIntegratedFlag |
| Namespace Prefix: |
cyd_ |
| Data Type: |
i:booleanItemType |
| Balance Type: |
na |
| Period Type: |
duration |
|
| X |
- ReferencesReference 1: http://www.xbrl.org/2003/role/presentationRef
-Publisher SEC
-Name Regulation S-K
-Section 106
-Subsection b
-Paragraph 1
-Subparagraph i
Reference 2: http://www.xbrl.org/2003/role/presentationRef
-Publisher SEC
-Name Form 20-F
-Section 16K
-Subsection b
-Paragraph 1
-Subparagraph i
| Name: |
cyd_CybersecurityRiskManagementProcessesIntegratedTextBlock |
| Namespace Prefix: |
cyd_ |
| Data Type: |
dtr-types:textBlockItemType |
| Balance Type: |
na |
| Period Type: |
duration |
|
| X |
- ReferencesReference 1: http://www.xbrl.org/2003/role/presentationRef
-Publisher SEC
-Name Regulation S-K
-Section 106
Reference 2: http://www.xbrl.org/2003/role/presentationRef
-Publisher SEC
-Name Form 20-F
-Section 16K
| Name: |
cyd_CybersecurityRiskManagementStrategyAndGovernanceAbstract |
| Namespace Prefix: |
cyd_ |
| Data Type: |
i:stringItemType |
| Balance Type: |
na |
| Period Type: |
duration |
|
| X |
- ReferencesReference 1: http://www.xbrl.org/2003/role/presentationRef
-Publisher SEC
-Name Regulation S-K
-Section 106
-Subsection b
-Paragraph 1
-Subparagraph ii
Reference 2: http://www.xbrl.org/2003/role/presentationRef
-Publisher SEC
-Name Form 20-F
-Section 16K
-Subsection b
-Paragraph 1
-Subparagraph ii
| Name: |
cyd_CybersecurityRiskManagementThirdPartyEngagedFlag |
| Namespace Prefix: |
cyd_ |
| Data Type: |
i:booleanItemType |
| Balance Type: |
na |
| Period Type: |
duration |
|
| X |
- ReferencesReference 1: http://www.xbrl.org/2003/role/presentationRef
-Publisher SEC
-Name Regulation S-K
-Section 106
-Subsection b
-Paragraph 2
Reference 2: http://www.xbrl.org/2003/role/presentationRef
-Publisher SEC
-Name Form 20-F
-Section 16K
-Subsection b
-Paragraph 2
| Name: |
cyd_CybersecurityRiskMateriallyAffectedOrReasonablyLikelyToMateriallyAffectRegistrantFlag |
| Namespace Prefix: |
cyd_ |
| Data Type: |
i:booleanItemType |
| Balance Type: |
na |
| Period Type: |
duration |
|
| X |
- ReferencesReference 1: http://www.xbrl.org/2003/role/presentationRef
-Publisher SEC
-Name Regulation S-K
-Section 106
-Subsection b
-Paragraph 2
Reference 2: http://www.xbrl.org/2003/role/presentationRef
-Publisher SEC
-Name Form 20-F
-Section 16K
-Subsection b
-Paragraph 2
| Name: |
cyd_CybersecurityRiskMateriallyAffectedOrReasonablyLikelyToMateriallyAffectRegistrantTextBlock |
| Namespace Prefix: |
cyd_ |
| Data Type: |
dtr-types:textBlockItemType |
| Balance Type: |
na |
| Period Type: |
duration |
|
| X |
- ReferencesReference 1: http://www.xbrl.org/2003/role/presentationRef
-Publisher SEC
-Name Regulation S-K
-Section 106
-Subsection c
-Paragraph 2
-Subparagraph ii
Reference 2: http://www.xbrl.org/2003/role/presentationRef
-Publisher SEC
-Name Form 20-F
-Section 16K
-Subsection c
-Paragraph 2
-Subparagraph ii
| Name: |
cyd_CybersecurityRiskProcessForInformingManagementOrCommitteesResponsibleTextBlock |
| Namespace Prefix: |
cyd_ |
| Data Type: |
dtr-types:textBlockItemType |
| Balance Type: |
na |
| Period Type: |
duration |
|
v3.25.0.1
NATURE OF COMPANY AND SUMMARY OF SIGNIFICANT ACCOUNTING POLICIES
|
12 Months Ended |
Dec. 31, 2024 |
|---|
| Organization, Consolidation and Presentation of Financial Statements [Abstract] |
|
| NATURE OF COMPANY AND SUMMARY OF SIGNIFICANT ACCOUNTING POLICIES |
NOTE
1—NATURE OF COMPANY AND SUMMARY OF SIGNIFICANT ACCOUNTING POLICIES
General
Houston
American Energy Corp. (a Delaware corporation) (“the Company” or “HUSA”) was incorporated in 2001. The Company
is engaged, as a non-operating joint owner, in the exploration, development, and production of natural gas, crude oil, and condensate
from properties. The Company’s principal properties are in the Texas Permian Basin and international holdings in Colombia, South
America, with additional holdings in Gulf Coast areas of the United States.
Consolidation
The
accompanying consolidated financial statements include all accounts of HUSA and its subsidiary (HAEC Louisiana E&P, Inc.). All significant inter-company balances and transactions have been eliminated
in consolidation.
Liquidity
and Capital Requirements
The
accompanying consolidated financial statements have been prepared assuming that the Company will continue as a going concern, which contemplates
the realization of assets and the satisfaction of liabilities in the normal course of business for the twelve-month period following
the issuance date of these consolidated financial statements. With limited exceptions, the Company has incurred continuing losses since
2011, with an accumulated deficit of $85.2 million as of December 31, 2024.
The
Company believes that it has the ability to fund, from cash on hand, its operating costs and anticipated drilling operations for at least
the next twelve months following the issuance of these financial statements.
The
actual timing and number of wells drilled during 2025 and beyond will be principally controlled by the operators of the Company’s
acreage, based on a number of factors, including but not limited to availability of financing, performance of existing wells on the subject
acreage, energy prices and industry condition and outlook, costs of drilling and completion services and equipment and other factors
beyond the Company’s control or that of its operators.
In
the event that the Company pursues additional acreage acquisitions or expands its drilling plans, the Company may be required to secure
additional funding beyond our resources on hand. While the Company may, among other efforts, seek additional funding from “at-the-market”
sales of common stock, and private sales of equity and debt securities, it presently has limited shares of common stock authorized for
issuance to support sales of such shares and does not have any commitments to provide additional funding, and there can be no assurance
that the Company can secure the necessary capital to fund its share of drilling, acquisition or other costs on acceptable terms or at
all. If, for any reason, the Company is unable to fund its share of drilling and completion costs, it would forego participation in one
or more of such wells. In such event, the Company may be subject to penalties or to the possible loss of some of its rights and interests
in prospects with respect to which it fails to satisfy funding obligations and it may be required to curtail operations and forego opportunities.
General
Principles and Use of Estimates
The
consolidated financial statements have been prepared in conformity with accounting principles generally accepted in the United States
of America. In preparing financial statements, management makes informed judgments and estimates that affect the reported amounts of
assets and liabilities as of the date of the financial statements and affect the reported amounts of revenues and expenses during the
reporting period. On an ongoing basis, management reviews its estimates, including those related to such potential matters as litigation,
environmental liabilities, income taxes, and determination of proved reserves of oil and gas and asset retirement obligations. Changes
in facts and circumstances may result in revised estimates and actual results may differ from these estimates.
Cash
and Cash Equivalents
Cash
and cash equivalents consist of demand deposits and cash investments with initial maturity dates of less than three months when purchased.
As of December 31, 2024 and 2023, the Company had no cash equivalents outstanding.
Concentration
of Credit Risk
Financial
instruments that potentially subject the Company to a concentration of credit risk include cash, cash equivalents and marketable securities
(if any). The Company had cash deposits of $2.5 million in excess of the FDIC’s current insured limit of $250,000 at December 31,
2024 for interest bearing accounts. The Company has not experienced any losses on its deposits of cash and cash equivalents.
Revenue
Recognition
The
Company’s revenue is comprised principally of revenue from exploration and production activities. The Company’s oil is sold
primarily to marketers, gatherers, and refiners. Natural gas is sold primarily to interstate and intrastate natural-gas pipelines, direct
end-users, industrial users, local distribution companies, and natural-gas marketers. Natural gas liquids, or NGLs, are sold primarily
to direct end-users, refiners, and marketers. Payment is generally received from the customer in the month following delivery.
Contracts
with customers have varying terms, including spot sales or month-to-month contracts, contracts with a finite term, and life-of-field
contracts where all production from a well or group of wells is sold to one or more customers. The Company recognizes sales revenues
for oil, natural gas, and NGLs based on the amount of each product sold to a customer when control transfers to the customer. Generally,
control transfers at the time of delivery to the customer at a pipeline interconnect, the tailgate of a processing facility, or as a
tanker lifting is completed. Revenue is measured based on the contract price, which may be index-based or fixed, and may include adjustments
for market differentials and downstream costs incurred by the customer, including gathering, transportation, and fuel costs.
Revenues
are recognized for the sale of the Company’s net share of production volumes.
The Company estimated the December 2024 revenue and related drilling expenses
for two US wells. Using actual oil production results for the month, the Company used historical lease operating expenses and average
price per BBL from prior months to calculate these estimates. No gas or NGL related revenue or expenses are included in the estimate.
Loss
per Share
Basic
loss per share is computed by dividing net loss available to common shareholders by the weighted average common shares outstanding for
the period. Diluted earnings per share reflects the potential dilution that could occur if securities or other contracts to issue common
shares were exercised or converted in common shares that then shared in the earnings of the Company. In periods in which the Company
reports a net loss, dilutive securities are excluded from the calculation of diluted net loss per share amounts as the effect would be
anti-dilutive.
For
the years ended December 31, 2024 and 2023, the following warrants and options to purchase shares of common stock were excluded from
the computation of diluted net loss per share, as the inclusion of such shares would be anti-dilutive:
SCHEDULE OF COMPUTATION OF DILUTED NET LOSS PER SHARE
| | |
Year Ended December 31, | |
| | |
2024 | | |
2023 | |
| Stock warrants | |
| 94,400 | | |
| 94,400 | |
| Stock options | |
| 916,987 | | |
| 1,000,807 | |
| Totals | |
| 1,011,387 | | |
| 1,095,207 | |
Accounts
Receivable
Accounts
receivable – other and escrow receivables have been evaluated for collectability and are recorded at their net realizable values.
Allowance
for Accounts Receivable
The
Company’s ability to collect outstanding receivables is critical to its operating performance and cashflows. Accounts receivable
are stated at an amount management expects to collect from outstanding balances. The Company extends credit in the normal course of business.
The Company regularly reviews outstanding receivables and when the Company determines that a party may not be able to make required payments,
a charge to bad debt expense in the period of determination is made. Though the Company’s bad debts have not historically been
significant, the Company could experience increased bad debt expense should a financial downturn occur. The Company updated its impairment model to utilize a forward-looking current expected credit losses (“CECL”)
model in place of the incurred loss methodology for financial instruments measured at amortized cost, primarily including its accounts
receivable and contract asset. In relation to available-for-sale (“AFS”) debt securities, the guidance eliminates the concept
of “other-than-temporary” impairment, and instead focuses on determining whether any impairment is a result of a credit loss
or other factors. The adoption of ASC 326 did not have a material impact on our unaudited condensed consolidated financial statements
as of the adoption date.
Oil
and Gas Properties
The
Company uses the full cost method of accounting for exploration and development activities as defined by the SEC. Under this method of
accounting, the costs for unsuccessful, as well as successful, exploration and development activities are capitalized as oil and gas
properties. Capitalized costs include lease acquisition, geological and geophysical work, delay rentals, costs of drilling, completing
and equipping the wells and any internal costs that are directly related to acquisition, exploration and development activities but does
not include any costs related to production, general corporate overhead or similar activities. Proceeds from the sale or other disposition
of oil and gas properties are generally treated as a reduction in the capitalized costs of oil and gas properties, unless the impact
of such a reduction would significantly alter the relationship between capitalized costs and proved reserves of oil and natural gas attributable
to a country.
The
Company categorizes its full cost pools as costs subject to amortization and costs not being amortized. The sum of net capitalized costs
subject to amortization, including estimated future development and abandonment costs, are amortized using the unit-of-production method.
Depletion and amortization for oil and gas properties was $160,001 and $167,526 for the years ended December 31, 2024 and 2023, respectively,
and accumulated amortization, depreciation and impairment was $61,743,025 and $61,217,260 at December 31, 2024 and 2023, respectively.
Costs
Excluded
Oil
and gas properties include costs that are excluded from capitalized costs being amortized. These amounts represent costs of investments
in unproved properties. The Company excludes these costs on a country-by-country basis until proved reserves are found or until it is
determined that the costs are impaired. All costs excluded are reviewed quarterly to determine if impairment has occurred. The amount
of any impairment is transferred to the costs subject to amortization.
Ceiling
Test
Under
the full cost method of accounting, a ceiling test is performed each quarter. The full cost ceiling test is an impairment test prescribed
by SEC Regulation S-X. The ceiling test determines a limit, on a country-by-country basis, on the book value of oil and gas properties.
The capitalized costs of proved oil and gas properties, net of accumulated depreciation, depletion, amortization and impairment (“DD&A”)
and the related deferred income taxes, may not exceed the estimated future net cash flows from proved oil and gas reserves, calculated
for 2024 and 2023 using the average oil and natural gas sales price received by the Company as of the first trading day of each month
over the preceding twelve months (such prices are held constant throughout the life of the properties) with consideration of price change
only to the extent provided by contractual arrangement, discounted at 10%, net of related tax effects. If capitalized costs exceed this
limit, the excess is charged to expense and reflected as additional accumulated DD&A. During 2024 and 2023, the Company recorded
impairments of oil and gas properties totaling $275,760 and $537,686, respectively. The impairment reflects the decline in energy prices
and production during 2024.
Furniture
and Equipment
Office
equipment is stated at original cost and is depreciated on the straight-line basis over the useful life of the assets, which ranges from
three to five years.
Office
equipment having an original cost basis of $90,004 was fully depreciated as of January 1, 2020. Therefore, accumulated depreciation was
$90,004 and $90,004 at December 31, 2024 and 2023, respectively.
Equity
Investment Accounted for at Cost
Businesses
not accounted for under either the consolidation method or equity method of accounting are accounted for under equity investments
accounted for at cost and are further discussed in Note 4, “Equity Investments Accounted for at Cost.” The
Company’s share of the earnings and/or losses of equity investments accounted for at cost is not included in the Consolidated
Statements of Operations. Income from equity investments accounted for at cost is only realized if and when distributions are made
from the business to its investors. However, impairment charges related to businesses are recognized in the company’s
Consolidated Statements of Operations. If circumstances suggest that the value of an equity investment accounted for at cost with
respect to which an impairment charge has been made has subsequently recovered, that recovery is not recorded. The carrying values
of the company’s equity investments accounted for at cost are reflected in the line item “Equity investment –
Hupecol Meta, LLC” in the Company’s Consolidated Balance Sheets. As of December
31, 2024, the Company determined it was necessary to take an impairment charge of $6,392,874
for its investment in Hupecol Meta due to indications that its earnings performance has deteriorated, and the investment is no
longer viewed as viable. The Company determined that it is unlikely to receive any substantial amount of proceeds upon the sale of Hupecol
Meta, rendering the value of the investment fully impaired.
Asset
Retirement Obligations
For
the Company, asset retirement obligations (“ARO”) represent the systematic, monthly accretion and depreciation of future
abandonment costs of tangible assets such as platforms, wells, service assets, pipelines, and other facilities. The fair value of a liability
for an asset’s retirement obligation is recorded in the period in which it is incurred if a reasonable estimate of fair value can
be made, and that the corresponding cost is capitalized as part of the carrying amount of the related long-lived asset. The liability
is accreted to its then present value each period, and the capitalized cost is depreciated over the useful life of the related asset.
If the liability is settled for an amount other than the recorded amount, an adjustment is made to the full cost pool, with no gain or
loss recognized, unless the adjustment would significantly alter the relationship between capitalized costs and proved reserves. Although
the Company’s domestic policy with respect to ARO is to assign depleted wells to a salvager for the assumption of abandonment obligations
before the wells have reached their economic limits, the Company has estimated its future ARO obligation with respect to its domestic
operations. The ARO assets, which are carried on the balance sheet as part of the full cost pool, have been included in our amortization
base for the purposes of calculating depreciation, depletion and amortization expense. For the purposes of calculating the ceiling test,
the future cash outflows associated with settling the ARO liability have been included in the computation of the discounted present value
of estimated future net revenues. Asset retirement obligations are classified as Level 3 (unobservable inputs) fair value measurements.
Income
Taxes
Deferred
income taxes are provided on a liability method whereby deferred tax assets and liabilities are established for the difference between
the financial reporting and income tax basis of assets and liabilities as well as operating loss and tax credit carry forwards. Deferred
tax assets are reduced by a valuation allowance when, in the opinion of management, it is more likely than not that some portion or all
of the deferred tax assets will not be realized. Deferred tax assets and liabilities are adjusted for the effects of changes in tax laws
and rates on the date of enactment.
Uncertain
Tax Positions
The
Company evaluates uncertain tax positions to recognize a tax benefit from an uncertain tax position only if it is more likely than not
that the tax position will be sustained on examination by the taxing authorities based on the technical merits of the position. Those
tax positions failing to qualify for initial recognition are recognized in the first interim period in which they meet the more likely
than not standard or are resolved through negotiation or litigation with the taxing authority, or upon expiration of the statute of limitations.
De-recognition of a tax position that was previously recognized occurs when an entity subsequently determines that a tax position no
longer meets the more likely than not threshold of being sustained.
The
Company is subject to ongoing tax exposures, examinations and assessments in various jurisdictions. Accordingly, the Company may incur
additional tax expense based upon the outcomes of such matters, including any interest or penalties. In addition, when applicable, the
Company will adjust tax expense to reflect the Company’s ongoing assessments of such matters, which require judgment and can materially
increase or decrease its effective rate as well as impact operating results. There were no liabilities recorded for uncertain tax positions
at December 31, 2024 and 2023.
Stock-Based
Compensation
The
Company measures the cost of employee services received in exchange for stock and stock options based on the grant date fair value of
the awards. The Company determines the fair value of stock option grants using the Black-Scholes option pricing model. The Company determines
the fair value of shares of non-vested stock based on the last quoted price of our stock on the date of the share grant. The fair value
determined represents the cost for the award and is recognized over the vesting period during which an employee is required to provide
service in exchange for the award. As stock-based compensation expense is recognized based on awards ultimately expected to vest, the
Company reduces the expense for estimated forfeitures based on historical forfeiture rates. Previously recognized compensation costs
may be adjusted to reflect the actual forfeiture rate for the entire award at the end of the vesting period. Excess tax benefits, if
any, are recognized as an addition to paid-in capital.
Concentration
of Risk
As
a non-operator oil and gas exploration and production company, and through its interest in a limited liability company (“Hupecol
Meta”) and concessions operated by Hupecol Meta in the South American country of Colombia, the Company is dependent on the personnel,
management and resources of the operators of its various properties to operate efficiently and effectively.
As
a non-operating joint interest owner, the Company has a right of investment refusal on specific projects and the right to examine and
contest its division of costs and revenues determined by the operator.
The
Company’s Permian Basin, Texas properties accounted for all of the Company’s oil and gas operations and substantially all
of its oil and gas investments reflected in its consolidated financial statements in 2024. In the event of a significant negative change
in operations or operating outlook pertaining to the Company’s Permian Basin properties, the Company may be forced to abandon or
suspend such operations, which abandonment or suspension could be materially harmful to the Company.
For
2024, the Company’s oil production from its mineral interests was sold to U.S. oil marketing companies based on the highest bid.
The gas production is sold to U.S. natural gas marketing companies based on the highest bid. No purchaser accounted for more than 10%
of our oil and gas sales.
The
Company reviews accounts receivable balances when circumstances indicate a balance may not be collectible. Based upon the Company’s
review, no allowance for uncollectible accounts was deemed necessary at December 31, 2024 and 2023, respectively.
Recently
Adopted Accounting Pronouncements
In
June 2016, the Financial Accounting Standards Board (“FASB”) issued ASU No. 2016-13, Financial Instruments – Credit
Losses (Topic 326): Measurement of Credit Losses of Financial Instruments, which was codified in Accounting Standards Codification (“ASC”)
326, Financial Instruments — Credit Losses (“ASC 326”). The standard changes the methodology for measuring credit losses
on financial instruments and the timing of when such losses are recorded. Because the Company is a smaller reporting company based on
the most recent determination as of November 15, 2019, ASC 326 became effective for the Company for fiscal years beginning after December
15, 2022. As such, the Company adopted ASC 326 effective January 1, 2023, utilizing the modified retrospective transition method. Upon
adoption, the Company updated its impairment model to utilize a forward-looking current expected credit losses (“CECL”) model
in place of the incurred loss methodology for financial instruments measured at amortized cost, primarily including its accounts receivable
and contract asset. In relation to available-for-sale (“AFS”) debt securities, the guidance eliminates the concept of “other-than-temporary”
impairment, and instead focuses on determining whether any impairment is a result of a credit loss or other factors.
In accordance with Accounting Standards Updates ASU 2016-13, Financial
Instruments-Credit Losses (Topic 326): Measurement of Credit Losses on Financial Instruments (“ASU 2016-13”),
the Company applies historic loss factors to its receivable portfolio segments that were not expected to be further impacted by current
economic developments, and additional economic conditions factor to portfolio segments anticipated to experience greater losses in the
current economic environment. Additionally, the Company continuously evaluates customers based on risk characteristics, such as historical
losses and current economic conditions. Due to the cyclical nature of the oil and gas industry, the Company often evaluates its customers’
estimated losses on a case-by-case basis. The Company did not record a provision for credit losses during the year ended December 31,
2024 or 2023. The adoption of
ASC 326 did not have a material impact on our unaudited condensed consolidated financial statements as of the adoption date.
In
November 2023, the FASB issued Accounting Standards Update (“ASU”) 2023-07 “Segment Reporting (Topic 280): Improvements
to Reportable Segment Disclosures”. The amendments in this ASU are intended to improve reportable segment disclosure requirements
primarily through enhanced disclosures about significant segment expenses. The Company adopted the update for year-end 2024,
but did not identify a material effect on its consolidated financial statements.
Recently
Issued Accounting Pronouncements
In
December 2023, the FASB issued ASU 2023-09, Income Taxes (Topic 740): Improvements to Income Tax Disclosures, which requires disaggregated
information about a reporting entity’s effective tax rate reconciliation, as well as information related to income taxes paid to
enhance the transparency and decision usefulness of income tax disclosures. This ASU will be effective for the annual period ending December
31, 2025. The Company is currently evaluating the timing and impacts of adoption of this ASU.
Subsequent
Events
The
Company evaluated subsequent events for disclosure from December 31, 2024 through the date the consolidated financial statements were
issued. See Note 12.
|
| X |
- References
+ Details
| Name: |
us-gaap_OrganizationConsolidationAndPresentationOfFinancialStatementsAbstract |
| Namespace Prefix: |
us-gaap_ |
| Data Type: |
xbrli:stringItemType |
| Balance Type: |
na |
| Period Type: |
duration |
|
| X |
- DefinitionThe entire disclosure for the organization, consolidation and basis of presentation of financial statements disclosure, and significant accounting policies of the reporting entity. May be provided in more than one note to the financial statements, as long as users are provided with an understanding of (1) the significant judgments and assumptions made by an enterprise in determining whether it must consolidate a VIE and/or disclose information about its involvement with a VIE, (2) the nature of restrictions on a consolidated VIE's assets reported by an enterprise in its statement of financial position, including the carrying amounts of such assets, (3) the nature of, and changes in, the risks associated with an enterprise's involvement with the VIE, and (4) how an enterprise's involvement with the VIE affects the enterprise's financial position, financial performance, and cash flows. Describes procedure if disclosures are provided in more than one note to the financial statements. Reference 1: http://fasb.org/us-gaap/role/ref/legacyRef
-Topic 235
-Name Accounting Standards Codification
-Publisher FASB
-URI https://asc.fasb.org/235/tableOfContent
Reference 2: http://fasb.org/us-gaap/role/ref/legacyRef
-Topic 275
-Name Accounting Standards Codification
-Publisher FASB
-URI https://asc.fasb.org/275/tableOfContent
Reference 3: http://fasb.org/us-gaap/role/ref/legacyRef
-Topic 810
-Name Accounting Standards Codification
-Publisher FASB
-URI https://asc.fasb.org/810/tableOfContent
Reference 4: http://fasb.org/us-gaap/role/ref/legacyRef
-Topic 205
-Name Accounting Standards Codification
-Publisher FASB
-URI https://asc.fasb.org/205/tableOfContent
| Name: |
us-gaap_OrganizationConsolidationAndPresentationOfFinancialStatementsDisclosureAndSignificantAccountingPoliciesTextBlock |
| Namespace Prefix: |
us-gaap_ |
| Data Type: |
dtr-types:textBlockItemType |
| Balance Type: |
na |
| Period Type: |
duration |
|
v3.25.0.1
REVENUE FROM CONTRACTS WITH CUSTOMERS
|
12 Months Ended |
Dec. 31, 2024 |
|---|
| Revenue from Contract with Customer [Abstract] |
|
| REVENUE FROM CONTRACTS WITH CUSTOMERS |
NOTE
2—REVENUE FROM CONTRACTS WITH CUSTOMERS
Disaggregation
of Revenue from Contracts with Customers
The
following table disaggregates revenue by significant product type for the years ended December 31, 2024 and 2023:
SCHEDULE OF DISAGGREGATES REVENUE BY SIGNIFICANT PRODUCT
| | |
2024 | | |
2023 | |
| | |
Year Ended December 31, | |
| | |
2024 | | |
2023 | |
| Oil sales | |
$ | 437,900 | | |
$ | 590,486 | |
| Natural gas sales | |
| 8,869 | | |
| 79,443 | |
| Natural gas liquids sales | |
| 113,411 | | |
| 124,098 | |
| Total revenue from customers | |
$ | 560,180 | | |
$ | 794,027 | |
There
were no significant contract liabilities or transaction price allocations to any remaining performance obligations as of December 31,
2024 or 2023.
|
| X |
- References
+ Details
| Name: |
us-gaap_RevenueFromContractWithCustomerAbstract |
| Namespace Prefix: |
us-gaap_ |
| Data Type: |
xbrli:stringItemType |
| Balance Type: |
na |
| Period Type: |
duration |
|
| X |
- DefinitionThe entire disclosure of revenue from contract with customer to transfer good or service and to transfer nonfinancial asset. Includes, but is not limited to, disaggregation of revenue, credit loss recognized from contract with customer, judgment and change in judgment related to contract with customer, and asset recognized from cost incurred to obtain or fulfill contract with customer. Excludes insurance and lease contracts. Reference 1: http://www.xbrl.org/2003/role/disclosureRef
-Topic 606
-SubTopic 10
-Name Accounting Standards Codification
-Section 50
-Paragraph 9
-Publisher FASB
-URI https://asc.fasb.org/1943274/2147479806/606-10-50-9
Reference 2: http://www.xbrl.org/2003/role/disclosureRef
-Topic 606
-SubTopic 10
-Name Accounting Standards Codification
-Section 50
-Paragraph 10
-Publisher FASB
-URI https://asc.fasb.org/1943274/2147479806/606-10-50-10
Reference 3: http://www.xbrl.org/2003/role/disclosureRef
-Topic 606
-SubTopic 10
-Name Accounting Standards Codification
-Section 50
-Paragraph 15
-Publisher FASB
-URI https://asc.fasb.org/1943274/2147479806/606-10-50-15
Reference 4: http://www.xbrl.org/2003/role/disclosureRef
-Topic 606
-SubTopic 10
-Name Accounting Standards Codification
-Section 50
-Paragraph 12
-Subparagraph (a)
-Publisher FASB
-URI https://asc.fasb.org/1943274/2147479806/606-10-50-12
Reference 5: http://www.xbrl.org/2003/role/disclosureRef
-Topic 606
-SubTopic 10
-Name Accounting Standards Codification
-Section 50
-Paragraph 12
-Subparagraph (b)
-Publisher FASB
-URI https://asc.fasb.org/1943274/2147479806/606-10-50-12
Reference 6: http://www.xbrl.org/2003/role/disclosureRef
-Topic 606
-SubTopic 10
-Name Accounting Standards Codification
-Section 50
-Paragraph 12
-Subparagraph (c)
-Publisher FASB
-URI https://asc.fasb.org/1943274/2147479806/606-10-50-12
Reference 7: http://www.xbrl.org/2003/role/disclosureRef
-Topic 606
-SubTopic 10
-Name Accounting Standards Codification
-Section 50
-Paragraph 12
-Subparagraph (d)
-Publisher FASB
-URI https://asc.fasb.org/1943274/2147479806/606-10-50-12
Reference 8: http://www.xbrl.org/2003/role/disclosureRef
-Topic 606
-SubTopic 10
-Name Accounting Standards Codification
-Section 50
-Paragraph 12
-Subparagraph (e)
-Publisher FASB
-URI https://asc.fasb.org/1943274/2147479806/606-10-50-12
Reference 9: http://www.xbrl.org/2003/role/disclosureRef
-Topic 606
-SubTopic 10
-Name Accounting Standards Codification
-Section 50
-Paragraph 13
-Subparagraph (b)(2)
-Publisher FASB
-URI https://asc.fasb.org/1943274/2147479806/606-10-50-13
Reference 10: http://www.xbrl.org/2003/role/disclosureRef
-Name Accounting Standards Codification
-Topic 606
-Publisher FASB
-URI https://asc.fasb.org/606/tableOfContent
| Name: |
us-gaap_RevenueFromContractWithCustomerTextBlock |
| Namespace Prefix: |
us-gaap_ |
| Data Type: |
dtr-types:textBlockItemType |
| Balance Type: |
na |
| Period Type: |
duration |
|
v3.25.0.1
OIL AND GAS PROPERTIES
|
12 Months Ended |
Dec. 31, 2024 |
|---|
| Extractive Industries [Abstract] |
|
| OIL AND GAS PROPERTIES |
NOTE
3—OIL AND GAS PROPERTIES
Evaluated
Oil and Gas Properties
Evaluated
oil and gas properties subject to amortization at December 31, 2024 included the following:
SCHEDULE OF EVALUATED OIL AND GAS PROPERTIES SUBJECT TO AMORTIZATION
| | |
United States | | |
South America | | |
Total | |
| | |
| | |
| | |
| |
| Evaluated properties being amortized | |
$ | 13,326,003 | | |
$ | 49,444,654 | | |
$ | 62,770,657 | |
| Accumulated depreciation, depletion, amortization and impairment | |
| (12,208,367 | ) | |
| (49,444,654 | ) | |
| (61,653,021 | ) |
| Net capitalized costs | |
$ | 1,117,636 | | |
$ | — | | |
$ | 1,117,636 | |
Evaluated
oil and gas properties subject to amortization at December 31, 2023 included the following:
| | |
United States | | |
South America | | |
Total | |
| | |
| | |
| | |
| |
| Evaluated properties being amortized | |
$ | 13,321,907 | | |
$ | 49,444,654 | | |
$ | 62,766,561 | |
| Accumulated depreciation, depletion, amortization and impairment | |
| (11,762,288 | ) | |
| (49,444,654 | ) | |
| (61,206,942 | ) |
| Net capitalized costs | |
$ | 1,559,619 | | |
$ | — | | |
$ | 1,559,619 | |
Impairments
During
2024, the Company realized a full cost ceiling test impairment of $275,760.
The impairment of the US assets was attributable to declines in energy prices and production relating to the Company’s Reeves County
properties, partially offset by the addition of the Company’s proved non-producing properties.
|
| X |
- DefinitionThe entire disclosure for properties used in normal conduct of oil and gas exploration and producing operations. This disclosure may include property accounting policies and methodology, a schedule of property, plant and equipment gross, additions, deletions, transfers and other changes, depreciation, depletion and amortization expense, net, accumulated depreciation, depletion and amortization expense and useful lives. Reference 1: http://www.xbrl.org/2003/role/disclosureRef
-Topic 932
-SubTopic 360
-Name Accounting Standards Codification
-Publisher FASB
-URI https://asc.fasb.org/932-360/tableOfContent
| Name: |
us-gaap_OilAndGasPropertiesTextBlock |
| Namespace Prefix: |
us-gaap_ |
| Data Type: |
dtr-types:textBlockItemType |
| Balance Type: |
na |
| Period Type: |
duration |
|
v3.25.0.1
Equity Investment Accounted for at Cost
|
12 Months Ended |
Dec. 31, 2024 |
|---|
| Equity Investment Accounted For At Cost |
|
| Equity Investment Accounted for at Cost |
NOTE
4—Equity Investment Accounted for at Cost
During
the year ended December 31, 2024, the Company received distributions, totaling $922,719,
from Hupecol Meta representing the Company’s share of distributable net profits. During 2024, the Company invested $1.9
million for required capital contributions related to drilling operations in Colombia to Hupecol Meta.
The
Company’s carrying value of its holdings in Hupecol Meta, was $4.5 million as of December 31, 2023, as reflected in the line item
“Equity investment – Hupecol Meta” in the Company’s consolidated balance sheets.
Impairments
The
Company performs annual business reviews of its equity investments accounted for at cost to determine whether the carrying value in
that investment is impaired. As of December 31, 2024, the Company determined it was necessary
to take an impairment charge of $6,392,874 for its
investment in Hupecol Meta due to indications that its earnings performance has deteriorated, and the investment is no longer viewed
as viable. The Company determined that it is unlikely to receive any substantial amount of proceeds upon the sale of Hupecol Meta, rendering
the value of the investment fully impaired.
|
| X |
- References
+ Details
| Name: |
HUSA_DisclosureEquityInvestmentAccountedForAtCostAbstract |
| Namespace Prefix: |
HUSA_ |
| Data Type: |
xbrli:stringItemType |
| Balance Type: |
na |
| Period Type: |
duration |
|
| X |
- DefinitionEquity Investments Disclosure [Text Block]
| Name: |
HUSA_EquityInvestmentsDisclosureTextBlock |
| Namespace Prefix: |
HUSA_ |
| Data Type: |
dtr-types:textBlockItemType |
| Balance Type: |
na |
| Period Type: |
duration |
|
v3.25.0.1
ASSET RETIREMENT OBLIGATIONS
|
12 Months Ended |
Dec. 31, 2024 |
|---|
| Asset Retirement Obligation Disclosure [Abstract] |
|
| ASSET RETIREMENT OBLIGATIONS |
NOTE
5—ASSET RETIREMENT OBLIGATIONS
The
following table presents changes in our asset retirement liability (“ARO”) during each of the years ended December 31, 2024
and 2023.
SCHEDULE OF CHANGES IN OUR ASSET RETIREMENT LIABILITY
| | |
2024 | | |
2023 | |
| | |
| | |
| |
| ARO liability at January 1 | |
$ | 63,084 | | |
$ | 72,789 | |
| Additions from new drilling | |
| — | | |
| — | |
| Liabilities settled | |
| — | | |
| (2,706 | ) |
| Changes in estimates | |
| (5,904 | ) | |
| (9,706 | ) |
| Accretion expense | |
| — | | |
| 2,707 | |
| | |
| | | |
| | |
| ARO liability at December 31 | |
$ | 57,180 | | |
$ | 63,084 | |
|
| X |
- References
+ Details
| Name: |
us-gaap_AssetRetirementObligationDisclosureAbstract |
| Namespace Prefix: |
us-gaap_ |
| Data Type: |
xbrli:stringItemType |
| Balance Type: |
na |
| Period Type: |
duration |
|
| X |
- DefinitionThe entire disclosure for an asset retirement obligation and the associated long-lived asset. An asset retirement obligation is a legal obligation associated with the disposal or retirement from service of a tangible long-lived asset that results from the acquisition, construction or development, or the normal operations of a long-lived asset, except for certain obligations of lessees. Reference 1: http://www.xbrl.org/2003/role/disclosureRef
-Topic 410
-SubTopic 20
-Name Accounting Standards Codification
-Section 50
-Paragraph 1
-Subparagraph (a)
-Publisher FASB
-URI https://asc.fasb.org/1943274/2147481850/410-20-50-1
Reference 2: http://www.xbrl.org/2003/role/disclosureRef
-Topic 410
-SubTopic 20
-Name Accounting Standards Codification
-Publisher FASB
-URI https://asc.fasb.org/410-20/tableOfContent
Reference 3: http://www.xbrl.org/2003/role/disclosureRef
-Name Accounting Standards Codification
-Section 50
-Paragraph 2
-SubTopic 20
-Topic 410
-Publisher FASB
-URI https://asc.fasb.org/1943274/2147481850/410-20-50-2
| Name: |
us-gaap_AssetRetirementObligationDisclosureTextBlock |
| Namespace Prefix: |
us-gaap_ |
| Data Type: |
dtr-types:textBlockItemType |
| Balance Type: |
na |
| Period Type: |
duration |
|
v3.25.0.1
STOCK-BASED COMPENSATION
|
12 Months Ended |
Dec. 31, 2024 |
|---|
| Share-Based Payment Arrangement [Abstract] |
|
| STOCK-BASED COMPENSATION |
NOTE
6—STOCK-BASED COMPENSATION
In
2008, the Company adopted the Houston American Energy Corp. 2008 Equity Incentive Plan (the “2008 Plan”). The terms of the
2008 Plan, as amended in 2012 and 2013, allow for the issuance of up to 480,000 shares of the Company’s common stock pursuant to
the grant of stock options and restricted stock.
In
2017, the Company adopted the Houston American Energy Corp. 2017 Equity Incentive Plan (the “2017 Plan”). The terms of the
2017 Plan allow for the issuance of up to 400,000 shares of the Company’s common stock pursuant to the grant of stock options and
restricted stock. Persons eligible to participate in the Plans are key employees, consultants and directors of the Company.
In
2021, the Company adopted the Houston American Energy 2021 Equity Incentive Plan (the “2021 Plan” and, together with the
2008 Plan and the 2017 Plan, the “Plans”). The terms of the 2021 Plan allow for the issuance of up to 500,000 shares of the
Company’s common stock pursuant to the grant of stock options and restricted stock. Persons eligible to participate in the Plans
are key employees, consultants and directors of the Company.
Stock
Option Activity
In
June 2023, options to purchase an aggregate of 60,000 shares of the Company’s common stock were granted to the Company’s
directors. The options have a ten-year life and are exercisable at $2.09 per share, vest 20% on the date of grant and 80% ten months
from the date of grant. The grant date fair value of these stock options was $119,252 based on the Black-Scholes Option Pricing model
based on the following assumptions: market value of common stock on grant date – $2.09; risk free interest rate based on the applicable
US Treasury bill rate – 0%; dividend yield – 0%; volatility factor based on the trading history of the Company – 116%;
weighted average expected life in years – 10; and expected forfeiture rate – 0%.
In
June 2024, options to purchase an aggregate of 60,000 shares of the Company’s common stock were granted to the Company’s
directors. The options have a ten-year life and are exercisable at $1.21 per share, vest 20% on the date of grant and 80% ten months
from the date of grant. The grant date fair value of these stock options was $63,730 based on the Black-Scholes Option Pricing model
based on the following assumptions: market value of common stock on grant date – $1.21; risk free interest rate based on the applicable
US Treasury bill rate – 0%; dividend yield – 0%; volatility factor based on the trading history of the Company – 97.8%;
weighted average expected life in years – 10; and expected forfeiture rate – 0%.
In
November 2024, the Company agreed to issue to its CEO a number of options equal to $15,000
divided by the closing price of our stock on the 15th day of each month. The strike price of each option is equal to the
grant price. The options have a ten-year
life and are exercisable at $0.76
per share for the November 2024 issuances and $0.73
per share for the December 2024 issuances, vest
20% on the date of grant and 80% ten months from the date of grant. The grant date fair value of these stock options was
$14,657
in November 2024, and $13,225
in December 2024, based on the Black-Scholes Option Pricing model based on the following assumptions: market value of common stock
on grant dates – $1.43
and $1.36,
respectively; risk free interest rate based on the applicable US Treasury bill rate – 0%;
dividend yield – 0%;
volatility factor based on the trading history of the Company – 92%;
weighted average expected life in years – 10;
and expected forfeiture rate – 0%.
Option
activity during 2024 and 2023 was as follows:
SUMMARY OF STOCK OPTION ACTIVITY
| | |
Options | | |
Weighted Average Exercise Price | | |
Weighted Average Remaining Contractual
Term (in Years) | | |
Aggregate Intrinsic Value | |
| | |
| | |
| | |
| | |
| |
| Outstanding at December 31, 2022 | |
| 944,177 | | |
$ | 2.08 | | |
| | | |
| | |
| Granted | |
| 60,000 | | |
$ | 2.09 | | |
| | | |
| | |
| Exercised | |
| — | | |
$ | 3.84 | | |
| | | |
| | |
| Forfeited | |
| (3,370 | ) | |
$ | 20.43 | | |
| | | |
| | |
| | |
| | | |
| | | |
| | | |
| | |
| Outstanding at December 31, 2023 | |
| 1,000,807 | | |
| 2.46 | | |
| | | |
| | |
| Granted | |
| 82,320 | | |
| 1.08 | | |
| | | |
| | |
| Exercised | |
| — | | |
| | | |
| | | |
| | |
| Expired | |
| (166,140 | ) | |
| 3.87 | | |
| | | |
| | |
| | |
| | | |
| | | |
| | | |
| | |
| Outstanding at December 31, 2024 | |
| 916,987 | | |
$ | 2.06 | | |
| 6.10 | | |
$ | 16,956 | |
| Exercisable at December 31, 2024 | |
| 851,131 | | |
$ | 2.13 | | |
| 5.86 | | |
$ | 16,956 | |
As
of December 31, 2024, non-vested options granted totaled 65,856 and total unrecognized stock-based compensation expense related to non-vested
stock options was $40,790. The related unrecognized expense is expected to be recognized over a weighted average period of 0.24 years.
The weighted average remaining contractual term of the outstanding options and exercisable options at December 31, 2024 is 6.10 years
and 5.86 years, respectively.
As
of December 31, 2024, there were 87,680 shares of common stock available for issuance pursuant to future stock or option grants under
the Plans.
Stock-Based
Compensation Expense
The
following table reflects stock-based compensation recorded by the Company for 2024 and 2023:
SCHEDULE OF STOCK-BASED COMPENSATION
| | |
2024 | | |
2023 | |
| | |
| | |
| |
| Stock-based compensation expense from stock options and common stock included in general and administrative expense | |
$ | 101,508 | | |
$ | 238,314 | |
| Earnings per share effect of stock-based compensation expense | |
$ | (0.01 | ) | |
$ | (0.02 | ) |
|
| X |
- DefinitionThe entire disclosure for share-based payment arrangement. Reference 1: http://www.xbrl.org/2003/role/exampleRef
-Topic 718
-SubTopic 10
-Name Accounting Standards Codification
-Section 50
-Paragraph 2
-Subparagraph (a)(1)
-Publisher FASB
-URI https://asc.fasb.org/1943274/2147480429/718-10-50-2
Reference 2: http://www.xbrl.org/2003/role/disclosureRef
-Topic 718
-Name Accounting Standards Codification
-Publisher FASB
-URI https://asc.fasb.org/718/tableOfContent
Reference 3: http://www.xbrl.org/2003/role/disclosureRef
-Topic 718
-SubTopic 10
-Name Accounting Standards Codification
-Section 50
-Paragraph 2
-Subparagraph (a)
-Publisher FASB
-URI https://asc.fasb.org/1943274/2147480429/718-10-50-2
Reference 4: http://www.xbrl.org/2003/role/disclosureRef
-Topic 718
-SubTopic 10
-Name Accounting Standards Codification
-Section 50
-Paragraph 2
-Subparagraph (h)(2)
-Publisher FASB
-URI https://asc.fasb.org/1943274/2147480429/718-10-50-2
Reference 5: http://www.xbrl.org/2003/role/disclosureRef
-Topic 718
-SubTopic 10
-Name Accounting Standards Codification
-Section 50
-Paragraph 2
-Subparagraph (h)(2)(i)
-Publisher FASB
-URI https://asc.fasb.org/1943274/2147480429/718-10-50-2
Reference 6: http://www.xbrl.org/2003/role/disclosureRef
-Topic 718
-SubTopic 10
-Name Accounting Standards Codification
-Section 50
-Paragraph 2
-Subparagraph (l)
-Publisher FASB
-URI https://asc.fasb.org/1943274/2147480429/718-10-50-2
| Name: |
us-gaap_DisclosureOfCompensationRelatedCostsShareBasedPaymentsTextBlock |
| Namespace Prefix: |
us-gaap_ |
| Data Type: |
dtr-types:textBlockItemType |
| Balance Type: |
na |
| Period Type: |
duration |
|
v3.25.0.1
CAPITAL STOCK
|
12 Months Ended |
Dec. 31, 2024 |
|---|
| Equity [Abstract] |
|
| CAPITAL STOCK |
NOTE
7—CAPITAL STOCK
Common
Stock - At-the-Market Offerings
In
November 2022, the Company entered into an At-the-Market Sales Agreement (the “Sales Agreement”) with Univest Securities,
LLC) (“Univest”) pursuant to which the Company could sell (the “2022 ATM Offering”), at its option, up to an
aggregate of $3.5 million in shares of its common stock through Univest, as sales agent.
During
2023, we sold an aggregate of 578,707 shares in connection with the 2022 ATM Offering and received proceeds, net of commissions and expenses,
of $1.7 million.
In
2024, we sold 2,180,180 shares of our common stock in a private placement for net proceeds of $2.3 million.
Warrants
Bridge
Loan Warrants. In September 2019, the Company issued the warrants in conjunction with a bridge loan. The Bridge Loan Warrants
are exercisable, for a period of ten years, expiring September 18, 2029, to purchase an aggregate of 94,400 shares of common stock of
the Company at $2.50 per share. The relative fair value of the warrants was determined on the date of grant at $144,948 using the Black
Scholes option-pricing model with the following parameters: (1) risk free interest rate of 1.80% based on the applicable US Treasury
bill rate; (2) expected life in years of 10.0; (3) expected stock volatility of 82.9% based on the trading history of the Company; and
(4) expected dividend yield of 0%. The relative fair value of the warrants was recorded as debt discount on the Bridge Loan Notes and
was amortized as additional interest expense over the term of the notes.
A
summary of warrant activity and related information for 2024 and 2023 is presented below:
SUMMARY OF WARRANT ACTIVITY
| | |
Warrants | | |
Weighted-Average
Exercise Price | | |
Aggregate
Intrinsic Value | |
| | |
| | |
| | |
| |
| Outstanding at December 31, 2022 | |
| 94,400 | | |
$ | 2.50 | | |
| | |
| Issued | |
| — | | |
| — | | |
| | |
| Exercised | |
| — | | |
| — | | |
| | |
| Expired | |
| — | | |
$ | — | | |
| | |
| Outstanding at December 31, 2023 | |
| 94,400 | | |
$ | 2.50 | | |
| | |
| Issued | |
| — | | |
| — | | |
| | |
| Exercised | |
| — | | |
| — | | |
| | |
| Expired | |
| — | | |
| — | | |
| | |
| Outstanding at December 31, 2024 | |
| 94,400 | | |
$ | 2.50 | | |
$ | — | |
| Exercisable at December 31, 2024 | |
| 94,400 | | |
$ | 2.50 | | |
$ | — | |
|
| X |
- References
+ Details
| Name: |
us-gaap_EquityAbstract |
| Namespace Prefix: |
us-gaap_ |
| Data Type: |
xbrli:stringItemType |
| Balance Type: |
na |
| Period Type: |
duration |
|
| X |
- DefinitionThe entire disclosure for equity. Reference 1: http://www.xbrl.org/2003/role/disclosureRef
-Topic 505
-SubTopic 10
-Name Accounting Standards Codification
-Section 50
-Paragraph 13
-Subparagraph (b)
-Publisher FASB
-URI https://asc.fasb.org/1943274/2147481112/505-10-50-13
Reference 2: http://www.xbrl.org/2003/role/disclosureRef
-Topic 505
-SubTopic 10
-Name Accounting Standards Codification
-Section 50
-Paragraph 13
-Subparagraph (h)
-Publisher FASB
-URI https://asc.fasb.org/1943274/2147481112/505-10-50-13
Reference 3: http://www.xbrl.org/2003/role/disclosureRef
-Topic 505
-SubTopic 10
-Name Accounting Standards Codification
-Section 50
-Paragraph 14
-Subparagraph (b)
-Publisher FASB
-URI https://asc.fasb.org/1943274/2147481112/505-10-50-14
Reference 4: http://www.xbrl.org/2003/role/disclosureRef
-Topic 946
-SubTopic 235
-Name Accounting Standards Codification
-Section 50
-Paragraph 2
-Subparagraph (a)
-Publisher FASB
-URI https://asc.fasb.org/1943274/2147477968/946-235-50-2
Reference 5: http://www.xbrl.org/2003/role/disclosureRef
-Topic 946
-SubTopic 235
-Name Accounting Standards Codification
-Section 50
-Paragraph 2
-Subparagraph (d)
-Publisher FASB
-URI https://asc.fasb.org/1943274/2147477968/946-235-50-2
Reference 6: http://www.xbrl.org/2003/role/disclosureRef
-Topic 946
-SubTopic 505
-Name Accounting Standards Codification
-Section 50
-Paragraph 6
-Publisher FASB
-URI https://asc.fasb.org/1943274/2147478448/946-505-50-6
Reference 7: http://www.xbrl.org/2003/role/disclosureRef
-Topic 815
-SubTopic 40
-Name Accounting Standards Codification
-Section 50
-Paragraph 6
-Subparagraph (a)
-Publisher FASB
-URI https://asc.fasb.org/1943274/2147480237/815-40-50-6
Reference 8: http://www.xbrl.org/2003/role/disclosureRef
-Topic 505
-SubTopic 10
-Name Accounting Standards Codification
-Section S99
-Paragraph 1
-Subparagraph (SX 210.3-04)
-Publisher FASB
-URI https://asc.fasb.org/1943274/2147480008/505-10-S99-1
Reference 9: http://www.xbrl.org/2003/role/disclosureRef
-Topic 235
-SubTopic 10
-Name Accounting Standards Codification
-Section S99
-Paragraph 1
-Subparagraph (SX 210.4-08(e)(1))
-Publisher FASB
-URI https://asc.fasb.org/1943274/2147480678/235-10-S99-1
Reference 10: http://fasb.org/us-gaap/role/ref/legacyRef
-Topic 505
-Name Accounting Standards Codification
-Publisher FASB
-URI https://asc.fasb.org/505/tableOfContent
Reference 11: http://www.xbrl.org/2003/role/disclosureRef
-Topic 505
-SubTopic 10
-Name Accounting Standards Codification
-Section 50
-Paragraph 13
-Publisher FASB
-URI https://asc.fasb.org/1943274/2147481112/505-10-50-13
Reference 12: http://www.xbrl.org/2003/role/disclosureRef
-Topic 505
-SubTopic 10
-Name Accounting Standards Codification
-Section 50
-Paragraph 13
-Subparagraph (g)
-Publisher FASB
-URI https://asc.fasb.org/1943274/2147481112/505-10-50-13
Reference 13: http://www.xbrl.org/2003/role/disclosureRef
-Topic 505
-SubTopic 10
-Name Accounting Standards Codification
-Section 50
-Paragraph 13
-Subparagraph (i)
-Publisher FASB
-URI https://asc.fasb.org/1943274/2147481112/505-10-50-13
Reference 14: http://www.xbrl.org/2003/role/disclosureRef
-Topic 505
-SubTopic 10
-Name Accounting Standards Codification
-Section 50
-Paragraph 14
-Subparagraph (a)
-Publisher FASB
-URI https://asc.fasb.org/1943274/2147481112/505-10-50-14
Reference 15: http://www.xbrl.org/2003/role/disclosureRef
-Topic 505
-SubTopic 10
-Name Accounting Standards Codification
-Section 50
-Paragraph 14
-Subparagraph (c)
-Publisher FASB
-URI https://asc.fasb.org/1943274/2147481112/505-10-50-14
Reference 16: http://www.xbrl.org/2003/role/disclosureRef
-Topic 505
-SubTopic 10
-Name Accounting Standards Codification
-Section 50
-Paragraph 16
-Subparagraph (b)
-Publisher FASB
-URI https://asc.fasb.org/1943274/2147481112/505-10-50-16
Reference 17: http://www.xbrl.org/2003/role/disclosureRef
-Topic 505
-SubTopic 10
-Name Accounting Standards Codification
-Section 50
-Paragraph 18
-Subparagraph (a)
-Publisher FASB
-URI https://asc.fasb.org/1943274/2147481112/505-10-50-18
Reference 18: http://www.xbrl.org/2003/role/disclosureRef
-Topic 505
-SubTopic 10
-Name Accounting Standards Codification
-Section 50
-Paragraph 18
-Subparagraph (b)
-Publisher FASB
-URI https://asc.fasb.org/1943274/2147481112/505-10-50-18
Reference 19: http://www.xbrl.org/2003/role/disclosureRef
-Topic 505
-SubTopic 10
-Name Accounting Standards Codification
-Section 50
-Paragraph 18
-Subparagraph (d)
-Publisher FASB
-URI https://asc.fasb.org/1943274/2147481112/505-10-50-18
| Name: |
us-gaap_StockholdersEquityNoteDisclosureTextBlock |
| Namespace Prefix: |
us-gaap_ |
| Data Type: |
dtr-types:textBlockItemType |
| Balance Type: |
na |
| Period Type: |
duration |
|
v3.25.0.1
TAXES
|
12 Months Ended |
Dec. 31, 2024 |
|---|
| Income Tax Disclosure [Abstract] |
|
| TAXES |
NOTE
8—TAXES
The
following table sets forth a reconciliation of the statutory federal income tax for the years ended December 31, 2024 and 2023.
SCHEDULE
OF RECONCILIATION OF STATUTORY FEDERAL INCOME TAX
| | |
2024 | | |
2023 | |
| | |
| | |
| |
| | |
| | | |
| | |
| Income tax expense (benefit) computed at statutory rates | |
$ | (1,725,727 | ) | |
$ | (674,368 | ) |
| Permanent differences, nondeductible expenses | |
| 28 | | |
| 9 | |
| Increase (decrease) in valuation allowance | |
| 1,807,535 | | |
| 710,336 | ) |
| Expiration of options | |
| 32,060 | | |
| — | |
| RTA True-Ups | |
| (227,729 | ) | |
| (10,919 | ) |
| Deferred True-Up | |
| 113,833 | | |
| (25,088 | ) |
| Tax provision | |
$ | — | | |
$ | — | |
| | |
| | | |
| | |
| Total provision | |
| | | |
| | |
| Foreign | |
$ | — | | |
$ | — | |
| Total provision (benefit) | |
$ | — | | |
$ | — | |
At
December 31, 2024 the Company has a federal tax loss carry forward of $12,741,145 and a foreign tax credit carry forward of $18,865,
both of which have been fully reserved. The foreign tax credit will expire in 2025.
The
tax effects of the temporary differences between financial statement income and taxable income are recognized as a deferred tax asset
and liabilities. Significant components of the deferred tax asset and liability as of December 31, 2024 and 2023 are set out below.
SIGNIFICANT
COMPONENTS OF DEFERRED TAX ASSET AND LIABILITY
| | |
2024 | | |
2023 | |
| Non-Current Deferred tax assets: | |
| | | |
| | |
| Net operating loss carry forward | |
| 12,729,620 | | |
$ | 12,355,137 | |
| Foreign tax credit carry forward | |
| 18,865 | | |
| 18,865 | |
| Deferred state tax | |
| — | | |
| — | |
| Stock compensation | |
| 460,368 | | |
| 470,816 | |
| Book in excess of tax depreciation, depletion and capitalization methods on oil and gas properties | |
| 1,497,253 | | |
| 53,720 | |
| Other | |
| — | | |
| — | |
| ASC 842 lease standard – building lease | |
| 248 | | |
| 281 | |
| Pass-through investment | |
| — | | |
| — | |
| Total Non-Current Deferred tax assets | |
| 14,706,354 | | |
| 12,898,819 | |
| Valuation Allowance | |
| (14,706,354 | ) | |
| (12,898,819 | ) |
| Net deferred tax asset | |
| — | | |
$ | — | |
Schedule
of Net Operating Loss Carryforwards
The
Company is currently subject to a three-year statute of limitation for federal tax purposes and, in general, three to four-year
statute of limitation for state tax purposes. State NOL expiration will occur beginning in 2033 and Federal NOL expiration will
begin in 2032. The Company files income tax returns in the U.S. federal jurisdiction, and Texas and Oklahoma state jurisdictions. The Company is currently
subject to a three-year statute of limitation for federal tax purposes and, in general, three to four year statute of limitation for state
tax purposes. The federal tax years open to examination are tax years 2021, 2022, and 2023. The state tax years open to examination are
tax years 2020, 2021, 2022, and 2023.
Under
the Tax Cuts and Jobs Act of 2017, net operating losses incurred for tax years beginning after December 31, 2017 will have no expiration
date but utilization will be limited to 80% of taxable income. For losses generated prior to January 1, 2018, there will be no limitation
on the utilization, but there is an expiration on the carryforward of 20 years for federal tax purposes.
The
provisions were subsequently amended further under the Coronavirus Aid, Relief, and Economic Security Act (“CARES Act”) on
March 27, 2020. The CARES Act amended the net operating loss provisions in the 2017 Tax Cuts and Jobs Act (“TCJA”) and allows
for the carryback of NOL’s arising in the taxable years ending December 31, 2017 and before January 1, 2021, to each of the five
taxable years preceding the taxable year of the loss. Additionally, the 80% limitation related to application of NOL’s towards
current federal taxable income has been removed for taxable years prior to January 1, 2021; thereby allowing 100% of the NOL to be applied
to federal taxable income.
To
the best of the Company’s knowledge, Hupecol Meta has made all requisite filings relative to its operations, including those in
Colombia, and that there are no know or expected tax issues, payments due, or judgments related to Hupecol Meta that would adversely
impact the Company’s cost method investment therein.
|
| X |
- DefinitionThe entire disclosure for income tax. Reference 1: http://www.xbrl.org/2003/role/disclosureRef
-Topic 740
-SubTopic 10
-Name Accounting Standards Codification
-Section 50
-Paragraph 12
-Publisher FASB
-URI https://asc.fasb.org/1943274/2147482685/740-10-50-12
Reference 2: http://www.xbrl.org/2003/role/exampleRef
-Topic 740
-SubTopic 10
-Name Accounting Standards Codification
-Section 55
-Paragraph 231
-Publisher FASB
-URI https://asc.fasb.org/1943274/2147482663/740-10-55-231
Reference 3: http://www.xbrl.org/2003/role/disclosureRef
-Topic 740
-SubTopic 10
-Name Accounting Standards Codification
-Section 50
-Paragraph 12C
-Publisher FASB
-URI https://asc.fasb.org/1943274/2147482685/740-10-50-12C
Reference 4: http://www.xbrl.org/2003/role/disclosureRef
-Topic 740
-SubTopic 10
-Name Accounting Standards Codification
-Section 50
-Paragraph 12B
-Publisher FASB
-URI https://asc.fasb.org/1943274/2147482685/740-10-50-12B
Reference 5: http://www.xbrl.org/2003/role/disclosureRef
-Topic 740
-SubTopic 270
-Name Accounting Standards Codification
-Section 50
-Paragraph 1
-Publisher FASB
-URI https://asc.fasb.org/1943274/2147477891/740-270-50-1
Reference 6: http://www.xbrl.org/2003/role/disclosureRef
-Topic 740
-SubTopic 10
-Name Accounting Standards Codification
-Section S99
-Paragraph 1
-Subparagraph (SAB Topic 6.I.5.Q1)
-Publisher FASB
-URI https://asc.fasb.org/1943274/2147479360/740-10-S99-1
Reference 7: http://www.xbrl.org/2003/role/disclosureRef
-Topic 946
-SubTopic 20
-Name Accounting Standards Codification
-Section 50
-Paragraph 13
-Publisher FASB
-URI https://asc.fasb.org/1943274/2147480990/946-20-50-13
Reference 8: http://www.xbrl.org/2003/role/disclosureRef
-Topic 235
-SubTopic 10
-Name Accounting Standards Codification
-Section S99
-Paragraph 1
-Subparagraph (SX 210.4-08(h)(2))
-Publisher FASB
-URI https://asc.fasb.org/1943274/2147480678/235-10-S99-1
Reference 9: http://www.xbrl.org/2003/role/disclosureRef
-Topic 740
-Name Accounting Standards Codification
-Publisher FASB
-URI https://asc.fasb.org/740/tableOfContent
Reference 10: http://www.xbrl.org/2003/role/disclosureRef
-Topic 740
-SubTopic 10
-Name Accounting Standards Codification
-Section 50
-Paragraph 14
-Publisher FASB
-URI https://asc.fasb.org/1943274/2147482685/740-10-50-14
Reference 11: http://www.xbrl.org/2003/role/disclosureRef
-Topic 740
-SubTopic 10
-Name Accounting Standards Codification
-Section 50
-Paragraph 21
-Publisher FASB
-URI https://asc.fasb.org/1943274/2147482685/740-10-50-21
Reference 12: http://www.xbrl.org/2003/role/disclosureRef
-Topic 740
-SubTopic 10
-Name Accounting Standards Codification
-Section 50
-Paragraph 17
-Subparagraph (b)
-Publisher FASB
-URI https://asc.fasb.org/1943274/2147482685/740-10-50-17
Reference 13: http://www.xbrl.org/2003/role/disclosureRef
-Topic 740
-SubTopic 10
-Name Accounting Standards Codification
-Section S99
-Paragraph 2
-Subparagraph (SAB Topic 11.C)
-Publisher FASB
-URI https://asc.fasb.org/1943274/2147479360/740-10-S99-2
Reference 14: http://www.xbrl.org/2003/role/disclosureRef
-Topic 740
-SubTopic 30
-Name Accounting Standards Codification
-Section 50
-Paragraph 2
-Subparagraph (a)
-Publisher FASB
-URI https://asc.fasb.org/1943274/2147482603/740-30-50-2
| Name: |
us-gaap_IncomeTaxDisclosureTextBlock |
| Namespace Prefix: |
us-gaap_ |
| Data Type: |
dtr-types:textBlockItemType |
| Balance Type: |
na |
| Period Type: |
duration |
|
v3.25.0.1
COMMITMENTS AND CONTINGENCIES
|
12 Months Ended |
Dec. 31, 2024 |
|---|
| Commitments and Contingencies Disclosure [Abstract] |
|
| COMMITMENTS AND CONTINGENCIES |
NOTE
9—COMMITMENTS AND CONTINGENCIES
Lease
Commitment
The
Company leases office facilities under an operating lease agreement that expires October 31, 2025. During the year ended December 31,
2024, the operating cash outflows related to operating lease liabilities were $87,288 and the expense for the amortization of the right
of use asset for operating leases was $66,741. As of December 31, 2024, the Company’s operating lease had a weighted-average remaining
term of 0.83 years and a weighted average discount rate of 12%. Below is a summary of the Company’s right of use assets and liabilities
as of December 31, 2024:
Right
of use asset
SCHEDULE OF FUTURE PAYMENTS UNDER LEASE AGREEMENT
| Year | |
Amount | |
| 2025 | |
| 75,051 | |
| Thereafter | |
| — | |
| Total future lease payments | |
| 75,051 | |
| Less: imputed interest | |
| (3,969 | ) |
| Present value of future operating lease payments | |
| 71,082 | |
| Less: current portion of operating lease liabilities | |
| 71,082 | |
| Long-term operating lease liability | |
$ | — | |
During
the years ended December 31, 2024 and 2023, the Company recognized operating lease expense of $88,644 and $88,644, respectively, which
is included in general and administrative expenses in the Company’s consolidated statements of operations. The Company does not
have any capital leases or other operating lease commitments.
Legal
Contingencies
The
Company is subject to legal proceedings, claims and liabilities that arise in the ordinary course of its business. The Company accrues
for losses associated with legal claims when such losses are probable and can be reasonably estimated. These accruals are adjusted as
further information develops or circumstances change.
Environmental
Contingencies
The
Company’s oil and natural gas operations are subject to stringent federal, state and local laws and regulations relating to the
release or disposal of materials into the environment or otherwise relating to environmental protection. These laws and regulations may
require the acquisition of a permit before drilling commences, restrict the types, quantities and concentration of substances that can
be released into the environment in connection with drilling and production activities, limit or prohibit drilling activities on certain
lands lying within wilderness, wetlands and other protected areas, and impose substantial liabilities for pollution resulting from our
operations. Failure to comply with these laws and regulations may result in the assessment of administrative, civil and criminal penalties,
incurrence of investigatory or remedial obligations or the imposition of injunctive relief. Changes in environmental laws and regulations
occur frequently, and any changes that result in more stringent or costly waste handling, storage, transport, disposal or cleanup requirements
could require the Company to make significant expenditures to maintain compliance, and may otherwise have a material adverse effect on
its results of operations, competitive position or financial condition as well as the industry in general. Under these environmental
laws and regulations, the Company could be held strictly liable for the removal or remediation of previously released materials or property
contamination regardless of whether the Company was responsible for the release or if its operations were standard in the industry at
the time they were performed. The Company maintains insurance coverage, which it believes is customary in the industry, although the
Company is not fully insured against all environmental risks.
Development
Commitments
During
the ordinary course of oil and gas prospect development, the Company commits to a proportionate share for the cost of acquiring mineral
interests, drilling exploratory or development wells and acquiring seismic and geological information.
Production
Incentive Arrangements and ORRIs
In
conjunction with our efforts to secure oil and gas prospects, financing and services, we have, from time to time, granted overriding
royalty interests (“ORRI”) in various properties and have adopted a Production Incentive Compensation Plan under which grant
interests in pools, which may take the form of ORRIs, to provide additional incentive identify and secure attractive oil and gas properties.
Production
Incentive Compensation Plan. In August 2013, the Company’s compensation committee adopted a Production Incentive Compensation
Plan. The purpose of the Plan is to encourage employees and consultants participating in the Plan to identify and secure for the Company
participation in attractive oil and gas opportunities.
Under
that Plan, the committee may establish one or more Pools and designate employees and consultants to participate in those Pools and designate
prospects and wells, and a defined percentage of the Company’s revenues from those wells, to fund those Pools. Only prospects acquired
on or after establishment of the Plan, and excluding all prospects in Colombia, may be designated to fund a Pool. The maximum percentage
of the Company’s share of revenues from a well that may be designated to fund a Pool is 2% (the “Pool Cap”); provided,
however, that with respect to wells with a net revenue interest to the 8/8 of less than 73%, the Pool Cap with respect to such wells
shall be reduced on a 1-for-1 basis such that no portion of the Company’s revenues from a well may be designated to fund a Pool
if the NRI is 71% or less.
Designated
participants in a Pool will be assigned a specific percentage out of the Company’s revenues assigned to the Pool and will be paid
that percentage of such revenues from all wells designated to such Pool and spud during that participant’s employment or services
with the Company. In no event may the percentage assigned to the Company’s chief executive officer relative to any well within
a Pool exceed one-half of the applicable Pool Cap for that well. Payouts of revenues funded into Pools shall be made to participants
not later than 60 days following year end, subject to the committee’s right to make partial interim payouts. Participants will
continue to receive their percentage share of revenues from wells included in a Pool and spud during the term of their employment or
service so long as revenues continue to be derived by the Company from those wells even after termination of employment or services of
the Participant; provided, however, that a participant’s interest in all Pools shall terminate on the date of termination of employment
or services where such termination is for cause.
In
the event of certain changes in control of the Company, the acquirer or survivor of such transaction must assume all obligations under
the Plan; provided, however, that in lieu of such assumption obligation, the committee may, at its sole discretion, assign overriding
royalty interests in wells to substantially mirror the rights of participants under the Plan. Similarly, the committee may, at any time,
assign overriding royalty interests in wells in settlement of obligations under the Plan.
The
Plan is administered by the Company’s compensation committee which shall consult with the Company’s chief executive officer
relative to Pool participants, prospects, wells and interests assign although the committee will have final and absolute authority to
make all such determinations.
During
2024, no pools were established under the Plan.
The
Company records amounts payable under the plan as a reduction to revenue as revenues are recognized from prospects included in pools
covered by the plan based on the participants’ interest in such prospect revenues and records the same as accounts payable until
such time as such amounts are paid out.
ORRI
Grants. All present and future prospects in Colombia are subject to a 1.5%
ORRI in favor of each of our former Chairman and Chief Executive Officer and a former director.
Payments
made by the Company under the Plan and ORRI’s totaled $42,450 and $47,724 in 2024 and 2023, respectively. As of December 31, 2024
and 2023, the Company had accrued $0 and $0, respectively, under the Plan as accounts payable.
|
| X |
- References
+ Details
| Name: |
us-gaap_CommitmentsAndContingenciesDisclosureAbstract |
| Namespace Prefix: |
us-gaap_ |
| Data Type: |
xbrli:stringItemType |
| Balance Type: |
na |
| Period Type: |
duration |
|
| X |
- DefinitionThe entire disclosure for commitments and contingencies. Reference 1: http://www.xbrl.org/2009/role/commonPracticeRef
-Topic 405
-SubTopic 30
-Name Accounting Standards Codification
-Publisher FASB
-URI https://asc.fasb.org/405-30/tableOfContent
Reference 2: http://www.xbrl.org/2003/role/disclosureRef
-Topic 440
-SubTopic 10
-Name Accounting Standards Codification
-Section 50
-Paragraph 4
-Subparagraph (a)
-Publisher FASB
-URI https://asc.fasb.org/1943274/2147482648/440-10-50-4
Reference 3: http://www.xbrl.org/2009/role/commonPracticeRef
-Topic 450
-Name Accounting Standards Codification
-Publisher FASB
-URI https://asc.fasb.org/450/tableOfContent
Reference 4: http://www.xbrl.org/2003/role/disclosureRef
-Topic 954
-SubTopic 440
-Name Accounting Standards Codification
-Section 50
-Paragraph 1
-Subparagraph (a)
-Publisher FASB
-URI https://asc.fasb.org/1943274/2147478522/954-440-50-1
Reference 5: http://www.xbrl.org/2003/role/disclosureRef
-Topic 440
-SubTopic 10
-Name Accounting Standards Codification
-Section 50
-Paragraph 4
-Subparagraph (c)
-Publisher FASB
-URI https://asc.fasb.org/1943274/2147482648/440-10-50-4
Reference 6: http://fasb.org/us-gaap/role/ref/legacyRef
-Topic 440
-Name Accounting Standards Codification
-Publisher FASB
-URI https://asc.fasb.org/440/tableOfContent
| Name: |
us-gaap_CommitmentsAndContingenciesDisclosureTextBlock |
| Namespace Prefix: |
us-gaap_ |
| Data Type: |
dtr-types:textBlockItemType |
| Balance Type: |
na |
| Period Type: |
duration |
|
v3.25.0.1
GEOGRAPHICAL INFORMATION
|
12 Months Ended |
Dec. 31, 2024 |
|---|
| Geographical Information |
|
| GEOGRAPHICAL INFORMATION |
NOTE
10—GEOGRAPHICAL INFORMATION
The
Company currently has operations in two geographical areas, the United States and Colombia. Revenues for the years ended December 31,
2024 and 2023 and long-lived assets as of December 31, 2024 and 2023 attributable to each geographical area are presented below:
SCHEDULE
OF REVENUES AND LONG LIVED ASSETS ATTRIBUTABLE TO GEOGRAPHICAL AREA
| | |
2024 | | |
2023 | |
| | |
Revenues | | |
Long Lived Assets, Net | | |
Revenues | | |
Long Lived Assets, Net | |
| North America | |
$ | 560,180 | | |
$ | 1,117,636 | | |
$ | 794,027 | | |
$ | 1,559,301 | |
| South America | |
| — | | |
| — | | |
| — | | |
| — | |
| Total | |
$ | 560,180 | | |
$ | 1,117,636 | | |
$ | 794,027 | | |
$ | 1,559,301 | |
|
| X |
- DefinitionGeographical Information [Text Block]
| Name: |
HUSA_GeographicalInformationTextBlock |
| Namespace Prefix: |
HUSA_ |
| Data Type: |
dtr-types:textBlockItemType |
| Balance Type: |
na |
| Period Type: |
duration |
|
v3.25.0.1
SEGMENT INFORMATION
|
12 Months Ended |
Dec. 31, 2024 |
|---|
| Segment Reporting [Abstract] |
|
| SEGMENT INFORMATION |
NOTE
11 — SEGMENT INFORMATION
The Company’s chief operating decision maker (“CODM”),
the Chief Executive Officer, manages the Company’s business activities as a single operating and reportable segment at the consolidated
level. Accordingly, our CODM uses net income to measure profit or loss, allocate resources, and assess performance. Further, the CODM
is regularly provided with and utilizes consolidated functional expenses, as presented in the accompanying consolidated statements of
operations, and total assets at the consolidated level, as included in the consolidated balance sheets herein, to manage the Company’s
operations.
|
| X |
- References
+ Details
| Name: |
us-gaap_SegmentReportingAbstract |
| Namespace Prefix: |
us-gaap_ |
| Data Type: |
xbrli:stringItemType |
| Balance Type: |
na |
| Period Type: |
duration |
|
| X |
- DefinitionThe entire disclosure for reporting segments including data and tables. Reportable segments include those that meet any of the following quantitative thresholds a) it's reported revenue, including sales to external customers and intersegment sales or transfers is 10 percent or more of the combined revenue, internal and external, of all operating segments b) the absolute amount of its reported profit or loss is 10 percent or more of the greater, in absolute amount of 1) the combined reported profit of all operating segments that did not report a loss or 2) the combined reported loss of all operating segments that did report a loss c) its assets are 10 percent or more of the combined assets of all operating segments. Reference 1: http://www.xbrl.org/2003/role/exampleRef
-Topic 280
-SubTopic 10
-Name Accounting Standards Codification
-Section 55
-Paragraph 48
-Publisher FASB
-URI https://asc.fasb.org/1943274/2147482785/280-10-55-48
Reference 2: http://www.xbrl.org/2003/role/disclosureRef
-Topic 280
-SubTopic 10
-Name Accounting Standards Codification
-Section 50
-Paragraph 32
-Subparagraph (f)
-Publisher FASB
-URI https://asc.fasb.org/1943274/2147482810/280-10-50-32
Reference 3: http://www.xbrl.org/2003/role/disclosureRef
-Topic 270
-SubTopic 10
-Name Accounting Standards Codification
-Section 50
-Paragraph 1
-Subparagraph (i)
-Publisher FASB
-URI https://asc.fasb.org/1943274/2147482964/270-10-50-1
Reference 4: http://www.xbrl.org/2003/role/disclosureRef
-Topic 280
-SubTopic 10
-Name Accounting Standards Codification
-Section 50
-Paragraph 32
-Subparagraph (ee)
-Publisher FASB
-URI https://asc.fasb.org/1943274/2147482810/280-10-50-32
Reference 5: http://fasb.org/us-gaap/role/ref/otherTransitionRef
-Topic 280
-SubTopic 10
-Name Accounting Standards Codification
-Section 50
-Paragraph 32
-Subparagraph (d)
-Publisher FASB
-URI https://asc.fasb.org/1943274/2147482810/280-10-50-32
Reference 6: http://www.xbrl.org/2003/role/exampleRef
-Topic 280
-SubTopic 10
-Name Accounting Standards Codification
-Section 55
-Paragraph 54
-Subparagraph (d)
-Publisher FASB
-URI https://asc.fasb.org/1943274/2147482785/280-10-55-54
Reference 7: http://www.xbrl.org/2003/role/exampleRef
-Topic 280
-SubTopic 10
-Name Accounting Standards Codification
-Section 55
-Paragraph 47
-Subparagraph (c)
-Publisher FASB
-URI https://asc.fasb.org/1943274/2147482785/280-10-55-47
Reference 8: http://www.xbrl.org/2003/role/exampleRef
-Topic 280
-SubTopic 10
-Name Accounting Standards Codification
-Section 55
-Paragraph 54
-Subparagraph (a)
-Publisher FASB
-URI https://asc.fasb.org/1943274/2147482785/280-10-55-54
Reference 9: http://www.xbrl.org/2003/role/exampleRef
-Topic 280
-SubTopic 10
-Name Accounting Standards Codification
-Section 55
-Paragraph 47
-Subparagraph (a)
-Publisher FASB
-URI https://asc.fasb.org/1943274/2147482785/280-10-55-47
Reference 10: http://www.xbrl.org/2003/role/exampleRef
-Topic 280
-SubTopic 10
-Name Accounting Standards Codification
-Section 55
-Paragraph 54
-Subparagraph (e)
-Publisher FASB
-URI https://asc.fasb.org/1943274/2147482785/280-10-55-54
Reference 11: http://www.xbrl.org/2003/role/exampleRef
-Topic 280
-SubTopic 10
-Name Accounting Standards Codification
-Section 55
-Paragraph 47
-Subparagraph (d)
-Publisher FASB
-URI https://asc.fasb.org/1943274/2147482785/280-10-55-47
Reference 12: http://www.xbrl.org/2003/role/disclosureRef
-Topic 280
-SubTopic 10
-Name Accounting Standards Codification
-Section 50
-Paragraph 22
-Publisher FASB
-URI https://asc.fasb.org/1943274/2147482810/280-10-50-22
Reference 13: http://www.xbrl.org/2003/role/disclosureRef
-Topic 280
-SubTopic 10
-Name Accounting Standards Codification
-Section 50
-Paragraph 31
-Publisher FASB
-URI https://asc.fasb.org/1943274/2147482810/280-10-50-31
Reference 14: http://www.xbrl.org/2003/role/disclosureRef
-Topic 280
-SubTopic 10
-Name Accounting Standards Codification
-Section 50
-Paragraph 34
-Publisher FASB
-URI https://asc.fasb.org/1943274/2147482810/280-10-50-34
Reference 15: http://www.xbrl.org/2003/role/disclosureRef
-Topic 280
-SubTopic 10
-Name Accounting Standards Codification
-Section 50
-Paragraph 26C
-Publisher FASB
-URI https://asc.fasb.org/1943274/2147482810/280-10-50-26C
Reference 16: http://www.xbrl.org/2003/role/disclosureRef
-Topic 280
-SubTopic 10
-Name Accounting Standards Codification
-Section 50
-Paragraph 26B
-Publisher FASB
-URI https://asc.fasb.org/1943274/2147482810/280-10-50-26B
Reference 17: http://www.xbrl.org/2003/role/disclosureRef
-Topic 280
-SubTopic 10
-Name Accounting Standards Codification
-Section 50
-Paragraph 15
-Publisher FASB
-URI https://asc.fasb.org/1943274/2147482810/280-10-50-15
Reference 18: http://www.xbrl.org/2003/role/disclosureRef
-Topic 280
-SubTopic 10
-Name Accounting Standards Codification
-Section 50
-Paragraph 42
-Publisher FASB
-URI https://asc.fasb.org/1943274/2147482810/280-10-50-42
Reference 19: http://www.xbrl.org/2003/role/disclosureRef
-Topic 280
-SubTopic 10
-Name Accounting Standards Codification
-Section 50
-Paragraph 40
-Publisher FASB
-URI https://asc.fasb.org/1943274/2147482810/280-10-50-40
Reference 20: http://www.xbrl.org/2003/role/disclosureRef
-Topic 280
-Name Accounting Standards Codification
-Publisher FASB
-URI https://asc.fasb.org/280/tableOfContent
Reference 21: http://www.xbrl.org/2003/role/disclosureRef
-Topic 280
-SubTopic 10
-Name Accounting Standards Codification
-Section 50
-Paragraph 26
-Publisher FASB
-URI https://asc.fasb.org/1943274/2147482810/280-10-50-26
Reference 22: http://www.xbrl.org/2003/role/disclosureRef
-Topic 280
-SubTopic 10
-Name Accounting Standards Codification
-Section 50
-Paragraph 41
-Publisher FASB
-URI https://asc.fasb.org/1943274/2147482810/280-10-50-41
Reference 23: http://www.xbrl.org/2003/role/disclosureRef
-Topic 280
-SubTopic 10
-Name Accounting Standards Codification
-Section 50
-Paragraph 21
-Subparagraph (a)
-Publisher FASB
-URI https://asc.fasb.org/1943274/2147482810/280-10-50-21
Reference 24: http://www.xbrl.org/2003/role/disclosureRef
-Topic 280
-SubTopic 10
-Name Accounting Standards Codification
-Section 50
-Paragraph 21
-Subparagraph (b)
-Publisher FASB
-URI https://asc.fasb.org/1943274/2147482810/280-10-50-21
Reference 25: http://www.xbrl.org/2003/role/disclosureRef
-Topic 280
-SubTopic 10
-Name Accounting Standards Codification
-Section 50
-Paragraph 32
-Subparagraph (e)
-Publisher FASB
-URI https://asc.fasb.org/1943274/2147482810/280-10-50-32
| Name: |
us-gaap_SegmentReportingDisclosureTextBlock |
| Namespace Prefix: |
us-gaap_ |
| Data Type: |
dtr-types:textBlockItemType |
| Balance Type: |
na |
| Period Type: |
duration |
|
v3.25.0.1
SUBSEQUENT EVENTS
|
12 Months Ended |
Dec. 31, 2024 |
|---|
| Subsequent Events [Abstract] |
|
| SUBSEQUENT EVENTS |
NOTE
12—SUBSEQUENT EVENTS
On
February 20, 2025, the Company
entered into a Share Exchange Agreement with the members of Abundia Global Impact Group, LLC (“AGIG”). In the Share
Exchange Agreement, the Company has agreed to issue to the members of AGIG a number of shares of our common stock equal to 94% of
the Company’s issued and outstanding shares (after taking into account such issuance). As a result of entering into the Share
Exchange Agreement, we will acquire all of the issued and outstanding units of AGIG, and AGIG will become a wholly-owned subsidiary
of the Company. Under the Share Exchange Agreement, the Company is obligated to obtain shareholder approval for the amendment of our
Certificate of Incorporation to increase the number of authorized shares of common stock to 300,000,000
and for the issuance of approximately 246,000,000
shares to the members of AGIG. The acquisition is subject to shareholder approval and standard closing conditions.
In
January 2025, the Company sold 2,600,000 shares of its common stock in a registered direct offering for net proceeds of $3,897,000.
In
January 2025, the Company issued 24,202
options to its CEO and 24,202 options to a board member as compensation. In February 2025, the Company issued 10,638
options to its CEO as compensation.
|
| X |
- References
+ Details
| Name: |
us-gaap_SubsequentEventsAbstract |
| Namespace Prefix: |
us-gaap_ |
| Data Type: |
xbrli:stringItemType |
| Balance Type: |
na |
| Period Type: |
duration |
|
| X |
- DefinitionThe entire disclosure for significant events or transactions that occurred after the balance sheet date through the date the financial statements were issued or the date the financial statements were available to be issued. Examples include: the sale of a capital stock issue, purchase of a business, settlement of litigation, catastrophic loss, significant foreign exchange rate changes, loans to insiders or affiliates, and transactions not in the ordinary course of business. Reference 1: http://www.xbrl.org/2003/role/disclosureRef
-Topic 855
-Name Accounting Standards Codification
-Publisher FASB
-URI https://asc.fasb.org/855/tableOfContent
Reference 2: http://www.xbrl.org/2003/role/disclosureRef
-Topic 855
-SubTopic 10
-Name Accounting Standards Codification
-Section 50
-Paragraph 2
-Subparagraph (a)
-Publisher FASB
-URI https://asc.fasb.org/1943274/2147483399/855-10-50-2
| Name: |
us-gaap_SubsequentEventsTextBlock |
| Namespace Prefix: |
us-gaap_ |
| Data Type: |
dtr-types:textBlockItemType |
| Balance Type: |
na |
| Period Type: |
duration |
|
v3.25.0.1
SUPPLEMENTAL INFORMATION ON OIL AND GAS EXPLORATION, DEVELOPMENT AND PRODUCTION ACTIVITIES (UNAUDITED)
|
12 Months Ended |
Dec. 31, 2024 |
|---|
| Extractive Industries [Abstract] |
|
| SUPPLEMENTAL INFORMATION ON OIL AND GAS EXPLORATION, DEVELOPMENT AND PRODUCTION ACTIVITIES (UNAUDITED) |
NOTE
13—SUPPLEMENTAL INFORMATION ON OIL AND GAS EXPLORATION, DEVELOPMENT AND PRODUCTION ACTIVITIES (UNAUDITED)
This
footnote provides unaudited information required by FASB ASC Topic 932, Extractive Activities—Oil and Gas.
Geographical
Data
The
following table shows the Company’s oil and gas revenues and lease operating expenses, which excludes the joint venture expenses
incurred in South America, by geographic area:
SCHEDULE
OF OIL AND GAS REVENUES AND LEASE OPERATING EXPENSES
| | |
2024
| | |
2023
| |
| Revenues | |
| | | |
| | |
| North America | |
$ | 560,180 | | |
$ | 794,027 | |
| South America | |
| — | | |
| — | |
| | |
$ | 560,180 | | |
$ | 794,027 | |
| | |
| | | |
| | |
| Production Cost | |
| | | |
| | |
| North America | |
$ | 747,559 | | |
$ | 473,925 | |
| South America | |
| — | | |
| — | |
| | |
$ | 747,559 | | |
$ | 473,925 | |
Capital
Costs
Capitalized
costs and accumulated depletion relating to the Company’s oil and gas producing activities as of December 31, 2024, all of which
are onshore properties located in the United States and Colombia, South America are summarized below:
CAPITALIZED
COSTS AND ACCUMULATED DEPLETION RELATING TO OIL AND GAS PRODUCTION ACTIVITIES
| | |
United States | | |
South America | | |
Total | |
| Unproved properties not being amortized | |
$ | — | | |
$ | — | | |
$ | — | |
| Proved properties being amortized | |
| 13,326,003 | | |
| 49,444,654 | | |
| 62,770,657 | |
| Accumulated depreciation, depletion, amortization and impairment | |
| (12,208,367 | ) | |
| (49,444,654 | ) | |
| (61,653,021 | ) |
| | |
| | | |
| | | |
| | |
| Net capitalized costs | |
$ | 1,117,636 | | |
$ | — | | |
$ | 1,117,636 | |
Amortization
Rate
The
amortization rate per unit based on barrel of oil equivalents was $10.75 for the United States for the year ended December 31, 2024.
Reserve
Information and Related Standardized Measure of Discounted Future Net Cash Flows
The
unaudited supplemental information on oil and gas exploration and production activities has been presented in accordance with reserve
estimation and disclosures rules issued by the SEC in 2008. Under those rules, average first-day-of-the-month price during the 12-month
period before the end of the year are used when estimating whether reserve quantities are economical to produce. This same 12-month average
price is also used in calculating the aggregate amount of (and changes in) future cash inflows related to the standardized measure of
discounted future net cash flows. The rules also allow for the use of reliable technology to estimate proved oil and gas reserves if
those technologies have been demonstrated to result in reliable conclusions about reserve volumes. Disclosures by geographic area include
the United States and South America, which consists of our interests in Colombia. The supplemental unaudited presentation of proved reserve
quantities and related standardized measure of discounted future net cash flows provides estimates only and does not purport to reflect
realizable values or fair market values of the Company’s reserves. Volumes reported for proved reserves are based on reasonable
estimates. These estimates are consistent with current knowledge of the characteristics and production history of the reserves. The Company
emphasizes that reserve estimates are inherently imprecise and that estimates of new discoveries are more imprecise than those of producing
oil and gas properties. Accordingly, significant changes to these estimates can be expected as future information becomes available.
Proved
reserves are those estimated reserves of crude oil (including condensate and natural gas liquids) and natural gas that geological and
engineering data demonstrate with reasonable certainty to be recoverable in future years from known reservoirs under existing economic
and operating conditions. Proved developed reserves are those expected to be recovered through existing wells, equipment, and operating
methods.
The
reserve estimates set forth below were prepared by Russell K. Hall and Associates, Inc. (“R.K. Hall”), utilizing reserve
definitions and pricing requirements prescribed by the SEC. R.K. Hall is an independent professional engineering firm specializing in
the technical and financial evaluation of oil and gas assets. R.K. Hall’s report was conducted under the direction of Russell K.
Hall, founder and President of R.K. Hall. Mr. Hall holds a BS in Mechanical Engineering from the University of Oklahoma and is a registered
professional engineer with more than 30 years of experience in reserve evaluation services. R.K. Hall and their respective employees
have no interest in the Company and were objective in determining the results of the Company’s reserves.
Total
estimated proved developed, proved non-producing, and undeveloped reserves by product type and the changes therein are set forth below for the years indicated.
SCHEDULE OF PROVED DEVELOPED AND
UNDEVELOPED RESERVES BY PRODUCT TYPE
| | |
United States | |
| | |
Gas (mcf) | | |
Oil (bbls) | | |
Natural Gas Liquids (gallons) |
|
| Total proved reserves | |
| | | |
| | | |
| |
|
| | |
| | | |
| | | |
| |
|
| Balance December 31, 2022 | |
| 1,030,420 | | |
| 83,517 | | |
| — |
|
| | |
| | | |
| | | |
| |
|
| Revisions of prior estimates | |
| (365,414 | ) | |
| (16,947 | ) | |
| — |
|
| Production | |
| (57,360 | ) | |
| (7,719 | ) | |
| — |
|
| | |
| | | |
| | | |
| |
|
| Balance December 31, 2023 | |
| 607,646 | | |
| 58,599 | | |
| — |
|
| | |
| | | |
| | | |
| |
|
| Extensions and discoveries |
|
|
78,980 |
|
|
|
17,000 |
|
|
|
502,614 |
|
| Revisions to prior estimates | |
| (214,960 | ) | |
| (23,217 | ) | |
| 1,119,316 |
|
| Production | |
| (53,476 | ) | |
| (5,992 | ) | |
| (159,680 |
) |
| | |
| | | |
| | | |
| |
|
| Balance December 31, 2024 | |
| 418,190 | | |
| 46,390 | | |
| 1,462,250 |
|
| | |
| | | |
| | | |
| |
|
| Proved developed reserves | |
| | | |
| | | |
| |
|
| at December 31, 2023 | |
| 607,646 | | |
| 58,599 | | |
| 1,621,930 |
|
| at December 31, 2024 | |
| 418,190 | | |
| 46,390 | | |
| 1,462,250 |
|
| | |
| | | |
| | | |
| |
|
| Proved undeveloped reserves | |
| | | |
| | | |
| |
|
| at December 31, 2023 | |
| — | | |
| — | | |
| — |
|
| at December 31, 2024 | |
| — | | |
| — | | |
| — |
|
As
of December 31, 2024 and 2023, the Company had no proved undeveloped (“PUD”) reserves and no reserves outside of the United States.
The
standardized measure of discounted future net cash flows relating to proved oil and gas reserves is computed using average first-day-of
the-month prices for oil and gas during the preceding 12-month period (with consideration of price changes only to the extent provided
by contractual arrangements), applied to the estimated future production of proved oil and gas reserves, less estimated future expenditures
(based on year-end costs) to be incurred in developing and producing the proved reserves, less estimated related future income tax expenses
(based on year-end statutory tax rates, with consideration of future tax rates already legislated), and assuming continuation of existing
economic conditions. Future income tax expenses give effect to permanent differences and tax credits but do not reflect the impact of
continuing operations including property acquisitions and exploration. The estimated future cash flows are then discounted using a rate
of ten percent a year to reflect the estimated timing of the future cash flows.
Standardized
measure of discounted future net cash flows at December 31, 2024:
STANDARDIZED
MEASURE OF DISCOUNTED FUTURE NET CASH FLOWS
| | |
United
States | | |
South
America | | |
Total | |
| Future cash flows from sales of oil and gas | |
$ | 4,427,982 | | |
| — | | |
| 4,427,982 | |
| Future production cost | |
| (2,400,990 | ) | |
| — | | |
| (2,400,990 | ) |
| Future development cost | |
| (155,628 | ) | |
| — | | |
| 155,628 | |
| Future net cash flows | |
| 1,871,364 | | |
| — | | |
| 1,871,364 | |
| 10% annual discount for timing of cash flow | |
| (748,094 | ) | |
| — | | |
| (748,094 | ) |
| | |
| | | |
| | | |
| | |
| Standardized measure of discounted future net cash flow relating to proved oil and gas reserves | |
$ | 1,123,270 | | |
| — | | |
| 1,123,270 | |
| | |
| | | |
| | | |
| | |
| Changes in standardized measure: | |
| | | |
| | | |
| | |
| Change due to current year operations Sales, net of production costs | |
$ | 39,359 | ) | |
| — | | |
| 39,359 | |
| Sales, net of production costs | |
$ | 39,359 | ) | |
| — | | |
| 39,359 | ) |
| Change due to revisions in standardized variables: | |
| — | | |
| | | |
| — | |
| Accretion of discount | |
| 156,472 | | |
| — | | |
| 156,472 | |
| Net change in sales and transfer price, net of production costs | |
| (1,433,013 | ) | |
| — | | |
| (1,433,013 | ) |
| Net change in future development cost | |
| — | | |
| — | | |
| — | |
| Discoveries | |
| 585,420 | | |
| — | | |
| 585,420 | |
| Revision and others | |
| (33,056 | ) | |
| — | | |
| (33,056 | ) |
| Changes in production rates and other | |
| 243,364 | | |
| — | | |
| 243,364 | |
| | |
| | | |
| | | |
| | |
| Net | |
| (441,454 | ) | |
| — | | |
| (441,454 | ) |
| Beginning of year | |
| 1,564,724 | | |
| — | | |
| 1,564,724 | |
| End of year | |
$ | 1,123,270 | | |
| — | | |
| 1,123,270 | |
Standardized
measure of discounted future net cash flows at December 31, 2023:
| | |
United
States | | |
South
America | | |
Total | |
| Future cash flows from sales of oil and gas | |
$ | 6,509,498 | | |
$ | — | | |
$ | 6,509,498 | |
| Future production cost | |
| (3,804,439 | ) | |
| — | | |
| (3,804,439 | ) |
| Future development cost | |
| — | | |
| — | | |
| — | |
| Future net cash flows | |
| 2,705,059 | | |
| — | | |
| 2,705,059 | |
| 10% annual discount for timing of cash flow | |
| (1,140,335 | ) | |
| — | | |
| (1,140,335 | ) |
| | |
| | | |
| | | |
| | |
| Standardized measure of discounted future net cash flow relating to proved oil and gas reserves | |
$ | 1,564,724 | | |
$ | — | | |
$ | 1,564,724 | |
| | |
| | | |
| | | |
| | |
| Changes in standardized measure: | |
| | | |
| | | |
| | |
| Change due to current year operations Sales, net of production costs | |
$ | (196,003 | ) | |
$ | — | | |
$ | (196,003 | ) |
| Sales, net of production costs | |
$ | (196,003 | ) | |
$ | — | | |
$ | (196,003 | ) |
| Change due to revisions in standardized variables: | |
| | | |
| | | |
| | |
| Accretion of discount | |
| 516,316 | | |
| — | | |
| 516,316 | |
| Net change in sales and transfer price, net of production costs | |
| (3,117,105 | ) | |
| — | | |
| (3,117,105 | |
| Net change in future development cost | |
| — | | |
| — | | |
| — | |
| Discoveries | |
| — | | |
| — | | |
| — | |
| Revision and others | |
| (645,668 | ) | |
| — | | |
| (645,668 | |
| Changes in production rates and other | |
| (155,975 | ) | |
| — | | |
| (155,975 | ) |
| | |
| | | |
| | | |
| | |
| Net | |
| (3,598,435 | ) | |
| — | | |
| (3,598,435 | |
| Beginning of year | |
| 5,163,159 | | |
| — | | |
| 5,163,159 | |
| End of year | |
$ | 1,564,724 | | |
$ | — | | |
$ | 1,564,724 | |
|
| X |
- DefinitionThe entire disclosure for oil- and gas-producing activities considered to be supplementary information. Includes, but is not limited to, proved reserve quantity, cost incurred and capitalized, result of operation, standardized measure, and change in standardized measure of discounted future cash flow. Reference 1: http://www.xbrl.org/2003/role/disclosureRef
-Topic 932
-SubTopic 270
-Name Accounting Standards Codification
-Section 50
-Paragraph 1
-Publisher FASB
-URI https://asc.fasb.org/1943274/2147478688/932-270-50-1
Reference 2: http://www.xbrl.org/2003/role/disclosureRef
-Topic 932
-SubTopic 235
-Name Accounting Standards Codification
-Section 50
-Paragraph 10
-Publisher FASB
-URI https://asc.fasb.org/1943274/2147477215/932-235-50-10
Reference 3: http://www.xbrl.org/2003/role/disclosureRef
-Topic 932
-SubTopic 235
-Name Accounting Standards Codification
-Section S99
-Paragraph 1
-Subparagraph (SAB Topic 12.A.3.e)
-Publisher FASB
-URI https://asc.fasb.org/1943274/2147477759/932-235-S99-1
Reference 4: http://www.xbrl.org/2003/role/disclosureRef
-Topic 932
-SubTopic 235
-Name Accounting Standards Codification
-Section S50
-Paragraph 3
-Publisher FASB
-URI https://asc.fasb.org/1943274/2147479097/932-235-S50-3
Reference 5: http://www.xbrl.org/2003/role/disclosureRef
-Topic 932
-SubTopic 235
-Name Accounting Standards Codification
-Section 50
-Paragraph 8
-Subparagraph (c)(2)
-Publisher FASB
-URI https://asc.fasb.org/1943274/2147477215/932-235-50-8
Reference 6: http://www.xbrl.org/2003/role/disclosureRef
-Topic 932
-Name Accounting Standards Codification
-Publisher FASB
-URI https://asc.fasb.org/932/tableOfContent
Reference 7: http://www.xbrl.org/2003/role/disclosureRef
-Topic 932
-SubTopic 235
-Name Accounting Standards Codification
-Section 50
-Paragraph 1C
-Publisher FASB
-URI https://asc.fasb.org/1943274/2147477215/932-235-50-1C
Reference 8: http://www.xbrl.org/2003/role/disclosureRef
-Topic 932
-SubTopic 235
-Name Accounting Standards Codification
-Section 50
-Paragraph 36
-Publisher FASB
-URI https://asc.fasb.org/1943274/2147477215/932-235-50-36
Reference 9: http://www.xbrl.org/2003/role/disclosureRef
-Topic 932
-SubTopic 235
-Name Accounting Standards Codification
-Section 50
-Paragraph 8
-Subparagraph (c)(1)
-Publisher FASB
-URI https://asc.fasb.org/1943274/2147477215/932-235-50-8
Reference 10: http://www.xbrl.org/2003/role/disclosureRef
-Topic 932
-SubTopic 235
-Name Accounting Standards Codification
-Section 50
-Paragraph 5
-Publisher FASB
-URI https://asc.fasb.org/1943274/2147477215/932-235-50-5
| Name: |
us-gaap_OilAndGasExplorationAndProductionIndustriesDisclosuresTextBlock |
| Namespace Prefix: |
us-gaap_ |
| Data Type: |
dtr-types:textBlockItemType |
| Balance Type: |
na |
| Period Type: |
duration |
|
v3.25.0.1
NATURE OF COMPANY AND SUMMARY OF SIGNIFICANT ACCOUNTING POLICIES (Policies)
|
12 Months Ended |
Dec. 31, 2024 |
|---|
| Organization, Consolidation and Presentation of Financial Statements [Abstract] |
|
| General |
General
Houston
American Energy Corp. (a Delaware corporation) (“the Company” or “HUSA”) was incorporated in 2001. The Company
is engaged, as a non-operating joint owner, in the exploration, development, and production of natural gas, crude oil, and condensate
from properties. The Company’s principal properties are in the Texas Permian Basin and international holdings in Colombia, South
America, with additional holdings in Gulf Coast areas of the United States.
|
| Consolidation |
Consolidation
The
accompanying consolidated financial statements include all accounts of HUSA and its subsidiary (HAEC Louisiana E&P, Inc.). All significant inter-company balances and transactions have been eliminated
in consolidation.
|
| Liquidity and Capital Requirements |
Liquidity
and Capital Requirements
The
accompanying consolidated financial statements have been prepared assuming that the Company will continue as a going concern, which contemplates
the realization of assets and the satisfaction of liabilities in the normal course of business for the twelve-month period following
the issuance date of these consolidated financial statements. With limited exceptions, the Company has incurred continuing losses since
2011, with an accumulated deficit of $85.2 million as of December 31, 2024.
The
Company believes that it has the ability to fund, from cash on hand, its operating costs and anticipated drilling operations for at least
the next twelve months following the issuance of these financial statements.
The
actual timing and number of wells drilled during 2025 and beyond will be principally controlled by the operators of the Company’s
acreage, based on a number of factors, including but not limited to availability of financing, performance of existing wells on the subject
acreage, energy prices and industry condition and outlook, costs of drilling and completion services and equipment and other factors
beyond the Company’s control or that of its operators.
In
the event that the Company pursues additional acreage acquisitions or expands its drilling plans, the Company may be required to secure
additional funding beyond our resources on hand. While the Company may, among other efforts, seek additional funding from “at-the-market”
sales of common stock, and private sales of equity and debt securities, it presently has limited shares of common stock authorized for
issuance to support sales of such shares and does not have any commitments to provide additional funding, and there can be no assurance
that the Company can secure the necessary capital to fund its share of drilling, acquisition or other costs on acceptable terms or at
all. If, for any reason, the Company is unable to fund its share of drilling and completion costs, it would forego participation in one
or more of such wells. In such event, the Company may be subject to penalties or to the possible loss of some of its rights and interests
in prospects with respect to which it fails to satisfy funding obligations and it may be required to curtail operations and forego opportunities.
|
| General Principles and Use of Estimates |
General
Principles and Use of Estimates
The
consolidated financial statements have been prepared in conformity with accounting principles generally accepted in the United States
of America. In preparing financial statements, management makes informed judgments and estimates that affect the reported amounts of
assets and liabilities as of the date of the financial statements and affect the reported amounts of revenues and expenses during the
reporting period. On an ongoing basis, management reviews its estimates, including those related to such potential matters as litigation,
environmental liabilities, income taxes, and determination of proved reserves of oil and gas and asset retirement obligations. Changes
in facts and circumstances may result in revised estimates and actual results may differ from these estimates.
|
| Cash and Cash Equivalents |
Cash
and Cash Equivalents
Cash
and cash equivalents consist of demand deposits and cash investments with initial maturity dates of less than three months when purchased.
As of December 31, 2024 and 2023, the Company had no cash equivalents outstanding.
|
| Concentration of Credit Risk |
Concentration
of Credit Risk
Financial
instruments that potentially subject the Company to a concentration of credit risk include cash, cash equivalents and marketable securities
(if any). The Company had cash deposits of $2.5 million in excess of the FDIC’s current insured limit of $250,000 at December 31,
2024 for interest bearing accounts. The Company has not experienced any losses on its deposits of cash and cash equivalents.
|
| Revenue Recognition |
Revenue
Recognition
The
Company’s revenue is comprised principally of revenue from exploration and production activities. The Company’s oil is sold
primarily to marketers, gatherers, and refiners. Natural gas is sold primarily to interstate and intrastate natural-gas pipelines, direct
end-users, industrial users, local distribution companies, and natural-gas marketers. Natural gas liquids, or NGLs, are sold primarily
to direct end-users, refiners, and marketers. Payment is generally received from the customer in the month following delivery.
Contracts
with customers have varying terms, including spot sales or month-to-month contracts, contracts with a finite term, and life-of-field
contracts where all production from a well or group of wells is sold to one or more customers. The Company recognizes sales revenues
for oil, natural gas, and NGLs based on the amount of each product sold to a customer when control transfers to the customer. Generally,
control transfers at the time of delivery to the customer at a pipeline interconnect, the tailgate of a processing facility, or as a
tanker lifting is completed. Revenue is measured based on the contract price, which may be index-based or fixed, and may include adjustments
for market differentials and downstream costs incurred by the customer, including gathering, transportation, and fuel costs.
Revenues
are recognized for the sale of the Company’s net share of production volumes.
The Company estimated the December 2024 revenue and related drilling expenses
for two US wells. Using actual oil production results for the month, the Company used historical lease operating expenses and average
price per BBL from prior months to calculate these estimates. No gas or NGL related revenue or expenses are included in the estimate.
|
| Loss per Share |
Loss
per Share
Basic
loss per share is computed by dividing net loss available to common shareholders by the weighted average common shares outstanding for
the period. Diluted earnings per share reflects the potential dilution that could occur if securities or other contracts to issue common
shares were exercised or converted in common shares that then shared in the earnings of the Company. In periods in which the Company
reports a net loss, dilutive securities are excluded from the calculation of diluted net loss per share amounts as the effect would be
anti-dilutive.
For
the years ended December 31, 2024 and 2023, the following warrants and options to purchase shares of common stock were excluded from
the computation of diluted net loss per share, as the inclusion of such shares would be anti-dilutive:
SCHEDULE OF COMPUTATION OF DILUTED NET LOSS PER SHARE
| | |
Year Ended December 31, | |
| | |
2024 | | |
2023 | |
| Stock warrants | |
| 94,400 | | |
| 94,400 | |
| Stock options | |
| 916,987 | | |
| 1,000,807 | |
| Totals | |
| 1,011,387 | | |
| 1,095,207 | |
|
| Accounts Receivable |
Accounts
Receivable
Accounts
receivable – other and escrow receivables have been evaluated for collectability and are recorded at their net realizable values.
|
| Allowance for Accounts Receivable |
Allowance
for Accounts Receivable
The
Company’s ability to collect outstanding receivables is critical to its operating performance and cashflows. Accounts receivable
are stated at an amount management expects to collect from outstanding balances. The Company extends credit in the normal course of business.
The Company regularly reviews outstanding receivables and when the Company determines that a party may not be able to make required payments,
a charge to bad debt expense in the period of determination is made. Though the Company’s bad debts have not historically been
significant, the Company could experience increased bad debt expense should a financial downturn occur. The Company updated its impairment model to utilize a forward-looking current expected credit losses (“CECL”)
model in place of the incurred loss methodology for financial instruments measured at amortized cost, primarily including its accounts
receivable and contract asset. In relation to available-for-sale (“AFS”) debt securities, the guidance eliminates the concept
of “other-than-temporary” impairment, and instead focuses on determining whether any impairment is a result of a credit loss
or other factors. The adoption of ASC 326 did not have a material impact on our unaudited condensed consolidated financial statements
as of the adoption date.
|
| Oil and Gas Properties |
Oil
and Gas Properties
The
Company uses the full cost method of accounting for exploration and development activities as defined by the SEC. Under this method of
accounting, the costs for unsuccessful, as well as successful, exploration and development activities are capitalized as oil and gas
properties. Capitalized costs include lease acquisition, geological and geophysical work, delay rentals, costs of drilling, completing
and equipping the wells and any internal costs that are directly related to acquisition, exploration and development activities but does
not include any costs related to production, general corporate overhead or similar activities. Proceeds from the sale or other disposition
of oil and gas properties are generally treated as a reduction in the capitalized costs of oil and gas properties, unless the impact
of such a reduction would significantly alter the relationship between capitalized costs and proved reserves of oil and natural gas attributable
to a country.
The
Company categorizes its full cost pools as costs subject to amortization and costs not being amortized. The sum of net capitalized costs
subject to amortization, including estimated future development and abandonment costs, are amortized using the unit-of-production method.
Depletion and amortization for oil and gas properties was $160,001 and $167,526 for the years ended December 31, 2024 and 2023, respectively,
and accumulated amortization, depreciation and impairment was $61,743,025 and $61,217,260 at December 31, 2024 and 2023, respectively.
|
| Costs Excluded |
Costs
Excluded
Oil
and gas properties include costs that are excluded from capitalized costs being amortized. These amounts represent costs of investments
in unproved properties. The Company excludes these costs on a country-by-country basis until proved reserves are found or until it is
determined that the costs are impaired. All costs excluded are reviewed quarterly to determine if impairment has occurred. The amount
of any impairment is transferred to the costs subject to amortization.
|
| Ceiling Test |
Ceiling
Test
Under
the full cost method of accounting, a ceiling test is performed each quarter. The full cost ceiling test is an impairment test prescribed
by SEC Regulation S-X. The ceiling test determines a limit, on a country-by-country basis, on the book value of oil and gas properties.
The capitalized costs of proved oil and gas properties, net of accumulated depreciation, depletion, amortization and impairment (“DD&A”)
and the related deferred income taxes, may not exceed the estimated future net cash flows from proved oil and gas reserves, calculated
for 2024 and 2023 using the average oil and natural gas sales price received by the Company as of the first trading day of each month
over the preceding twelve months (such prices are held constant throughout the life of the properties) with consideration of price change
only to the extent provided by contractual arrangement, discounted at 10%, net of related tax effects. If capitalized costs exceed this
limit, the excess is charged to expense and reflected as additional accumulated DD&A. During 2024 and 2023, the Company recorded
impairments of oil and gas properties totaling $275,760 and $537,686, respectively. The impairment reflects the decline in energy prices
and production during 2024.
|
| Furniture and Equipment |
Furniture
and Equipment
Office
equipment is stated at original cost and is depreciated on the straight-line basis over the useful life of the assets, which ranges from
three to five years.
Office
equipment having an original cost basis of $90,004 was fully depreciated as of January 1, 2020. Therefore, accumulated depreciation was
$90,004 and $90,004 at December 31, 2024 and 2023, respectively.
|
| Equity Investment Accounted for at Cost |
Equity
Investment Accounted for at Cost
Businesses
not accounted for under either the consolidation method or equity method of accounting are accounted for under equity investments
accounted for at cost and are further discussed in Note 4, “Equity Investments Accounted for at Cost.” The
Company’s share of the earnings and/or losses of equity investments accounted for at cost is not included in the Consolidated
Statements of Operations. Income from equity investments accounted for at cost is only realized if and when distributions are made
from the business to its investors. However, impairment charges related to businesses are recognized in the company’s
Consolidated Statements of Operations. If circumstances suggest that the value of an equity investment accounted for at cost with
respect to which an impairment charge has been made has subsequently recovered, that recovery is not recorded. The carrying values
of the company’s equity investments accounted for at cost are reflected in the line item “Equity investment –
Hupecol Meta, LLC” in the Company’s Consolidated Balance Sheets. As of December
31, 2024, the Company determined it was necessary to take an impairment charge of $6,392,874
for its investment in Hupecol Meta due to indications that its earnings performance has deteriorated, and the investment is no
longer viewed as viable. The Company determined that it is unlikely to receive any substantial amount of proceeds upon the sale of Hupecol
Meta, rendering the value of the investment fully impaired.
|
| Asset Retirement Obligations |
Asset
Retirement Obligations
For
the Company, asset retirement obligations (“ARO”) represent the systematic, monthly accretion and depreciation of future
abandonment costs of tangible assets such as platforms, wells, service assets, pipelines, and other facilities. The fair value of a liability
for an asset’s retirement obligation is recorded in the period in which it is incurred if a reasonable estimate of fair value can
be made, and that the corresponding cost is capitalized as part of the carrying amount of the related long-lived asset. The liability
is accreted to its then present value each period, and the capitalized cost is depreciated over the useful life of the related asset.
If the liability is settled for an amount other than the recorded amount, an adjustment is made to the full cost pool, with no gain or
loss recognized, unless the adjustment would significantly alter the relationship between capitalized costs and proved reserves. Although
the Company’s domestic policy with respect to ARO is to assign depleted wells to a salvager for the assumption of abandonment obligations
before the wells have reached their economic limits, the Company has estimated its future ARO obligation with respect to its domestic
operations. The ARO assets, which are carried on the balance sheet as part of the full cost pool, have been included in our amortization
base for the purposes of calculating depreciation, depletion and amortization expense. For the purposes of calculating the ceiling test,
the future cash outflows associated with settling the ARO liability have been included in the computation of the discounted present value
of estimated future net revenues. Asset retirement obligations are classified as Level 3 (unobservable inputs) fair value measurements.
|
| Income Taxes |
Income
Taxes
Deferred
income taxes are provided on a liability method whereby deferred tax assets and liabilities are established for the difference between
the financial reporting and income tax basis of assets and liabilities as well as operating loss and tax credit carry forwards. Deferred
tax assets are reduced by a valuation allowance when, in the opinion of management, it is more likely than not that some portion or all
of the deferred tax assets will not be realized. Deferred tax assets and liabilities are adjusted for the effects of changes in tax laws
and rates on the date of enactment.
|
| Uncertain Tax Positions |
Uncertain
Tax Positions
The
Company evaluates uncertain tax positions to recognize a tax benefit from an uncertain tax position only if it is more likely than not
that the tax position will be sustained on examination by the taxing authorities based on the technical merits of the position. Those
tax positions failing to qualify for initial recognition are recognized in the first interim period in which they meet the more likely
than not standard or are resolved through negotiation or litigation with the taxing authority, or upon expiration of the statute of limitations.
De-recognition of a tax position that was previously recognized occurs when an entity subsequently determines that a tax position no
longer meets the more likely than not threshold of being sustained.
The
Company is subject to ongoing tax exposures, examinations and assessments in various jurisdictions. Accordingly, the Company may incur
additional tax expense based upon the outcomes of such matters, including any interest or penalties. In addition, when applicable, the
Company will adjust tax expense to reflect the Company’s ongoing assessments of such matters, which require judgment and can materially
increase or decrease its effective rate as well as impact operating results. There were no liabilities recorded for uncertain tax positions
at December 31, 2024 and 2023.
|
| Stock-Based Compensation |
Stock-Based
Compensation
The
Company measures the cost of employee services received in exchange for stock and stock options based on the grant date fair value of
the awards. The Company determines the fair value of stock option grants using the Black-Scholes option pricing model. The Company determines
the fair value of shares of non-vested stock based on the last quoted price of our stock on the date of the share grant. The fair value
determined represents the cost for the award and is recognized over the vesting period during which an employee is required to provide
service in exchange for the award. As stock-based compensation expense is recognized based on awards ultimately expected to vest, the
Company reduces the expense for estimated forfeitures based on historical forfeiture rates. Previously recognized compensation costs
may be adjusted to reflect the actual forfeiture rate for the entire award at the end of the vesting period. Excess tax benefits, if
any, are recognized as an addition to paid-in capital.
|
| Concentration of Risk |
Concentration
of Risk
As
a non-operator oil and gas exploration and production company, and through its interest in a limited liability company (“Hupecol
Meta”) and concessions operated by Hupecol Meta in the South American country of Colombia, the Company is dependent on the personnel,
management and resources of the operators of its various properties to operate efficiently and effectively.
As
a non-operating joint interest owner, the Company has a right of investment refusal on specific projects and the right to examine and
contest its division of costs and revenues determined by the operator.
The
Company’s Permian Basin, Texas properties accounted for all of the Company’s oil and gas operations and substantially all
of its oil and gas investments reflected in its consolidated financial statements in 2024. In the event of a significant negative change
in operations or operating outlook pertaining to the Company’s Permian Basin properties, the Company may be forced to abandon or
suspend such operations, which abandonment or suspension could be materially harmful to the Company.
For
2024, the Company’s oil production from its mineral interests was sold to U.S. oil marketing companies based on the highest bid.
The gas production is sold to U.S. natural gas marketing companies based on the highest bid. No purchaser accounted for more than 10%
of our oil and gas sales.
The
Company reviews accounts receivable balances when circumstances indicate a balance may not be collectible. Based upon the Company’s
review, no allowance for uncollectible accounts was deemed necessary at December 31, 2024 and 2023, respectively.
|
| Recently Adopted Accounting Pronouncements |
Recently
Adopted Accounting Pronouncements
In
June 2016, the Financial Accounting Standards Board (“FASB”) issued ASU No. 2016-13, Financial Instruments – Credit
Losses (Topic 326): Measurement of Credit Losses of Financial Instruments, which was codified in Accounting Standards Codification (“ASC”)
326, Financial Instruments — Credit Losses (“ASC 326”). The standard changes the methodology for measuring credit losses
on financial instruments and the timing of when such losses are recorded. Because the Company is a smaller reporting company based on
the most recent determination as of November 15, 2019, ASC 326 became effective for the Company for fiscal years beginning after December
15, 2022. As such, the Company adopted ASC 326 effective January 1, 2023, utilizing the modified retrospective transition method. Upon
adoption, the Company updated its impairment model to utilize a forward-looking current expected credit losses (“CECL”) model
in place of the incurred loss methodology for financial instruments measured at amortized cost, primarily including its accounts receivable
and contract asset. In relation to available-for-sale (“AFS”) debt securities, the guidance eliminates the concept of “other-than-temporary”
impairment, and instead focuses on determining whether any impairment is a result of a credit loss or other factors.
In accordance with Accounting Standards Updates ASU 2016-13, Financial
Instruments-Credit Losses (Topic 326): Measurement of Credit Losses on Financial Instruments (“ASU 2016-13”),
the Company applies historic loss factors to its receivable portfolio segments that were not expected to be further impacted by current
economic developments, and additional economic conditions factor to portfolio segments anticipated to experience greater losses in the
current economic environment. Additionally, the Company continuously evaluates customers based on risk characteristics, such as historical
losses and current economic conditions. Due to the cyclical nature of the oil and gas industry, the Company often evaluates its customers’
estimated losses on a case-by-case basis. The Company did not record a provision for credit losses during the year ended December 31,
2024 or 2023. The adoption of
ASC 326 did not have a material impact on our unaudited condensed consolidated financial statements as of the adoption date.
In
November 2023, the FASB issued Accounting Standards Update (“ASU”) 2023-07 “Segment Reporting (Topic 280): Improvements
to Reportable Segment Disclosures”. The amendments in this ASU are intended to improve reportable segment disclosure requirements
primarily through enhanced disclosures about significant segment expenses. The Company adopted the update for year-end 2024,
but did not identify a material effect on its consolidated financial statements.
|
| Recently Issued Accounting Pronouncements |
Recently
Issued Accounting Pronouncements
In
December 2023, the FASB issued ASU 2023-09, Income Taxes (Topic 740): Improvements to Income Tax Disclosures, which requires disaggregated
information about a reporting entity’s effective tax rate reconciliation, as well as information related to income taxes paid to
enhance the transparency and decision usefulness of income tax disclosures. This ASU will be effective for the annual period ending December
31, 2025. The Company is currently evaluating the timing and impacts of adoption of this ASU.
|
| Subsequent Events |
Subsequent
Events
The
Company evaluated subsequent events for disclosure from December 31, 2024 through the date the consolidated financial statements were
issued. See Note 12.
|
| X |
- DefinitionCeiling Test [Policy Text Block]
| Name: |
HUSA_CeilingTestPolicyTextBlock |
| Namespace Prefix: |
HUSA_ |
| Data Type: |
dtr-types:textBlockItemType |
| Balance Type: |
na |
| Period Type: |
duration |
|
| X |
- DefinitionConcentration Of Risk [Policy Text Block]
| Name: |
HUSA_ConcentrationOfRiskPolicyTextBlock |
| Namespace Prefix: |
HUSA_ |
| Data Type: |
dtr-types:textBlockItemType |
| Balance Type: |
na |
| Period Type: |
duration |
|
| X |
- DefinitionCosts Excluded [Policy Text Block]
| Name: |
HUSA_CostsExcludedPolicyTextBlock |
| Namespace Prefix: |
HUSA_ |
| Data Type: |
dtr-types:textBlockItemType |
| Balance Type: |
na |
| Period Type: |
duration |
|
| X |
- DefinitionGeneral [Policy Text Block]
| Name: |
HUSA_GeneralPolicyTextBlock |
| Namespace Prefix: |
HUSA_ |
| Data Type: |
dtr-types:textBlockItemType |
| Balance Type: |
na |
| Period Type: |
duration |
|
| X |
- DefinitionLiquidity And Capital Requirements [Policy Text Block]
| Name: |
HUSA_LiquidityAndCapitalRequirementsPolicyTextBlock |
| Namespace Prefix: |
HUSA_ |
| Data Type: |
dtr-types:textBlockItemType |
| Balance Type: |
na |
| Period Type: |
duration |
|
| X |
- DefinitionRecently Adopted New Accounting Pronouncements Policy [Policy Text Block]
| Name: |
HUSA_RecentlyAdoptedNewAccountingPronouncementsPolicyPolicyTextBlock |
| Namespace Prefix: |
HUSA_ |
| Data Type: |
dtr-types:textBlockItemType |
| Balance Type: |
na |
| Period Type: |
duration |
|
| X |
- DefinitionDisclosure of accounting policy for legal obligation associated with retirement of long-lived asset that results from acquisition, construction, or development or from normal operation of long-lived asset. Excludes environmental remediation liability from improper or other-than-normal operation of long-lived asset, obligation arising in connection with leased property that meets definition of lease payments or variable lease payments and from plan to sell or otherwise dispose of a long-lived asset. Reference 1: http://www.xbrl.org/2003/role/disclosureRef
-Topic 410
-SubTopic 20
-Name Accounting Standards Codification
-Publisher FASB
-URI https://asc.fasb.org/410-20/tableOfContent
| Name: |
us-gaap_AssetRetirementObligationsPolicy |
| Namespace Prefix: |
us-gaap_ |
| Data Type: |
dtr-types:textBlockItemType |
| Balance Type: |
na |
| Period Type: |
duration |
|
| X |
- DefinitionDisclosure of accounting policy for cash and cash equivalents, including the policy for determining which items are treated as cash equivalents. Other information that may be disclosed includes (1) the nature of any restrictions on the entity's use of its cash and cash equivalents, (2) whether the entity's cash and cash equivalents are insured or expose the entity to credit risk, (3) the classification of any negative balance accounts (overdrafts), and (4) the carrying basis of cash equivalents (for example, at cost) and whether the carrying amount of cash equivalents approximates fair value. Reference 1: http://fasb.org/us-gaap/role/ref/legacyRef
-Name Accounting Standards Codification
-Topic 230
-SubTopic 10
-Section 50
-Paragraph 1
-Publisher FASB
-URI https://asc.fasb.org/1943274/2147482913/230-10-50-1
| Name: |
us-gaap_CashAndCashEquivalentsPolicyTextBlock |
| Namespace Prefix: |
us-gaap_ |
| Data Type: |
dtr-types:textBlockItemType |
| Balance Type: |
na |
| Period Type: |
duration |
|
| X |
- DefinitionDisclosure of accounting policy for credit risk. Reference 1: http://fasb.org/us-gaap/role/ref/legacyRef
-Name Accounting Standards Codification
-Topic 942
-SubTopic 825
-Section 50
-Paragraph 1
-Publisher FASB
-URI https://asc.fasb.org/1943274/2147478898/942-825-50-1
Reference 2: http://www.xbrl.org/2003/role/disclosureRef
-Name Accounting Standards Codification
-Section 50
-Paragraph 1
-Subparagraph (d)
-SubTopic 10
-Topic 275
-Publisher FASB
-URI https://asc.fasb.org/1943274/2147482861/275-10-50-1
| Name: |
us-gaap_ConcentrationRiskCreditRisk |
| Namespace Prefix: |
us-gaap_ |
| Data Type: |
dtr-types:textBlockItemType |
| Balance Type: |
na |
| Period Type: |
duration |
|
| X |
- DefinitionDisclosure of accounting policy regarding (1) the principles it follows in consolidating or combining the separate financial statements, including the principles followed in determining the inclusion or exclusion of subsidiaries or other entities in the consolidated or combined financial statements and (2) its treatment of interests (for example, common stock, a partnership interest or other means of exerting influence) in other entities, for example consolidation or use of the equity or cost methods of accounting. The accounting policy may also address the accounting treatment for intercompany accounts and transactions, noncontrolling interest, and the income statement treatment in consolidation for issuances of stock by a subsidiary. Reference 1: http://www.xbrl.org/2003/role/exampleRef
-Topic 235
-SubTopic 10
-Name Accounting Standards Codification
-Section 50
-Paragraph 4
-Subparagraph (a)
-Publisher FASB
-URI https://asc.fasb.org/1943274/2147483426/235-10-50-4
Reference 2: http://fasb.org/us-gaap/role/ref/legacyRef
-Name Accounting Standards Codification
-Topic 810
-SubTopic 10
-Section 50
-Paragraph 1
-Publisher FASB
-URI https://asc.fasb.org/1943274/2147481203/810-10-50-1
| Name: |
us-gaap_ConsolidationPolicyTextBlock |
| Namespace Prefix: |
us-gaap_ |
| Data Type: |
dtr-types:textBlockItemType |
| Balance Type: |
na |
| Period Type: |
duration |
|
| X |
- DefinitionDisclosure of accounting policy for computing basic and diluted earnings or loss per share for each class of common stock and participating security. Addresses all significant policy factors, including any antidilutive items that have been excluded from the computation and takes into account stock dividends, splits and reverse splits that occur after the balance sheet date of the latest reporting period but before the issuance of the financial statements. Reference 1: http://www.xbrl.org/2003/role/disclosureRef
-Topic 260
-SubTopic 10
-Name Accounting Standards Codification
-Section 50
-Paragraph 1
-Subparagraph (d)
-Publisher FASB
-URI https://asc.fasb.org/1943274/2147482662/260-10-50-1
Reference 2: http://fasb.org/us-gaap/role/ref/legacyRef
-Name Accounting Standards Codification
-Topic 260
-SubTopic 10
-Section 50
-Paragraph 1
-Subparagraph (c)
-Publisher FASB
-URI https://asc.fasb.org/1943274/2147482662/260-10-50-1
Reference 3: http://fasb.org/us-gaap/role/ref/legacyRef
-Name Accounting Standards Codification
-Topic 260
-SubTopic 10
-Section 50
-Paragraph 2
-Publisher FASB
-URI https://asc.fasb.org/1943274/2147482662/260-10-50-2
| Name: |
us-gaap_EarningsPerSharePolicyTextBlock |
| Namespace Prefix: |
us-gaap_ |
| Data Type: |
dtr-types:textBlockItemType |
| Balance Type: |
na |
| Period Type: |
duration |
|
| X |
- DefinitionDisclosure of accounting policy for income taxes, which may include its accounting policies for recognizing and measuring deferred tax assets and liabilities and related valuation allowances, recognizing investment tax credits, operating loss carryforwards, tax credit carryforwards, and other carryforwards, methodologies for determining its effective income tax rate and the characterization of interest and penalties in the financial statements. Reference 1: http://www.xbrl.org/2003/role/disclosureRef
-Topic 740
-SubTopic 10
-Name Accounting Standards Codification
-Section 50
-Paragraph 20
-Publisher FASB
-URI https://asc.fasb.org/1943274/2147482685/740-10-50-20
Reference 2: http://www.xbrl.org/2003/role/disclosureRef
-Topic 740
-SubTopic 10
-Name Accounting Standards Codification
-Section 50
-Paragraph 19
-Publisher FASB
-URI https://asc.fasb.org/1943274/2147482685/740-10-50-19
Reference 3: http://www.xbrl.org/2003/role/disclosureRef
-Topic 740
-SubTopic 10
-Name Accounting Standards Codification
-Section 45
-Paragraph 25
-Publisher FASB
-URI https://asc.fasb.org/1943274/2147482525/740-10-45-25
Reference 4: http://www.xbrl.org/2003/role/disclosureRef
-Topic 946
-SubTopic 10
-Name Accounting Standards Codification
-Section S99
-Paragraph 3
-Subparagraph (SX 210.6-03(h)(1))
-Publisher FASB
-URI https://asc.fasb.org/1943274/2147479886/946-10-S99-3
Reference 5: http://www.xbrl.org/2003/role/disclosureRef
-Topic 740
-SubTopic 10
-Name Accounting Standards Codification
-Section 50
-Paragraph 17
-Subparagraph (b)
-Publisher FASB
-URI https://asc.fasb.org/1943274/2147482685/740-10-50-17
Reference 6: http://www.xbrl.org/2003/role/disclosureRef
-Topic 740
-SubTopic 10
-Name Accounting Standards Codification
-Section 50
-Paragraph 9
-Publisher FASB
-URI https://asc.fasb.org/1943274/2147482685/740-10-50-9
Reference 7: http://www.xbrl.org/2003/role/disclosureRef
-Topic 740
-SubTopic 10
-Name Accounting Standards Codification
-Section 45
-Paragraph 28
-Publisher FASB
-URI https://asc.fasb.org/1943274/2147482525/740-10-45-28
Reference 8: http://www.xbrl.org/2003/role/disclosureRef
-Topic 220
-SubTopic 10
-Name Accounting Standards Codification
-Section 50
-Paragraph 1
-Publisher FASB
-URI https://asc.fasb.org/1943274/2147482765/220-10-50-1
| Name: |
us-gaap_IncomeTaxPolicyTextBlock |
| Namespace Prefix: |
us-gaap_ |
| Data Type: |
dtr-types:textBlockItemType |
| Balance Type: |
na |
| Period Type: |
duration |
|
| X |
- DefinitionDisclosure of accounting policy for investment in financial asset. Reference 1: http://www.xbrl.org/2003/role/disclosureRef
-Topic 944
-SubTopic 220
-Name Accounting Standards Codification
-Section S99
-Paragraph 1
-Subparagraph (SX 210.7-04(3)(b))
-Publisher FASB
-URI https://asc.fasb.org/1943274/2147477250/944-220-S99-1
Reference 2: http://www.xbrl.org/2003/role/disclosureRef
-Topic 946
-SubTopic 10
-Name Accounting Standards Codification
-Section S99
-Paragraph 3
-Subparagraph (SX 210.6-03(d))
-Publisher FASB
-URI https://asc.fasb.org/1943274/2147479886/946-10-S99-3
Reference 3: http://www.xbrl.org/2003/role/disclosureRef
-Topic 946
-SubTopic 10
-Name Accounting Standards Codification
-Section S99
-Paragraph 3
-Subparagraph (SX 210.6-03(f)(1))
-Publisher FASB
-URI https://asc.fasb.org/1943274/2147479886/946-10-S99-3
Reference 4: http://www.xbrl.org/2003/role/disclosureRef
-Topic 946
-SubTopic 10
-Name Accounting Standards Codification
-Section S99
-Paragraph 3
-Subparagraph (SX 210.6-03(f)(2))
-Publisher FASB
-URI https://asc.fasb.org/1943274/2147479886/946-10-S99-3
Reference 5: http://www.xbrl.org/2003/role/disclosureRef
-Topic 946
-SubTopic 10
-Name Accounting Standards Codification
-Section S99
-Paragraph 3
-Subparagraph (SX 210.6-03(f)(3))
-Publisher FASB
-URI https://asc.fasb.org/1943274/2147479886/946-10-S99-3
Reference 6: http://www.xbrl.org/2003/role/disclosureRef
-Topic 946
-SubTopic 320
-Name Accounting Standards Codification
-Section S99
-Paragraph 12
-Subparagraph (i)
-Publisher FASB
-URI https://asc.fasb.org/1943274/2147477271/946-320-S99-12
Reference 7: http://www.xbrl.org/2003/role/disclosureRef
-Topic 946
-SubTopic 320
-Name Accounting Standards Codification
-Section S99
-Paragraph 19
-Subparagraph (2)
-Publisher FASB
-URI https://asc.fasb.org/1943274/2147477271/946-320-S99-19
| Name: |
us-gaap_InvestmentPolicyTextBlock |
| Namespace Prefix: |
us-gaap_ |
| Data Type: |
dtr-types:textBlockItemType |
| Balance Type: |
na |
| Period Type: |
duration |
|
| X |
- DefinitionDisclosure of accounting policy for estimating the allowance for losses on loans and lease receivables. The disclosure may include (a) how the entity determines each element of the allowance, (b) which loans are evaluated individually and which loans are evaluated as a group, (c) how the entity determines both the allocated and unallocated portions of the allowance, (d) how the entity determines the loss factors applied to graded loans in order to develop a general allowance, and (e) what self-correcting mechanism the entity uses to reduce differences between estimated and actual losses. Reference 1: http://fasb.org/us-gaap/role/ref/legacyRef
-Name Accounting Standards Codification
-Topic 310
-SubTopic 10
-Section 50
-Paragraph 9
-Publisher FASB
-URI https://asc.fasb.org/1943274/2147481962/310-10-50-9
| Name: |
us-gaap_LoansAndLeasesReceivableAllowanceForLoanLossesPolicy |
| Namespace Prefix: |
us-gaap_ |
| Data Type: |
dtr-types:textBlockItemType |
| Balance Type: |
na |
| Period Type: |
duration |
|
| X |
- DefinitionDisclosure of accounting policy pertaining to new accounting pronouncements that may impact the entity's financial reporting. Includes, but is not limited to, quantification of the expected or actual impact.
| Name: |
us-gaap_NewAccountingPronouncementsPolicyPolicyTextBlock |
| Namespace Prefix: |
us-gaap_ |
| Data Type: |
dtr-types:textBlockItemType |
| Balance Type: |
na |
| Period Type: |
duration |
|
| X |
- DefinitionDisclosure of accounting policy for oil and gas property which may include the basis of such assets, depreciation methods used and estimated useful lives, the entity's capitalization policy, including its accounting treatment for costs incurred for repairs and maintenance activities, whether such asset balances include capitalized interest and the method by which such is calculated, how disposals of such assets are accounted for and how impairment of such assets is assessed and recognized. Reference 1: http://fasb.org/us-gaap/role/ref/legacyRef
-Name Accounting Standards Codification
-Section 50
-Paragraph 1
-SubTopic 10
-Topic 360
-Publisher FASB
-URI https://asc.fasb.org/1943274/2147482099/360-10-50-1
| Name: |
us-gaap_OilAndGasPropertiesPolicyPolicyTextBlock |
| Namespace Prefix: |
us-gaap_ |
| Data Type: |
dtr-types:textBlockItemType |
| Balance Type: |
na |
| Period Type: |
duration |
|
| X |
- References
+ Details
| Name: |
us-gaap_OrganizationConsolidationAndPresentationOfFinancialStatementsAbstract |
| Namespace Prefix: |
us-gaap_ |
| Data Type: |
xbrli:stringItemType |
| Balance Type: |
na |
| Period Type: |
duration |
|
| X |
- DefinitionDisclosure of accounting policy for long-lived, physical asset used in normal conduct of business and not intended for resale. Includes, but is not limited to, work of art, historical treasure, and similar asset classified as collections. Reference 1: http://fasb.org/us-gaap/role/ref/legacyRef
-Name Accounting Standards Codification
-Section 50
-Paragraph 1
-SubTopic 10
-Topic 360
-Publisher FASB
-URI https://asc.fasb.org/1943274/2147482099/360-10-50-1
Reference 2: http://www.xbrl.org/2003/role/disclosureRef
-Topic 944
-SubTopic 210
-Name Accounting Standards Codification
-Section S99
-Paragraph 1
-Subparagraph (SX 210.7-03(a)(8)(a))
-Publisher FASB
-URI https://asc.fasb.org/1943274/2147478777/944-210-S99-1
Reference 3: http://www.xbrl.org/2003/role/disclosureRef
-Name Accounting Standards Codification
-Section 50
-Paragraph 6
-SubTopic 360
-Topic 958
-Publisher FASB
-URI https://asc.fasb.org/1943274/2147477798/958-360-50-6
Reference 4: http://www.xbrl.org/2003/role/disclosureRef
-Name Accounting Standards Codification
-Section 50
-Paragraph 1
-Subparagraph (d)
-SubTopic 360
-Topic 958
-Publisher FASB
-URI https://asc.fasb.org/1943274/2147477798/958-360-50-1
| Name: |
us-gaap_PropertyPlantAndEquipmentPolicyTextBlock |
| Namespace Prefix: |
us-gaap_ |
| Data Type: |
dtr-types:textBlockItemType |
| Balance Type: |
na |
| Period Type: |
duration |
|
| X |
- DefinitionDisclosure of accounting policy for revenue from contract with customer. Reference 1: http://www.xbrl.org/2003/role/disclosureRef
-Topic 606
-SubTopic 10
-Name Accounting Standards Codification
-Section 50
-Paragraph 17
-Publisher FASB
-URI https://asc.fasb.org/1943274/2147479806/606-10-50-17
Reference 2: http://www.xbrl.org/2003/role/disclosureRef
-Topic 606
-SubTopic 10
-Name Accounting Standards Codification
-Section 50
-Paragraph 19
-Publisher FASB
-URI https://asc.fasb.org/1943274/2147479806/606-10-50-19
Reference 3: http://www.xbrl.org/2003/role/disclosureRef
-Topic 606
-SubTopic 10
-Name Accounting Standards Codification
-Section 50
-Paragraph 18
-Subparagraph (a)
-Publisher FASB
-URI https://asc.fasb.org/1943274/2147479806/606-10-50-18
Reference 4: http://www.xbrl.org/2003/role/disclosureRef
-Topic 606
-SubTopic 10
-Name Accounting Standards Codification
-Section 50
-Paragraph 18
-Subparagraph (b)
-Publisher FASB
-URI https://asc.fasb.org/1943274/2147479806/606-10-50-18
Reference 5: http://www.xbrl.org/2003/role/disclosureRef
-Topic 606
-SubTopic 10
-Name Accounting Standards Codification
-Section 50
-Paragraph 20
-Subparagraph (a)
-Publisher FASB
-URI https://asc.fasb.org/1943274/2147479806/606-10-50-20
Reference 6: http://www.xbrl.org/2003/role/disclosureRef
-Topic 606
-SubTopic 10
-Name Accounting Standards Codification
-Section 50
-Paragraph 20
-Subparagraph (b)
-Publisher FASB
-URI https://asc.fasb.org/1943274/2147479806/606-10-50-20
Reference 7: http://www.xbrl.org/2003/role/disclosureRef
-Topic 606
-SubTopic 10
-Name Accounting Standards Codification
-Section 50
-Paragraph 20
-Subparagraph (c)
-Publisher FASB
-URI https://asc.fasb.org/1943274/2147479806/606-10-50-20
Reference 8: http://www.xbrl.org/2003/role/disclosureRef
-Topic 606
-SubTopic 10
-Name Accounting Standards Codification
-Section 50
-Paragraph 20
-Subparagraph (d)
-Publisher FASB
-URI https://asc.fasb.org/1943274/2147479806/606-10-50-20
Reference 9: http://www.xbrl.org/2003/role/exampleRef
-Name Accounting Standards Codification
-Section 50
-Paragraph 4
-Subparagraph (e)
-SubTopic 10
-Topic 235
-Publisher FASB
-URI https://asc.fasb.org/1943274/2147483426/235-10-50-4
Reference 10: http://www.xbrl.org/2003/role/disclosureRef
-Name Accounting Standards Codification
-Topic 606
-Publisher FASB
-URI https://asc.fasb.org/606/tableOfContent
| Name: |
us-gaap_RevenueFromContractWithCustomerPolicyTextBlock |
| Namespace Prefix: |
us-gaap_ |
| Data Type: |
dtr-types:textBlockItemType |
| Balance Type: |
na |
| Period Type: |
duration |
|
| X |
- DefinitionDisclosure of accounting policy for award under share-based payment arrangement. Includes, but is not limited to, methodology and assumption used in measuring cost. Reference 1: http://www.xbrl.org/2003/role/disclosureRef
-Topic 718
-SubTopic 10
-Name Accounting Standards Codification
-Section 50
-Paragraph 2
-Subparagraph (f)(1)
-Publisher FASB
-URI https://asc.fasb.org/1943274/2147480429/718-10-50-2
Reference 2: http://www.xbrl.org/2003/role/disclosureRef
-Topic 718
-SubTopic 10
-Name Accounting Standards Codification
-Section 50
-Paragraph 2
-Subparagraph (f)(2)(i)
-Publisher FASB
-URI https://asc.fasb.org/1943274/2147480429/718-10-50-2
Reference 3: http://www.xbrl.org/2003/role/disclosureRef
-Topic 718
-SubTopic 10
-Name Accounting Standards Codification
-Section 50
-Paragraph 2
-Subparagraph (f)(2)(ii)
-Publisher FASB
-URI https://asc.fasb.org/1943274/2147480429/718-10-50-2
Reference 4: http://www.xbrl.org/2003/role/disclosureRef
-Topic 718
-SubTopic 10
-Name Accounting Standards Codification
-Section 50
-Paragraph 2
-Subparagraph (f)(2)(v)
-Publisher FASB
-URI https://asc.fasb.org/1943274/2147480429/718-10-50-2
Reference 5: http://www.xbrl.org/2003/role/disclosureRef
-Topic 718
-SubTopic 10
-Name Accounting Standards Codification
-Section S99
-Paragraph 1
-Subparagraph (SAB Topic 14.C.Q3)
-Publisher FASB
-URI https://asc.fasb.org/1943274/2147479830/718-10-S99-1
Reference 6: http://www.xbrl.org/2003/role/disclosureRef
-Topic 718
-SubTopic 10
-Name Accounting Standards Codification
-Section S99
-Paragraph 1
-Subparagraph (SAB Topic 14.D.1.Q5)
-Publisher FASB
-URI https://asc.fasb.org/1943274/2147479830/718-10-S99-1
Reference 7: http://www.xbrl.org/2003/role/disclosureRef
-Topic 718
-SubTopic 10
-Name Accounting Standards Codification
-Section S99
-Paragraph 1
-Subparagraph (SAB Topic 14.D.3.Q2)
-Publisher FASB
-URI https://asc.fasb.org/1943274/2147479830/718-10-S99-1
Reference 8: http://www.xbrl.org/2003/role/disclosureRef
-Topic 718
-SubTopic 10
-Name Accounting Standards Codification
-Section S99
-Paragraph 1
-Subparagraph (SAB Topic 14.D.2.Q6)
-Publisher FASB
-URI https://asc.fasb.org/1943274/2147479830/718-10-S99-1
Reference 9: http://www.xbrl.org/2003/role/disclosureRef
-Topic 718
-Name Accounting Standards Codification
-Publisher FASB
-URI https://asc.fasb.org/718/tableOfContent
Reference 10: http://www.xbrl.org/2003/role/disclosureRef
-Topic 718
-SubTopic 10
-Name Accounting Standards Codification
-Section 50
-Paragraph 2
-Subparagraph (b)
-Publisher FASB
-URI https://asc.fasb.org/1943274/2147480429/718-10-50-2
Reference 11: http://www.xbrl.org/2003/role/disclosureRef
-Topic 718
-SubTopic 10
-Name Accounting Standards Codification
-Section 50
-Paragraph 2
-Subparagraph (f)(2)
-Publisher FASB
-URI https://asc.fasb.org/1943274/2147480429/718-10-50-2
| Name: |
us-gaap_ShareBasedCompensationOptionAndIncentivePlansPolicy |
| Namespace Prefix: |
us-gaap_ |
| Data Type: |
dtr-types:textBlockItemType |
| Balance Type: |
na |
| Period Type: |
duration |
|
| X |
- DefinitionDisclosure of accounting policy for reporting subsequent events.
| Name: |
us-gaap_SubsequentEventsPolicyPolicyTextBlock |
| Namespace Prefix: |
us-gaap_ |
| Data Type: |
dtr-types:textBlockItemType |
| Balance Type: |
na |
| Period Type: |
duration |
|
| X |
- DefinitionDisclosure of accounting policy for accounts receivable. Reference 1: http://fasb.org/us-gaap/role/ref/otherTransitionRef
-Topic 310
-SubTopic 10
-Name Accounting Standards Codification
-Section 50
-Paragraph 6
-Publisher FASB
-URI https://asc.fasb.org/1943274/2147481962/310-10-50-6
Reference 2: http://www.xbrl.org/2009/role/commonPracticeRef
-Topic 310
-SubTopic 10
-Name Accounting Standards Codification
-Section 50
-Paragraph 2
-Subparagraph (d)
-Publisher FASB
-URI https://asc.fasb.org/1943274/2147481962/310-10-50-2
Reference 3: http://www.xbrl.org/2009/role/commonPracticeRef
-Topic 310
-SubTopic 10
-Name Accounting Standards Codification
-Section 50
-Paragraph 2
-Subparagraph (a)
-Publisher FASB
-URI https://asc.fasb.org/1943274/2147481962/310-10-50-2
Reference 4: http://www.xbrl.org/2009/role/commonPracticeRef
-Topic 310
-SubTopic 20
-Name Accounting Standards Codification
-Section 50
-Paragraph 1
-Publisher FASB
-URI https://asc.fasb.org/1943274/2147481569/310-20-50-1
Reference 5: http://fasb.org/us-gaap/role/ref/otherTransitionRef
-Topic 310
-SubTopic 10
-Name Accounting Standards Codification
-Section 50
-Paragraph 15
-Subparagraph (d)
-Publisher FASB
-URI https://asc.fasb.org/1943274/2147481962/310-10-50-15
Reference 6: http://fasb.org/us-gaap/role/ref/otherTransitionRef
-Topic 310
-SubTopic 10
-Name Accounting Standards Codification
-Section 50
-Paragraph 11B
-Subparagraph (b)
-Publisher FASB
-URI https://asc.fasb.org/1943274/2147481962/310-10-50-11B
| Name: |
us-gaap_TradeAndOtherAccountsReceivablePolicy |
| Namespace Prefix: |
us-gaap_ |
| Data Type: |
dtr-types:textBlockItemType |
| Balance Type: |
na |
| Period Type: |
duration |
|
| X |
- DefinitionDisclosure of accounting policy for the use of estimates in the preparation of financial statements in conformity with generally accepted accounting principles. Reference 1: http://fasb.org/us-gaap/role/ref/legacyRef
-Name Accounting Standards Codification
-Topic 275
-SubTopic 10
-Section 50
-Paragraph 9
-Publisher FASB
-URI https://asc.fasb.org/1943274/2147482861/275-10-50-9
Reference 2: http://fasb.org/us-gaap/role/ref/legacyRef
-Name Accounting Standards Codification
-Topic 275
-SubTopic 10
-Section 50
-Paragraph 4
-Publisher FASB
-URI https://asc.fasb.org/1943274/2147482861/275-10-50-4
Reference 3: http://www.xbrl.org/2003/role/disclosureRef
-Name Accounting Standards Codification
-Section 50
-Paragraph 1
-Subparagraph (b)
-SubTopic 10
-Topic 275
-Publisher FASB
-URI https://asc.fasb.org/1943274/2147482861/275-10-50-1
Reference 4: http://www.xbrl.org/2003/role/disclosureRef
-Name Accounting Standards Codification
-Section 50
-Paragraph 1
-Subparagraph (c)
-SubTopic 10
-Topic 275
-Publisher FASB
-URI https://asc.fasb.org/1943274/2147482861/275-10-50-1
Reference 5: http://www.xbrl.org/2003/role/disclosureRef
-Name Accounting Standards Codification
-Section 50
-Paragraph 11
-SubTopic 10
-Topic 275
-Publisher FASB
-URI https://asc.fasb.org/1943274/2147482861/275-10-50-11
Reference 6: http://www.xbrl.org/2003/role/disclosureRef
-Name Accounting Standards Codification
-Section 50
-Paragraph 12
-SubTopic 10
-Topic 275
-Publisher FASB
-URI https://asc.fasb.org/1943274/2147482861/275-10-50-12
Reference 7: http://fasb.org/us-gaap/role/ref/legacyRef
-Name Accounting Standards Codification
-Topic 275
-SubTopic 10
-Section 50
-Paragraph 8
-Publisher FASB
-URI https://asc.fasb.org/1943274/2147482861/275-10-50-8
| Name: |
us-gaap_UseOfEstimates |
| Namespace Prefix: |
us-gaap_ |
| Data Type: |
dtr-types:textBlockItemType |
| Balance Type: |
na |
| Period Type: |
duration |
|
v3.25.0.1
NATURE OF COMPANY AND SUMMARY OF SIGNIFICANT ACCOUNTING POLICIES (Tables)
|
12 Months Ended |
Dec. 31, 2024 |
|---|
| Organization, Consolidation and Presentation of Financial Statements [Abstract] |
|
| SCHEDULE OF COMPUTATION OF DILUTED NET LOSS PER SHARE |
For
the years ended December 31, 2024 and 2023, the following warrants and options to purchase shares of common stock were excluded from
the computation of diluted net loss per share, as the inclusion of such shares would be anti-dilutive:
SCHEDULE OF COMPUTATION OF DILUTED NET LOSS PER SHARE
| | |
Year Ended December 31, | |
| | |
2024 | | |
2023 | |
| Stock warrants | |
| 94,400 | | |
| 94,400 | |
| Stock options | |
| 916,987 | | |
| 1,000,807 | |
| Totals | |
| 1,011,387 | | |
| 1,095,207 | |
|
| X |
- References
+ Details
| Name: |
us-gaap_OrganizationConsolidationAndPresentationOfFinancialStatementsAbstract |
| Namespace Prefix: |
us-gaap_ |
| Data Type: |
xbrli:stringItemType |
| Balance Type: |
na |
| Period Type: |
duration |
|
| X |
- DefinitionTabular disclosure of securities (including those issuable pursuant to contingent stock agreements) that could potentially dilute basic earnings per share (EPS) in the future that were not included in the computation of diluted EPS because to do so would increase EPS amounts or decrease loss per share amounts for the period presented, by antidilutive securities. Reference 1: http://fasb.org/us-gaap/role/ref/legacyRef
-Name Accounting Standards Codification
-Topic 260
-SubTopic 10
-Section 50
-Paragraph 1
-Subparagraph (c)
-Publisher FASB
-URI https://asc.fasb.org/1943274/2147482662/260-10-50-1
| Name: |
us-gaap_ScheduleOfAntidilutiveSecuritiesExcludedFromComputationOfEarningsPerShareTextBlock |
| Namespace Prefix: |
us-gaap_ |
| Data Type: |
dtr-types:textBlockItemType |
| Balance Type: |
na |
| Period Type: |
duration |
|
v3.25.0.1
REVENUE FROM CONTRACTS WITH CUSTOMERS (Tables)
|
12 Months Ended |
Dec. 31, 2024 |
|---|
| Revenue from Contract with Customer [Abstract] |
|
| SCHEDULE OF DISAGGREGATES REVENUE BY SIGNIFICANT PRODUCT |
The
following table disaggregates revenue by significant product type for the years ended December 31, 2024 and 2023:
SCHEDULE OF DISAGGREGATES REVENUE BY SIGNIFICANT PRODUCT
| | |
2024 | | |
2023 | |
| | |
Year Ended December 31, | |
| | |
2024 | | |
2023 | |
| Oil sales | |
$ | 437,900 | | |
$ | 590,486 | |
| Natural gas sales | |
| 8,869 | | |
| 79,443 | |
| Natural gas liquids sales | |
| 113,411 | | |
| 124,098 | |
| Total revenue from customers | |
$ | 560,180 | | |
$ | 794,027 | |
|
| X |
- DefinitionTabular disclosure of disaggregation of revenue into categories depicting how nature, amount, timing, and uncertainty of revenue and cash flows are affected by economic factor. Reference 1: http://www.xbrl.org/2009/role/commonPracticeRef
-Topic 606
-SubTopic 10
-Name Accounting Standards Codification
-Section 50
-Paragraph 5
-Publisher FASB
-URI https://asc.fasb.org/1943274/2147479806/606-10-50-5
| Name: |
us-gaap_DisaggregationOfRevenueTableTextBlock |
| Namespace Prefix: |
us-gaap_ |
| Data Type: |
dtr-types:textBlockItemType |
| Balance Type: |
na |
| Period Type: |
duration |
|
| X |
- References
+ Details
| Name: |
us-gaap_RevenueFromContractWithCustomerAbstract |
| Namespace Prefix: |
us-gaap_ |
| Data Type: |
xbrli:stringItemType |
| Balance Type: |
na |
| Period Type: |
duration |
|
v3.25.0.1
OIL AND GAS PROPERTIES (Tables)
|
12 Months Ended |
Dec. 31, 2024 |
|---|
| Extractive Industries [Abstract] |
|
| SCHEDULE OF EVALUATED OIL AND GAS PROPERTIES SUBJECT TO AMORTIZATION |
Evaluated
oil and gas properties subject to amortization at December 31, 2024 included the following:
SCHEDULE OF EVALUATED OIL AND GAS PROPERTIES SUBJECT TO AMORTIZATION
| | |
United States | | |
South America | | |
Total | |
| | |
| | |
| | |
| |
| Evaluated properties being amortized | |
$ | 13,326,003 | | |
$ | 49,444,654 | | |
$ | 62,770,657 | |
| Accumulated depreciation, depletion, amortization and impairment | |
| (12,208,367 | ) | |
| (49,444,654 | ) | |
| (61,653,021 | ) |
| Net capitalized costs | |
$ | 1,117,636 | | |
$ | — | | |
$ | 1,117,636 | |
Evaluated
oil and gas properties subject to amortization at December 31, 2023 included the following:
| | |
United States | | |
South America | | |
Total | |
| | |
| | |
| | |
| |
| Evaluated properties being amortized | |
$ | 13,321,907 | | |
$ | 49,444,654 | | |
$ | 62,766,561 | |
| Accumulated depreciation, depletion, amortization and impairment | |
| (11,762,288 | ) | |
| (49,444,654 | ) | |
| (61,206,942 | ) |
| Net capitalized costs | |
$ | 1,559,619 | | |
$ | — | | |
$ | 1,559,619 | |
|
| X |
- DefinitionSchedule Of Proved Properties [Table Text Block]
| Name: |
HUSA_ScheduleOfProvedPropertiesTableTextBlock |
| Namespace Prefix: |
HUSA_ |
| Data Type: |
dtr-types:textBlockItemType |
| Balance Type: |
na |
| Period Type: |
duration |
|
v3.25.0.1
ASSET RETIREMENT OBLIGATIONS (Tables)
|
12 Months Ended |
Dec. 31, 2024 |
|---|
| Asset Retirement Obligation Disclosure [Abstract] |
|
| SCHEDULE OF CHANGES IN OUR ASSET RETIREMENT LIABILITY |
The
following table presents changes in our asset retirement liability (“ARO”) during each of the years ended December 31, 2024
and 2023.
SCHEDULE OF CHANGES IN OUR ASSET RETIREMENT LIABILITY
| | |
2024 | | |
2023 | |
| | |
| | |
| |
| ARO liability at January 1 | |
$ | 63,084 | | |
$ | 72,789 | |
| Additions from new drilling | |
| — | | |
| — | |
| Liabilities settled | |
| — | | |
| (2,706 | ) |
| Changes in estimates | |
| (5,904 | ) | |
| (9,706 | ) |
| Accretion expense | |
| — | | |
| 2,707 | |
| | |
| | | |
| | |
| ARO liability at December 31 | |
$ | 57,180 | | |
$ | 63,084 | |
|
| X |
- References
+ Details
| Name: |
us-gaap_AssetRetirementObligationDisclosureAbstract |
| Namespace Prefix: |
us-gaap_ |
| Data Type: |
xbrli:stringItemType |
| Balance Type: |
na |
| Period Type: |
duration |
|
| X |
- DefinitionTabular disclosure of the changes in carrying amount of a liability for asset retirement obligations, for changes such as new obligations, changes in estimates of existing obligations, spending on existing obligations, property dispositions, and foreign currency translation. Reference 1: http://www.xbrl.org/2009/role/commonPracticeRef
-Topic 410
-SubTopic 20
-Name Accounting Standards Codification
-Section 50
-Paragraph 1
-Subparagraph (c)
-Publisher FASB
-URI https://asc.fasb.org/1943274/2147481850/410-20-50-1
| Name: |
us-gaap_ScheduleOfChangeInAssetRetirementObligationTableTextBlock |
| Namespace Prefix: |
us-gaap_ |
| Data Type: |
dtr-types:textBlockItemType |
| Balance Type: |
na |
| Period Type: |
duration |
|
v3.25.0.1
STOCK-BASED COMPENSATION (Tables)
|
12 Months Ended |
Dec. 31, 2024 |
|---|
| Share-Based Payment Arrangement [Abstract] |
|
| SUMMARY OF STOCK OPTION ACTIVITY |
Option
activity during 2024 and 2023 was as follows:
SUMMARY OF STOCK OPTION ACTIVITY
| | |
Options | | |
Weighted Average Exercise Price | | |
Weighted Average Remaining Contractual
Term (in Years) | | |
Aggregate Intrinsic Value | |
| | |
| | |
| | |
| | |
| |
| Outstanding at December 31, 2022 | |
| 944,177 | | |
$ | 2.08 | | |
| | | |
| | |
| Granted | |
| 60,000 | | |
$ | 2.09 | | |
| | | |
| | |
| Exercised | |
| — | | |
$ | 3.84 | | |
| | | |
| | |
| Forfeited | |
| (3,370 | ) | |
$ | 20.43 | | |
| | | |
| | |
| | |
| | | |
| | | |
| | | |
| | |
| Outstanding at December 31, 2023 | |
| 1,000,807 | | |
| 2.46 | | |
| | | |
| | |
| Granted | |
| 82,320 | | |
| 1.08 | | |
| | | |
| | |
| Exercised | |
| — | | |
| | | |
| | | |
| | |
| Expired | |
| (166,140 | ) | |
| 3.87 | | |
| | | |
| | |
| | |
| | | |
| | | |
| | | |
| | |
| Outstanding at December 31, 2024 | |
| 916,987 | | |
$ | 2.06 | | |
| 6.10 | | |
$ | 16,956 | |
| Exercisable at December 31, 2024 | |
| 851,131 | | |
$ | 2.13 | | |
| 5.86 | | |
$ | 16,956 | |
|
| SCHEDULE OF STOCK-BASED COMPENSATION |
The
following table reflects stock-based compensation recorded by the Company for 2024 and 2023:
SCHEDULE OF STOCK-BASED COMPENSATION
| | |
2024 | | |
2023 | |
| | |
| | |
| |
| Stock-based compensation expense from stock options and common stock included in general and administrative expense | |
$ | 101,508 | | |
$ | 238,314 | |
| Earnings per share effect of stock-based compensation expense | |
$ | (0.01 | ) | |
$ | (0.02 | ) |
|
| X |
- DefinitionTabular disclosure of allocation of amount expensed and capitalized for award under share-based payment arrangement to statement of income or comprehensive income and statement of financial position. Includes, but is not limited to, corresponding line item in financial statement. Reference 1: http://fasb.org/us-gaap/role/ref/legacyRef
-Name Accounting Standards Codification
-Topic 718
-SubTopic 10
-Section 50
-Paragraph 2
-Subparagraph (h)(1)
-Publisher FASB
-URI https://asc.fasb.org/1943274/2147480429/718-10-50-2
| Name: |
us-gaap_ScheduleOfEmployeeServiceShareBasedCompensationAllocationOfRecognizedPeriodCostsTextBlock |
| Namespace Prefix: |
us-gaap_ |
| Data Type: |
dtr-types:textBlockItemType |
| Balance Type: |
na |
| Period Type: |
duration |
|
| X |
- DefinitionTabular disclosure for stock option plans. Includes, but is not limited to, outstanding awards at beginning and end of year, grants, exercises, forfeitures, and weighted-average grant date fair value. Reference 1: http://fasb.org/us-gaap/role/ref/legacyRef
-Topic 718
-SubTopic 10
-Name Accounting Standards Codification
-Section 50
-Paragraph 2
-Subparagraph (c)(1)
-Publisher FASB
-URI https://asc.fasb.org/1943274/2147480429/718-10-50-2
Reference 2: http://fasb.org/us-gaap/role/ref/legacyRef
-Name Accounting Standards Codification
-Section 50
-Paragraph 2
-Subparagraph (d)
-SubTopic 10
-Topic 718
-Publisher FASB
-URI https://asc.fasb.org/1943274/2147480429/718-10-50-2
Reference 3: http://fasb.org/us-gaap/role/ref/legacyRef
-Name Accounting Standards Codification
-Section 50
-Paragraph 2
-Subparagraph (e)
-SubTopic 10
-Topic 718
-Publisher FASB
-URI https://asc.fasb.org/1943274/2147480429/718-10-50-2
| Name: |
us-gaap_ScheduleOfShareBasedCompensationStockOptionsActivityTableTextBlock |
| Namespace Prefix: |
us-gaap_ |
| Data Type: |
dtr-types:textBlockItemType |
| Balance Type: |
na |
| Period Type: |
duration |
|
v3.25.0.1
CAPITAL STOCK (Tables)
|
12 Months Ended |
Dec. 31, 2024 |
|---|
| Equity [Abstract] |
|
| SUMMARY OF WARRANT ACTIVITY |
A
summary of warrant activity and related information for 2024 and 2023 is presented below:
SUMMARY OF WARRANT ACTIVITY
| | |
Warrants | | |
Weighted-Average
Exercise Price | | |
Aggregate
Intrinsic Value | |
| | |
| | |
| | |
| |
| Outstanding at December 31, 2022 | |
| 94,400 | | |
$ | 2.50 | | |
| | |
| Issued | |
| — | | |
| — | | |
| | |
| Exercised | |
| — | | |
| — | | |
| | |
| Expired | |
| — | | |
$ | — | | |
| | |
| Outstanding at December 31, 2023 | |
| 94,400 | | |
$ | 2.50 | | |
| | |
| Issued | |
| — | | |
| — | | |
| | |
| Exercised | |
| — | | |
| — | | |
| | |
| Expired | |
| — | | |
| — | | |
| | |
| Outstanding at December 31, 2024 | |
| 94,400 | | |
$ | 2.50 | | |
$ | — | |
| Exercisable at December 31, 2024 | |
| 94,400 | | |
$ | 2.50 | | |
$ | — | |
|
| X |
- References
+ Details
| Name: |
us-gaap_EquityAbstract |
| Namespace Prefix: |
us-gaap_ |
| Data Type: |
xbrli:stringItemType |
| Balance Type: |
na |
| Period Type: |
duration |
|
| X |
- DefinitionTabular disclosure of warrants or rights issued. Warrants and rights outstanding are derivative securities that give the holder the right to purchase securities (usually equity) from the issuer at a specific price within a certain time frame. Warrants are often included in a new debt issue to entice investors by a higher return potential. The main difference between warrants and call options is that warrants are issued and guaranteed by the company, whereas options are exchange instruments and are not issued by the company. Also, the lifetime of a warrant is often measured in years, while the lifetime of a typical option is measured in months. Disclose the title of issue of securities called for by warrants and rights outstanding, the aggregate amount of securities called for by warrants and rights outstanding, the date from which the warrants or rights are exercisable, and the price at which the warrant or right is exercisable. Reference 1: http://fasb.org/us-gaap/role/ref/legacyRef
-Name Accounting Standards Codification
-Topic 718
-SubTopic 10
-Section 50
-Paragraph 1
-Subparagraph (a)
-Publisher FASB
-URI https://asc.fasb.org/1943274/2147480429/718-10-50-1
| Name: |
us-gaap_ScheduleOfStockholdersEquityNoteWarrantsOrRightsTextBlock |
| Namespace Prefix: |
us-gaap_ |
| Data Type: |
dtr-types:textBlockItemType |
| Balance Type: |
na |
| Period Type: |
duration |
|
v3.25.0.1
TAXES (Tables)
|
12 Months Ended |
Dec. 31, 2024 |
|---|
| Income Tax Disclosure [Abstract] |
|
| SCHEDULE OF RECONCILIATION OF STATUTORY FEDERAL INCOME TAX |
The
following table sets forth a reconciliation of the statutory federal income tax for the years ended December 31, 2024 and 2023.
SCHEDULE
OF RECONCILIATION OF STATUTORY FEDERAL INCOME TAX
| | |
2024 | | |
2023 | |
| | |
| | |
| |
| | |
| | | |
| | |
| Income tax expense (benefit) computed at statutory rates | |
$ | (1,725,727 | ) | |
$ | (674,368 | ) |
| Permanent differences, nondeductible expenses | |
| 28 | | |
| 9 | |
| Increase (decrease) in valuation allowance | |
| 1,807,535 | | |
| 710,336 | ) |
| Expiration of options | |
| 32,060 | | |
| — | |
| RTA True-Ups | |
| (227,729 | ) | |
| (10,919 | ) |
| Deferred True-Up | |
| 113,833 | | |
| (25,088 | ) |
| Tax provision | |
$ | — | | |
$ | — | |
| | |
| | | |
| | |
| Total provision | |
| | | |
| | |
| Foreign | |
$ | — | | |
$ | — | |
| Total provision (benefit) | |
$ | — | | |
$ | — | |
|
| SIGNIFICANT COMPONENTS OF DEFERRED TAX ASSET AND LIABILITY |
SIGNIFICANT
COMPONENTS OF DEFERRED TAX ASSET AND LIABILITY
| | |
2024 | | |
2023 | |
| Non-Current Deferred tax assets: | |
| | | |
| | |
| Net operating loss carry forward | |
| 12,729,620 | | |
$ | 12,355,137 | |
| Foreign tax credit carry forward | |
| 18,865 | | |
| 18,865 | |
| Deferred state tax | |
| — | | |
| — | |
| Stock compensation | |
| 460,368 | | |
| 470,816 | |
| Book in excess of tax depreciation, depletion and capitalization methods on oil and gas properties | |
| 1,497,253 | | |
| 53,720 | |
| Other | |
| — | | |
| — | |
| ASC 842 lease standard – building lease | |
| 248 | | |
| 281 | |
| Pass-through investment | |
| — | | |
| — | |
| Total Non-Current Deferred tax assets | |
| 14,706,354 | | |
| 12,898,819 | |
| Valuation Allowance | |
| (14,706,354 | ) | |
| (12,898,819 | ) |
| Net deferred tax asset | |
| — | | |
$ | — | |
|
| X |
- DefinitionTabular disclosure of the components of net deferred tax asset or liability recognized in an entity's statement of financial position, including the following: the total of all deferred tax liabilities, the total of all deferred tax assets, the total valuation allowance recognized for deferred tax assets. Reference 1: http://www.xbrl.org/2009/role/commonPracticeRef
-Topic 740
-SubTopic 10
-Name Accounting Standards Codification
-Section 50
-Paragraph 2
-Publisher FASB
-URI https://asc.fasb.org/1943274/2147482685/740-10-50-2
| Name: |
us-gaap_ScheduleOfDeferredTaxAssetsAndLiabilitiesTableTextBlock |
| Namespace Prefix: |
us-gaap_ |
| Data Type: |
dtr-types:textBlockItemType |
| Balance Type: |
na |
| Period Type: |
duration |
|
| X |
- DefinitionTabular disclosure of the reconciliation using percentage or dollar amounts of the reported amount of income tax expense attributable to continuing operations for the year to the amount of income tax expense that would result from applying domestic federal statutory tax rates to pretax income from continuing operations. Reference 1: http://www.xbrl.org/2003/role/exampleRef
-Topic 740
-SubTopic 10
-Name Accounting Standards Codification
-Section 55
-Paragraph 231
-Publisher FASB
-URI https://asc.fasb.org/1943274/2147482663/740-10-55-231
Reference 2: http://www.xbrl.org/2003/role/disclosureRef
-Topic 740
-SubTopic 10
-Name Accounting Standards Codification
-Section 50
-Paragraph 12A
-Publisher FASB
-URI https://asc.fasb.org/1943274/2147482685/740-10-50-12A
Reference 3: http://www.xbrl.org/2009/role/commonPracticeRef
-Topic 740
-SubTopic 10
-Name Accounting Standards Codification
-Section 50
-Paragraph 12
-Publisher FASB
-URI https://asc.fasb.org/1943274/2147482685/740-10-50-12
| Name: |
us-gaap_ScheduleOfEffectiveIncomeTaxRateReconciliationTableTextBlock |
| Namespace Prefix: |
us-gaap_ |
| Data Type: |
dtr-types:textBlockItemType |
| Balance Type: |
na |
| Period Type: |
duration |
|
v3.25.0.1
| X |
- References
+ Details
| Name: |
us-gaap_CommitmentsAndContingenciesDisclosureAbstract |
| Namespace Prefix: |
us-gaap_ |
| Data Type: |
xbrli:stringItemType |
| Balance Type: |
na |
| Period Type: |
duration |
|
| X |
- DefinitionTabular disclosure of undiscounted cash flows of lessee's operating lease liability. Includes, but is not limited to, reconciliation of undiscounted cash flows to operating lease liability recognized in statement of financial position. Reference 1: http://www.xbrl.org/2009/role/commonPracticeRef
-Topic 842
-SubTopic 20
-Name Accounting Standards Codification
-Section 50
-Paragraph 6
-Publisher FASB
-URI https://asc.fasb.org/1943274/2147478964/842-20-50-6
| Name: |
us-gaap_LesseeOperatingLeaseLiabilityMaturityTableTextBlock |
| Namespace Prefix: |
us-gaap_ |
| Data Type: |
dtr-types:textBlockItemType |
| Balance Type: |
na |
| Period Type: |
duration |
|
v3.25.0.1
SUPPLEMENTAL INFORMATION ON OIL AND GAS EXPLORATION, DEVELOPMENT AND PRODUCTION ACTIVITIES (UNAUDITED) (Tables)
|
12 Months Ended |
Dec. 31, 2024 |
|---|
| Extractive Industries [Abstract] |
|
| SCHEDULE OF OIL AND GAS REVENUES AND LEASE OPERATING EXPENSES |
The
following table shows the Company’s oil and gas revenues and lease operating expenses, which excludes the joint venture expenses
incurred in South America, by geographic area:
SCHEDULE
OF OIL AND GAS REVENUES AND LEASE OPERATING EXPENSES
| | |
2024
| | |
2023
| |
| Revenues | |
| | | |
| | |
| North America | |
$ | 560,180 | | |
$ | 794,027 | |
| South America | |
| — | | |
| — | |
| | |
$ | 560,180 | | |
$ | 794,027 | |
| | |
| | | |
| | |
| Production Cost | |
| | | |
| | |
| North America | |
$ | 747,559 | | |
$ | 473,925 | |
| South America | |
| — | | |
| — | |
| | |
$ | 747,559 | | |
$ | 473,925 | |
|
| CAPITALIZED COSTS AND ACCUMULATED DEPLETION RELATING TO OIL AND GAS PRODUCTION ACTIVITIES |
Capitalized
costs and accumulated depletion relating to the Company’s oil and gas producing activities as of December 31, 2024, all of which
are onshore properties located in the United States and Colombia, South America are summarized below:
CAPITALIZED
COSTS AND ACCUMULATED DEPLETION RELATING TO OIL AND GAS PRODUCTION ACTIVITIES
| | |
United States | | |
South America | | |
Total | |
| Unproved properties not being amortized | |
$ | — | | |
$ | — | | |
$ | — | |
| Proved properties being amortized | |
| 13,326,003 | | |
| 49,444,654 | | |
| 62,770,657 | |
| Accumulated depreciation, depletion, amortization and impairment | |
| (12,208,367 | ) | |
| (49,444,654 | ) | |
| (61,653,021 | ) |
| | |
| | | |
| | | |
| | |
| Net capitalized costs | |
$ | 1,117,636 | | |
$ | — | | |
$ | 1,117,636 | |
|
| SCHEDULE OF PROVED DEVELOPED AND UNDEVELOPED RESERVES BY PRODUCT TYPE |
Total
estimated proved developed, proved non-producing, and undeveloped reserves by product type and the changes therein are set forth below for the years indicated.
SCHEDULE OF PROVED DEVELOPED AND
UNDEVELOPED RESERVES BY PRODUCT TYPE
| | |
United States | |
| | |
Gas (mcf) | | |
Oil (bbls) | | |
Natural Gas Liquids (gallons) |
|
| Total proved reserves | |
| | | |
| | | |
| |
|
| | |
| | | |
| | | |
| |
|
| Balance December 31, 2022 | |
| 1,030,420 | | |
| 83,517 | | |
| — |
|
| | |
| | | |
| | | |
| |
|
| Revisions of prior estimates | |
| (365,414 | ) | |
| (16,947 | ) | |
| — |
|
| Production | |
| (57,360 | ) | |
| (7,719 | ) | |
| — |
|
| | |
| | | |
| | | |
| |
|
| Balance December 31, 2023 | |
| 607,646 | | |
| 58,599 | | |
| — |
|
| | |
| | | |
| | | |
| |
|
| Extensions and discoveries |
|
|
78,980 |
|
|
|
17,000 |
|
|
|
502,614 |
|
| Revisions to prior estimates | |
| (214,960 | ) | |
| (23,217 | ) | |
| 1,119,316 |
|
| Production | |
| (53,476 | ) | |
| (5,992 | ) | |
| (159,680 |
) |
| | |
| | | |
| | | |
| |
|
| Balance December 31, 2024 | |
| 418,190 | | |
| 46,390 | | |
| 1,462,250 |
|
| | |
| | | |
| | | |
| |
|
| Proved developed reserves | |
| | | |
| | | |
| |
|
| at December 31, 2023 | |
| 607,646 | | |
| 58,599 | | |
| 1,621,930 |
|
| at December 31, 2024 | |
| 418,190 | | |
| 46,390 | | |
| 1,462,250 |
|
| | |
| | | |
| | | |
| |
|
| Proved undeveloped reserves | |
| | | |
| | | |
| |
|
| at December 31, 2023 | |
| — | | |
| — | | |
| — |
|
| at December 31, 2024 | |
| — | | |
| — | | |
| — |
|
|
| STANDARDIZED MEASURE OF DISCOUNTED FUTURE NET CASH FLOWS |
Standardized
measure of discounted future net cash flows at December 31, 2024:
STANDARDIZED
MEASURE OF DISCOUNTED FUTURE NET CASH FLOWS
| | |
United
States | | |
South
America | | |
Total | |
| Future cash flows from sales of oil and gas | |
$ | 4,427,982 | | |
| — | | |
| 4,427,982 | |
| Future production cost | |
| (2,400,990 | ) | |
| — | | |
| (2,400,990 | ) |
| Future development cost | |
| (155,628 | ) | |
| — | | |
| 155,628 | |
| Future net cash flows | |
| 1,871,364 | | |
| — | | |
| 1,871,364 | |
| 10% annual discount for timing of cash flow | |
| (748,094 | ) | |
| — | | |
| (748,094 | ) |
| | |
| | | |
| | | |
| | |
| Standardized measure of discounted future net cash flow relating to proved oil and gas reserves | |
$ | 1,123,270 | | |
| — | | |
| 1,123,270 | |
| | |
| | | |
| | | |
| | |
| Changes in standardized measure: | |
| | | |
| | | |
| | |
| Change due to current year operations Sales, net of production costs | |
$ | 39,359 | ) | |
| — | | |
| 39,359 | |
| Sales, net of production costs | |
$ | 39,359 | ) | |
| — | | |
| 39,359 | ) |
| Change due to revisions in standardized variables: | |
| — | | |
| | | |
| — | |
| Accretion of discount | |
| 156,472 | | |
| — | | |
| 156,472 | |
| Net change in sales and transfer price, net of production costs | |
| (1,433,013 | ) | |
| — | | |
| (1,433,013 | ) |
| Net change in future development cost | |
| — | | |
| — | | |
| — | |
| Discoveries | |
| 585,420 | | |
| — | | |
| 585,420 | |
| Revision and others | |
| (33,056 | ) | |
| — | | |
| (33,056 | ) |
| Changes in production rates and other | |
| 243,364 | | |
| — | | |
| 243,364 | |
| | |
| | | |
| | | |
| | |
| Net | |
| (441,454 | ) | |
| — | | |
| (441,454 | ) |
| Beginning of year | |
| 1,564,724 | | |
| — | | |
| 1,564,724 | |
| End of year | |
$ | 1,123,270 | | |
| — | | |
| 1,123,270 | |
Standardized
measure of discounted future net cash flows at December 31, 2023:
| | |
United
States | | |
South
America | | |
Total | |
| Future cash flows from sales of oil and gas | |
$ | 6,509,498 | | |
$ | — | | |
$ | 6,509,498 | |
| Future production cost | |
| (3,804,439 | ) | |
| — | | |
| (3,804,439 | ) |
| Future development cost | |
| — | | |
| — | | |
| — | |
| Future net cash flows | |
| 2,705,059 | | |
| — | | |
| 2,705,059 | |
| 10% annual discount for timing of cash flow | |
| (1,140,335 | ) | |
| — | | |
| (1,140,335 | ) |
| | |
| | | |
| | | |
| | |
| Standardized measure of discounted future net cash flow relating to proved oil and gas reserves | |
$ | 1,564,724 | | |
$ | — | | |
$ | 1,564,724 | |
| | |
| | | |
| | | |
| | |
| Changes in standardized measure: | |
| | | |
| | | |
| | |
| Change due to current year operations Sales, net of production costs | |
$ | (196,003 | ) | |
$ | — | | |
$ | (196,003 | ) |
| Sales, net of production costs | |
$ | (196,003 | ) | |
$ | — | | |
$ | (196,003 | ) |
| Change due to revisions in standardized variables: | |
| | | |
| | | |
| | |
| Accretion of discount | |
| 516,316 | | |
| — | | |
| 516,316 | |
| Net change in sales and transfer price, net of production costs | |
| (3,117,105 | ) | |
| — | | |
| (3,117,105 | |
| Net change in future development cost | |
| — | | |
| — | | |
| — | |
| Discoveries | |
| — | | |
| — | | |
| — | |
| Revision and others | |
| (645,668 | ) | |
| — | | |
| (645,668 | |
| Changes in production rates and other | |
| (155,975 | ) | |
| — | | |
| (155,975 | ) |
| | |
| | | |
| | | |
| | |
| Net | |
| (3,598,435 | ) | |
| — | | |
| (3,598,435 | |
| Beginning of year | |
| 5,163,159 | | |
| — | | |
| 5,163,159 | |
| End of year | |
$ | 1,564,724 | | |
$ | — | | |
$ | 1,564,724 | |
|
| X |
- DefinitionTabular disclosure of the net quantities of an enterprise's interests in proved developed and undeveloped reserves of (a) crude oil (including condensate and natural gas liquids), (b) natural gas (including coal bed methane), (c) synthetic oil, (d) synthetic gas, and (e) other nonrenewable natural resources that are intended to be upgraded during the period as of the beginning of the period, changes in quantities during the period, and as of the end of the period. Reference 1: http://www.xbrl.org/2009/role/commonPracticeRef
-Name Form 20-F
-Number Part II
-Section Item 18
-Subparagraph (Instruction 2)
-Publisher SEC
Reference 2: http://www.xbrl.org/2003/role/exampleRef
-Topic 932
-SubTopic 235
-Name Accounting Standards Codification
-Section 55
-Paragraph 2
-Publisher FASB
-URI https://asc.fasb.org/1943274/2147477916/932-235-55-2
Reference 3: http://www.xbrl.org/2003/role/exampleRef
-Topic 932
-SubTopic 235
-Name Accounting Standards Codification
-Section 50
-Paragraph 3
-Publisher FASB
-URI https://asc.fasb.org/1943274/2147477215/932-235-50-3
Reference 4: http://www.xbrl.org/2009/role/commonPracticeRef
-Topic 932
-SubTopic 235
-Name Accounting Standards Codification
-Section 50
-Paragraph 8
-Subparagraph (c)(2)
-Publisher FASB
-URI https://asc.fasb.org/1943274/2147477215/932-235-50-8
Reference 5: http://www.xbrl.org/2009/role/commonPracticeRef
-Topic 932
-SubTopic 235
-Name Accounting Standards Codification
-Section 50
-Paragraph 8
-Subparagraph (c)(1)
-Publisher FASB
-URI https://asc.fasb.org/1943274/2147477215/932-235-50-8
Reference 6: http://www.xbrl.org/2009/role/commonPracticeRef
-Topic 932
-SubTopic 235
-Name Accounting Standards Codification
-Section 50
-Paragraph 7
-Publisher FASB
-URI https://asc.fasb.org/1943274/2147477215/932-235-50-7
Reference 7: http://www.xbrl.org/2009/role/commonPracticeRef
-Topic 932
-SubTopic 235
-Name Accounting Standards Codification
-Section 50
-Paragraph 4
-Publisher FASB
-URI https://asc.fasb.org/1943274/2147477215/932-235-50-4
Reference 8: http://www.xbrl.org/2009/role/commonPracticeRef
-Topic 932
-SubTopic 235
-Name Accounting Standards Codification
-Section 50
-Paragraph 8
-Subparagraph (c)
-Publisher FASB
-URI https://asc.fasb.org/1943274/2147477215/932-235-50-8
Reference 9: http://www.xbrl.org/2009/role/commonPracticeRef
-Topic 932
-SubTopic 235
-Name Accounting Standards Codification
-Section 50
-Paragraph 5
-Publisher FASB
-URI https://asc.fasb.org/1943274/2147477215/932-235-50-5
| Name: |
srt_ScheduleOfProvedDevelopedAndUndevelopedOilAndGasReserveQuantitiesTextBlock |
| Namespace Prefix: |
srt_ |
| Data Type: |
dtr-types:textBlockItemType |
| Balance Type: |
na |
| Period Type: |
duration |
|
| X |
- DefinitionTabular disclosure of the future net cash flows relating to proved oil and gas reserves and oil and gas subject to purchase under long-term agreements in which the enterprise participates in the operation of the properties on which the oil and gas is located or otherwise serves as the producer. This information is presented in aggregate and for each geographic area for which reserve quantities are disclosed. Reference 1: http://www.xbrl.org/2003/role/disclosureRef
-Name Form 20-F
-Number Part II
-Section Item 18
-Subparagraph (Instruction 2)
-Publisher SEC
Reference 2: http://www.xbrl.org/2003/role/exampleRef
-Topic 932
-SubTopic 235
-Name Accounting Standards Codification
-Section 55
-Paragraph 6
-Publisher FASB
-URI https://asc.fasb.org/1943274/2147477916/932-235-55-6
Reference 3: http://www.xbrl.org/2003/role/exampleRef
-Topic 932
-SubTopic 235
-Name Accounting Standards Codification
-Section 50
-Paragraph 29
-Publisher FASB
-URI https://asc.fasb.org/1943274/2147477215/932-235-50-29
Reference 4: http://www.xbrl.org/2009/role/commonPracticeRef
-Name Accounting Standards Codification
-Section 50
-Paragraph 31
-SubTopic 235
-Topic 932
-Publisher FASB
-URI https://asc.fasb.org/1943274/2147477215/932-235-50-31
Reference 5: http://www.xbrl.org/2009/role/commonPracticeRef
-Name Accounting Standards Codification
-Section 50
-Paragraph 33
-SubTopic 235
-Topic 932
-Publisher FASB
-URI https://asc.fasb.org/1943274/2147477215/932-235-50-33
| Name: |
srt_StandardizedMeasureOfDiscountedFutureCashFlowsRelatingToProvedReservesDisclosureTextBlock |
| Namespace Prefix: |
srt_ |
| Data Type: |
dtr-types:textBlockItemType |
| Balance Type: |
na |
| Period Type: |
duration |
|
| X |
- DefinitionTabular disclosure of information about capitalized cost in oil- and gas-producing activities. Reference 1: http://www.xbrl.org/2003/role/exampleRef
-Topic 932
-SubTopic 235
-Name Accounting Standards Codification
-Section 55
-Paragraph 3
-Publisher FASB
-URI https://asc.fasb.org/1943274/2147477916/932-235-55-3
Reference 2: http://www.xbrl.org/2003/role/exampleRef
-Topic 932
-SubTopic 235
-Name Accounting Standards Codification
-Section 50
-Paragraph 12
-Publisher FASB
-URI https://asc.fasb.org/1943274/2147477215/932-235-50-12
Reference 3: http://www.xbrl.org/2009/role/commonPracticeRef
-Topic 932
-SubTopic 235
-Name Accounting Standards Codification
-Section 50
-Paragraph 13
-Publisher FASB
-URI https://asc.fasb.org/1943274/2147477215/932-235-50-13
Reference 4: http://www.xbrl.org/2009/role/commonPracticeRef
-Topic 932
-SubTopic 235
-Name Accounting Standards Codification
-Section 50
-Paragraph 14
-Publisher FASB
-URI https://asc.fasb.org/1943274/2147477215/932-235-50-14
Reference 5: http://www.xbrl.org/2009/role/commonPracticeRef
-Topic 932
-SubTopic 235
-Name Accounting Standards Codification
-Section 50
-Paragraph 15
-Publisher FASB
-URI https://asc.fasb.org/1943274/2147477215/932-235-50-15
| Name: |
us-gaap_CapitalizedCostsRelatingToOilAndGasProducingActivitiesDisclosureTextBlock |
| Namespace Prefix: |
us-gaap_ |
| Data Type: |
dtr-types:textBlockItemType |
| Balance Type: |
na |
| Period Type: |
duration |
|
| X |
- DefinitionTabular disclosure of result of operation in oil- and gas-producing activities. Reference 1: http://www.xbrl.org/2003/role/exampleRef
-Topic 932
-SubTopic 235
-Name Accounting Standards Codification
-Section 55
-Paragraph 5
-Publisher FASB
-URI https://asc.fasb.org/1943274/2147477916/932-235-55-5
Reference 2: http://www.xbrl.org/2003/role/exampleRef
-Topic 932
-SubTopic 235
-Name Accounting Standards Codification
-Section 50
-Paragraph 21
-Publisher FASB
-URI https://asc.fasb.org/1943274/2147477215/932-235-50-21
Reference 3: http://www.xbrl.org/2009/role/commonPracticeRef
-Topic 932
-SubTopic 323
-Name Accounting Standards Codification
-Section 50
-Paragraph 1
-Publisher FASB
-URI https://asc.fasb.org/1943274/2147478988/932-323-50-1
Reference 4: http://www.xbrl.org/2009/role/commonPracticeRef
-Topic 932
-SubTopic 280
-Name Accounting Standards Codification
-Section 50
-Paragraph 1
-Publisher FASB
-URI https://asc.fasb.org/1943274/2147478657/932-280-50-1
Reference 5: http://www.xbrl.org/2009/role/commonPracticeRef
-Topic 932
-SubTopic 235
-Name Accounting Standards Codification
-Section 50
-Paragraph 23
-Publisher FASB
-URI https://asc.fasb.org/1943274/2147477215/932-235-50-23
Reference 6: http://www.xbrl.org/2009/role/commonPracticeRef
-Topic 932
-SubTopic 220
-Name Accounting Standards Codification
-Section 50
-Paragraph 1
-Publisher FASB
-URI https://asc.fasb.org/1943274/2147478934/932-220-50-1
Reference 7: http://www.xbrl.org/2009/role/commonPracticeRef
-Topic 932
-SubTopic 235
-Name Accounting Standards Codification
-Section 50
-Paragraph 28
-Publisher FASB
-URI https://asc.fasb.org/1943274/2147477215/932-235-50-28
| Name: |
us-gaap_ResultsOfOperationsForOilAndGasProducingActivitiesDisclosureTextBlock |
| Namespace Prefix: |
us-gaap_ |
| Data Type: |
dtr-types:textBlockItemType |
| Balance Type: |
na |
| Period Type: |
duration |
|
v3.25.0.1
SCHEDULE OF COMPUTATION OF DILUTED NET LOSS PER SHARE (Details) - shares
|
12 Months Ended |
Dec. 31, 2024 |
Dec. 31, 2023 |
| Antidilutive Securities Excluded from Computation of Earnings Per Share [Line Items] |
|
|
| Totals |
1,011,387
|
1,095,207
|
| Warrant [Member] |
|
|
| Antidilutive Securities Excluded from Computation of Earnings Per Share [Line Items] |
|
|
| Totals |
94,400
|
94,400
|
| Share-Based Payment Arrangement, Option [Member] |
|
|
| Antidilutive Securities Excluded from Computation of Earnings Per Share [Line Items] |
|
|
| Totals |
916,987
|
1,000,807
|
| X |
- DefinitionSecurities (including those issuable pursuant to contingent stock agreements) that could potentially dilute basic earnings per share (EPS) or earnings per unit (EPU) in the future that were not included in the computation of diluted EPS or EPU because to do so would increase EPS or EPU amounts or decrease loss per share or unit amounts for the period presented. Reference 1: http://www.xbrl.org/2003/role/disclosureRef
-Topic 260
-SubTopic 10
-Name Accounting Standards Codification
-Section 50
-Paragraph 1
-Subparagraph (c)
-Publisher FASB
-URI https://asc.fasb.org/1943274/2147482662/260-10-50-1
| Name: |
us-gaap_AntidilutiveSecuritiesExcludedFromComputationOfEarningsPerShareAmount |
| Namespace Prefix: |
us-gaap_ |
| Data Type: |
xbrli:sharesItemType |
| Balance Type: |
na |
| Period Type: |
duration |
|
| X |
- DefinitionLine items represent financial concepts included in a table. These concepts are used to disclose reportable information associated with domain members defined in one or many axes to the table.
| Name: |
us-gaap_AntidilutiveSecuritiesExcludedFromComputationOfEarningsPerShareLineItems |
| Namespace Prefix: |
us-gaap_ |
| Data Type: |
xbrli:stringItemType |
| Balance Type: |
na |
| Period Type: |
duration |
|
| X |
- Details
| Name: |
us-gaap_AntidilutiveSecuritiesExcludedFromComputationOfEarningsPerShareByAntidilutiveSecuritiesAxis=us-gaap_WarrantMember |
| Namespace Prefix: |
|
| Data Type: |
na |
| Balance Type: |
|
| Period Type: |
|
|
| X |
- Details
| Name: |
us-gaap_AntidilutiveSecuritiesExcludedFromComputationOfEarningsPerShareByAntidilutiveSecuritiesAxis=us-gaap_EmployeeStockOptionMember |
| Namespace Prefix: |
|
| Data Type: |
na |
| Balance Type: |
|
| Period Type: |
|
|
v3.25.0.1
NATURE OF COMPANY AND SUMMARY OF SIGNIFICANT ACCOUNTING POLICIES (Details Narrative) - USD ($)
|
12 Months Ended |
|
Dec. 31, 2024 |
Dec. 31, 2023 |
Jan. 01, 2020 |
| Collaborative Arrangement and Arrangement Other than Collaborative [Line Items] |
|
|
|
| Accumulated deficit |
$ 85,215,109
|
$ 76,998,997
|
|
| Cash equivalents |
0
|
0
|
|
| Cash deposits |
2,500,000
|
|
|
| Current insured limit on interest bearing accounts |
250,000
|
|
|
| Depreciation depletion amortization |
160,001
|
167,527
|
|
| Accumulated amortization, depreciation and impairment |
61,743,025
|
61,217,260
|
|
| Impairment of oil and gas properties |
275,760
|
537,686
|
|
| Accumulated depreciation |
61,743,025
|
61,307,264
|
|
| Impairment charge |
$ 6,392,874
|
|
|
| Discount rate, net of related tax effects |
10.00%
|
|
|
| Office Equipment [Member] |
|
|
|
| Collaborative Arrangement and Arrangement Other than Collaborative [Line Items] |
|
|
|
| Accumulated depreciation |
$ 90,004
|
90,004
|
$ 90,004
|
| Oil and Gas [Member] |
|
|
|
| Collaborative Arrangement and Arrangement Other than Collaborative [Line Items] |
|
|
|
| Depreciation depletion amortization |
$ 160,001
|
$ 167,526
|
|
| X |
- DefinitionDiscounted future net cash flows relating to proved oil and gas reserves discount rate.
| Name: |
HUSA_DiscountedFutureNetCashFlowsRelatingToProvedOilAndGasReservesDiscountRate |
| Namespace Prefix: |
HUSA_ |
| Data Type: |
dtr-types:percentItemType |
| Balance Type: |
na |
| Period Type: |
duration |
|
| X |
- DefinitionImpairment charges on equity method investments.
| Name: |
HUSA_ImpairmentChargesOnEquityMethodInvestments |
| Namespace Prefix: |
HUSA_ |
| Data Type: |
xbrli:monetaryItemType |
| Balance Type: |
debit |
| Period Type: |
duration |
|
| X |
- DefinitionAmount of accumulated depreciation, depletion and amortization for physical assets used in the normal conduct of business to produce goods and services. Reference 1: http://www.xbrl.org/2003/role/disclosureRef
-Topic 944
-SubTopic 210
-Name Accounting Standards Codification
-Section S99
-Paragraph 1
-Subparagraph (SX 210.7-03(a)(8)(b))
-Publisher FASB
-URI https://asc.fasb.org/1943274/2147478777/944-210-S99-1
Reference 2: http://www.xbrl.org/2003/role/disclosureRef
-Topic 210
-SubTopic 10
-Name Accounting Standards Codification
-Section S99
-Paragraph 1
-Subparagraph (SX 210.5-02(14))
-Publisher FASB
-URI https://asc.fasb.org/1943274/2147480566/210-10-S99-1
Reference 3: http://fasb.org/us-gaap/role/ref/legacyRef
-Name Accounting Standards Codification
-Topic 360
-SubTopic 10
-Section 50
-Paragraph 1
-Subparagraph (c)
-Publisher FASB
-URI https://asc.fasb.org/1943274/2147482099/360-10-50-1
| Name: |
us-gaap_AccumulatedDepreciationDepletionAndAmortizationPropertyPlantAndEquipment |
| Namespace Prefix: |
us-gaap_ |
| Data Type: |
xbrli:monetaryItemType |
| Balance Type: |
credit |
| Period Type: |
instant |
|
| X |
- DefinitionAmount of short-term, highly liquid investments that are both readily convertible to known amounts of cash and so near their maturity that they present insignificant risk of changes in value because of changes in interest rates. Excludes cash and cash equivalents within disposal group and discontinued operation. Reference 1: http://www.xbrl.org/2009/role/commonPracticeRef
-Topic 944
-SubTopic 210
-Name Accounting Standards Codification
-Section S99
-Paragraph 1
-Subparagraph (SX 210.7-03(a)(2))
-Publisher FASB
-URI https://asc.fasb.org/1943274/2147478777/944-210-S99-1
Reference 2: http://www.xbrl.org/2009/role/commonPracticeRef
-Topic 210
-SubTopic 10
-Name Accounting Standards Codification
-Section S99
-Paragraph 1
-Subparagraph (SX 210.5-02(1))
-Publisher FASB
-URI https://asc.fasb.org/1943274/2147480566/210-10-S99-1
| Name: |
us-gaap_CashEquivalentsAtCarryingValue |
| Namespace Prefix: |
us-gaap_ |
| Data Type: |
xbrli:monetaryItemType |
| Balance Type: |
debit |
| Period Type: |
instant |
|
| X |
- DefinitionThe amount of cash deposited in financial institutions as of the balance sheet date that is insured by the Federal Deposit Insurance Corporation.
| Name: |
us-gaap_CashFDICInsuredAmount |
| Namespace Prefix: |
us-gaap_ |
| Data Type: |
xbrli:monetaryItemType |
| Balance Type: |
debit |
| Period Type: |
instant |
|
| X |
- DefinitionLine items represent financial concepts included in a table. These concepts are used to disclose reportable information associated with domain members defined in one or many axes to the table. Reference 1: http://www.xbrl.org/2003/role/disclosureRef
-Topic 808
-SubTopic 10
-Name Accounting Standards Codification
-Section 50
-Paragraph 1
-Subparagraph (d)
-Publisher FASB
-URI https://asc.fasb.org/1943274/2147479402/808-10-50-1
| Name: |
us-gaap_CollaborativeArrangementsAndNoncollaborativeArrangementTransactionsLineItems |
| Namespace Prefix: |
us-gaap_ |
| Data Type: |
xbrli:stringItemType |
| Balance Type: |
na |
| Period Type: |
duration |
|
| X |
- DefinitionThe aggregate of all deposit liabilities held by the entity, including foreign and domestic, interest and noninterest bearing; may include demand deposits, saving deposits, Negotiable Order of Withdrawal (NOW) and time deposits among others. Reference 1: http://fasb.org/us-gaap/role/ref/legacyRef
-Topic 942
-SubTopic 210
-Name Accounting Standards Codification
-Section S99
-Paragraph 1
-Subparagraph (SX 210.9-03(12))
-Publisher FASB
-URI https://asc.fasb.org/1943274/2147478546/942-210-S99-1
| Name: |
us-gaap_Deposits |
| Namespace Prefix: |
us-gaap_ |
| Data Type: |
xbrli:monetaryItemType |
| Balance Type: |
credit |
| Period Type: |
instant |
|
| X |
- DefinitionThe aggregate expense recognized in the current period that allocates the cost of tangible assets, intangible assets, or depleting assets to periods that benefit from use of the assets. Reference 1: http://fasb.org/us-gaap/role/ref/legacyRef
-Name Accounting Standards Codification
-Section 45
-Paragraph 28
-Subparagraph (b)
-SubTopic 10
-Topic 230
-Publisher FASB
-URI https://asc.fasb.org/1943274/2147482740/230-10-45-28
Reference 2: http://www.xbrl.org/2003/role/exampleRef
-Topic 280
-SubTopic 10
-Name Accounting Standards Codification
-Section 55
-Paragraph 48
-Publisher FASB
-URI https://asc.fasb.org/1943274/2147482785/280-10-55-48
Reference 3: http://www.xbrl.org/2003/role/exampleRef
-Topic 280
-SubTopic 10
-Name Accounting Standards Codification
-Section 55
-Paragraph 49
-Publisher FASB
-URI https://asc.fasb.org/1943274/2147482785/280-10-55-49
Reference 4: http://www.xbrl.org/2003/role/disclosureRef
-Topic 270
-SubTopic 10
-Name Accounting Standards Codification
-Section 50
-Paragraph 1
-Subparagraph (i)
-Publisher FASB
-URI https://asc.fasb.org/1943274/2147482964/270-10-50-1
Reference 5: http://www.xbrl.org/2003/role/disclosureRef
-Topic 280
-SubTopic 10
-Name Accounting Standards Codification
-Section 50
-Paragraph 32
-Subparagraph (ee)
-Publisher FASB
-URI https://asc.fasb.org/1943274/2147482810/280-10-50-32
Reference 6: http://www.xbrl.org/2003/role/disclosureRef
-Topic 280
-SubTopic 10
-Name Accounting Standards Codification
-Section 50
-Paragraph 22
-Subparagraph (e)
-Publisher FASB
-URI https://asc.fasb.org/1943274/2147482810/280-10-50-22
| Name: |
us-gaap_DepreciationDepletionAndAmortization |
| Namespace Prefix: |
us-gaap_ |
| Data Type: |
xbrli:monetaryItemType |
| Balance Type: |
debit |
| Period Type: |
duration |
|
| X |
- DefinitionAmount of impairment loss for oil and gas properties with proved and unproved reserves in oil- and gas-producing activities. Reference 1: http://fasb.org/us-gaap/role/ref/legacyRef
-Name Accounting Standards Codification
-Section 45
-Paragraph 28
-Subparagraph (b)
-SubTopic 10
-Topic 230
-Publisher FASB
-URI https://asc.fasb.org/1943274/2147482740/230-10-45-28
Reference 2: http://fasb.org/us-gaap/role/ref/legacyRef
-Topic 360
-SubTopic 10
-Name Accounting Standards Codification
-Section 50
-Paragraph 2
-Subparagraph (b)
-Publisher FASB
-URI https://asc.fasb.org/1943274/2147482099/360-10-50-2
| Name: |
us-gaap_ImpairmentOfOilAndGasProperties |
| Namespace Prefix: |
us-gaap_ |
| Data Type: |
xbrli:monetaryItemType |
| Balance Type: |
debit |
| Period Type: |
duration |
|
| X |
- DefinitionAmount of depreciation, depletion, amortization, and accretion charged to expense in oil- and gas-producing activities. Reference 1: http://www.xbrl.org/2009/role/commonPracticeRef
-Topic 932
-SubTopic 280
-Name Accounting Standards Codification
-Section 50
-Paragraph 1
-Publisher FASB
-URI https://asc.fasb.org/1943274/2147478657/932-280-50-1
Reference 2: http://www.xbrl.org/2009/role/commonPracticeRef
-Topic 932
-SubTopic 220
-Name Accounting Standards Codification
-Section 50
-Paragraph 1
-Publisher FASB
-URI https://asc.fasb.org/1943274/2147478934/932-220-50-1
Reference 3: http://www.xbrl.org/2009/role/commonPracticeRef
-Topic 932
-SubTopic 235
-Name Accounting Standards Codification
-Section 50
-Paragraph 23
-Subparagraph (d)
-Publisher FASB
-URI https://asc.fasb.org/1943274/2147477215/932-235-50-23
| Name: |
us-gaap_ResultsOfOperationsDepreciationDepletionAmortizationAndAccretion |
| Namespace Prefix: |
us-gaap_ |
| Data Type: |
xbrli:monetaryItemType |
| Balance Type: |
debit |
| Period Type: |
duration |
|
| X |
- DefinitionAmount of accumulated undistributed earnings (deficit). Reference 1: http://fasb.org/us-gaap/role/ref/legacyRef
-Topic 210
-SubTopic 10
-Name Accounting Standards Codification
-Section S99
-Paragraph 1
-Subparagraph (SX 210.5-02(30)(a)(3))
-Publisher FASB
-URI https://asc.fasb.org/1943274/2147480566/210-10-S99-1
Reference 2: http://www.xbrl.org/2003/role/exampleRef
-Topic 852
-SubTopic 10
-Name Accounting Standards Codification
-Section 55
-Paragraph 10
-Publisher FASB
-URI https://asc.fasb.org/1943274/2147481372/852-10-55-10
Reference 3: http://www.xbrl.org/2003/role/disclosureRef
-Topic 944
-SubTopic 40
-Name Accounting Standards Codification
-Section 65
-Paragraph 2
-Subparagraph (g)(2)(i)
-Publisher FASB
-URI https://asc.fasb.org/1943274/2147480016/944-40-65-2
Reference 4: http://www.xbrl.org/2003/role/disclosureRef
-Topic 944
-SubTopic 40
-Name Accounting Standards Codification
-Section 65
-Paragraph 2
-Subparagraph (h)(2)
-Publisher FASB
-URI https://asc.fasb.org/1943274/2147480016/944-40-65-2
Reference 5: http://www.xbrl.org/2003/role/disclosureRef
-Topic 946
-SubTopic 20
-Name Accounting Standards Codification
-Section 50
-Paragraph 11
-Publisher FASB
-URI https://asc.fasb.org/1943274/2147480990/946-20-50-11
Reference 6: http://www.xbrl.org/2003/role/disclosureRef
-Topic 944
-SubTopic 210
-Name Accounting Standards Codification
-Section S99
-Paragraph 1
-Subparagraph (SX 210.7-03(a)(23)(a)(4))
-Publisher FASB
-URI https://asc.fasb.org/1943274/2147478777/944-210-S99-1
Reference 7: http://www.xbrl.org/2003/role/disclosureRef
-Topic 946
-SubTopic 210
-Name Accounting Standards Codification
-Section S99
-Paragraph 1
-Subparagraph (SX 210.6-04(17))
-Publisher FASB
-URI https://asc.fasb.org/1943274/2147479170/946-210-S99-1
Reference 8: http://fasb.org/us-gaap/role/ref/legacyRef
-Topic 505
-SubTopic 10
-Name Accounting Standards Codification
-Section S99
-Paragraph 1
-Subparagraph (SX 210.3-04)
-Publisher FASB
-URI https://asc.fasb.org/1943274/2147480008/505-10-S99-1
| Name: |
us-gaap_RetainedEarningsAccumulatedDeficit |
| Namespace Prefix: |
us-gaap_ |
| Data Type: |
xbrli:monetaryItemType |
| Balance Type: |
credit |
| Period Type: |
instant |
|
| X |
- Details
| Name: |
us-gaap_PropertyPlantAndEquipmentByTypeAxis=us-gaap_OfficeEquipmentMember |
| Namespace Prefix: |
|
| Data Type: |
na |
| Balance Type: |
|
| Period Type: |
|
|
| X |
- Details
| Name: |
srt_ProductOrServiceAxis=us-gaap_OilAndGasMember |
| Namespace Prefix: |
|
| Data Type: |
na |
| Balance Type: |
|
| Period Type: |
|
|
v3.25.0.1
SCHEDULE OF DISAGGREGATES REVENUE BY SIGNIFICANT PRODUCT (Details) - USD ($)
|
12 Months Ended |
Dec. 31, 2024 |
Dec. 31, 2023 |
| Disaggregation of Revenue [Line Items] |
|
|
| Total revenue from customers |
$ 560,180
|
$ 794,027
|
| Oil Sales [Member] |
|
|
| Disaggregation of Revenue [Line Items] |
|
|
| Total revenue from customers |
437,900
|
590,486
|
| Natural Gas Sales [Member] |
|
|
| Disaggregation of Revenue [Line Items] |
|
|
| Total revenue from customers |
8,869
|
79,443
|
| Natural Gas Liquids Sales [Member] |
|
|
| Disaggregation of Revenue [Line Items] |
|
|
| Total revenue from customers |
$ 113,411
|
$ 124,098
|
| X |
- DefinitionLine items represent financial concepts included in a table. These concepts are used to disclose reportable information associated with domain members defined in one or many axes to the table. Reference 1: http://www.xbrl.org/2003/role/disclosureRef
-Topic 606
-SubTopic 10
-Name Accounting Standards Codification
-Section 50
-Paragraph 5
-Publisher FASB
-URI https://asc.fasb.org/1943274/2147479806/606-10-50-5
Reference 2: http://www.xbrl.org/2003/role/exampleRef
-Topic 606
-SubTopic 10
-Name Accounting Standards Codification
-Section 55
-Paragraph 91
-Subparagraph (a)
-Publisher FASB
-URI https://asc.fasb.org/1943274/2147479777/606-10-55-91
Reference 3: http://www.xbrl.org/2003/role/exampleRef
-Topic 606
-SubTopic 10
-Name Accounting Standards Codification
-Section 55
-Paragraph 91
-Subparagraph (b)
-Publisher FASB
-URI https://asc.fasb.org/1943274/2147479777/606-10-55-91
Reference 4: http://www.xbrl.org/2003/role/exampleRef
-Topic 606
-SubTopic 10
-Name Accounting Standards Codification
-Section 55
-Paragraph 91
-Subparagraph (c)
-Publisher FASB
-URI https://asc.fasb.org/1943274/2147479777/606-10-55-91
Reference 5: http://www.xbrl.org/2003/role/exampleRef
-Topic 606
-SubTopic 10
-Name Accounting Standards Codification
-Section 55
-Paragraph 91
-Subparagraph (d)
-Publisher FASB
-URI https://asc.fasb.org/1943274/2147479777/606-10-55-91
Reference 6: http://www.xbrl.org/2003/role/exampleRef
-Topic 606
-SubTopic 10
-Name Accounting Standards Codification
-Section 55
-Paragraph 91
-Subparagraph (e)
-Publisher FASB
-URI https://asc.fasb.org/1943274/2147479777/606-10-55-91
Reference 7: http://www.xbrl.org/2003/role/exampleRef
-Topic 606
-SubTopic 10
-Name Accounting Standards Codification
-Section 55
-Paragraph 91
-Subparagraph (f)
-Publisher FASB
-URI https://asc.fasb.org/1943274/2147479777/606-10-55-91
Reference 8: http://www.xbrl.org/2003/role/exampleRef
-Topic 606
-SubTopic 10
-Name Accounting Standards Codification
-Section 55
-Paragraph 91
-Subparagraph (g)
-Publisher FASB
-URI https://asc.fasb.org/1943274/2147479777/606-10-55-91
| Name: |
us-gaap_DisaggregationOfRevenueLineItems |
| Namespace Prefix: |
us-gaap_ |
| Data Type: |
xbrli:stringItemType |
| Balance Type: |
na |
| Period Type: |
duration |
|
| X |
- DefinitionAmount, excluding tax collected from customer, of revenue from satisfaction of performance obligation by transferring promised good or service to customer. Tax collected from customer is tax assessed by governmental authority that is both imposed on and concurrent with specific revenue-producing transaction, including, but not limited to, sales, use, value added and excise. Reference 1: http://www.xbrl.org/2003/role/disclosureRef
-Topic 280
-SubTopic 10
-Name Accounting Standards Codification
-Section 50
-Paragraph 41
-Subparagraph (a)
-Publisher FASB
-URI https://asc.fasb.org/1943274/2147482810/280-10-50-41
Reference 2: http://www.xbrl.org/2003/role/disclosureRef
-Topic 270
-SubTopic 10
-Name Accounting Standards Codification
-Section 50
-Paragraph 1
-Subparagraph (i)
-Publisher FASB
-URI https://asc.fasb.org/1943274/2147482964/270-10-50-1
Reference 3: http://www.xbrl.org/2003/role/disclosureRef
-Topic 280
-SubTopic 10
-Name Accounting Standards Codification
-Section 50
-Paragraph 32
-Subparagraph (ee)
-Publisher FASB
-URI https://asc.fasb.org/1943274/2147482810/280-10-50-32
Reference 4: http://fasb.org/us-gaap/role/ref/otherTransitionRef
-Topic 280
-SubTopic 10
-Name Accounting Standards Codification
-Section 50
-Paragraph 32
-Subparagraph (b)
-Publisher FASB
-URI https://asc.fasb.org/1943274/2147482810/280-10-50-32
Reference 5: http://fasb.org/us-gaap/role/ref/otherTransitionRef
-Topic 280
-SubTopic 10
-Name Accounting Standards Codification
-Section 50
-Paragraph 32
-Subparagraph (a)
-Publisher FASB
-URI https://asc.fasb.org/1943274/2147482810/280-10-50-32
Reference 6: http://www.xbrl.org/2003/role/disclosureRef
-Topic 924
-SubTopic 10
-Name Accounting Standards Codification
-Section S99
-Paragraph 1
-Subparagraph (SAB Topic 11.L)
-Publisher FASB
-URI https://asc.fasb.org/1943274/2147479941/924-10-S99-1
Reference 7: http://www.xbrl.org/2003/role/disclosureRef
-Topic 606
-SubTopic 10
-Name Accounting Standards Codification
-Section 50
-Paragraph 5
-Publisher FASB
-URI https://asc.fasb.org/1943274/2147479806/606-10-50-5
Reference 8: http://www.xbrl.org/2003/role/disclosureRef
-Topic 280
-SubTopic 10
-Name Accounting Standards Codification
-Section 50
-Paragraph 30
-Subparagraph (a)
-Publisher FASB
-URI https://asc.fasb.org/1943274/2147482810/280-10-50-30
Reference 9: http://www.xbrl.org/2003/role/disclosureRef
-Topic 280
-SubTopic 10
-Name Accounting Standards Codification
-Section 50
-Paragraph 42
-Publisher FASB
-URI https://asc.fasb.org/1943274/2147482810/280-10-50-42
Reference 10: http://www.xbrl.org/2003/role/disclosureRef
-Topic 280
-SubTopic 10
-Name Accounting Standards Codification
-Section 50
-Paragraph 22
-Subparagraph (b)
-Publisher FASB
-URI https://asc.fasb.org/1943274/2147482810/280-10-50-22
Reference 11: http://www.xbrl.org/2003/role/disclosureRef
-Topic 280
-SubTopic 10
-Name Accounting Standards Codification
-Section 50
-Paragraph 40
-Publisher FASB
-URI https://asc.fasb.org/1943274/2147482810/280-10-50-40
Reference 12: http://www.xbrl.org/2003/role/disclosureRef
-Topic 280
-SubTopic 10
-Name Accounting Standards Codification
-Section 50
-Paragraph 22
-Subparagraph (a)
-Publisher FASB
-URI https://asc.fasb.org/1943274/2147482810/280-10-50-22
Reference 13: http://www.xbrl.org/2003/role/disclosureRef
-Topic 606
-SubTopic 10
-Name Accounting Standards Codification
-Section 50
-Paragraph 4
-Subparagraph (a)
-Publisher FASB
-URI https://asc.fasb.org/1943274/2147479806/606-10-50-4
| Name: |
us-gaap_RevenueFromContractWithCustomerExcludingAssessedTax |
| Namespace Prefix: |
us-gaap_ |
| Data Type: |
xbrli:monetaryItemType |
| Balance Type: |
credit |
| Period Type: |
duration |
|
| X |
- Details
| Name: |
srt_ProductOrServiceAxis=HUSA_OilSalesMember |
| Namespace Prefix: |
|
| Data Type: |
na |
| Balance Type: |
|
| Period Type: |
|
|
| X |
- Details
| Name: |
srt_ProductOrServiceAxis=HUSA_NaturalGasSalesMember |
| Namespace Prefix: |
|
| Data Type: |
na |
| Balance Type: |
|
| Period Type: |
|
|
| X |
- Details
| Name: |
srt_ProductOrServiceAxis=HUSA_NaturalGasLiquidsSalesMember |
| Namespace Prefix: |
|
| Data Type: |
na |
| Balance Type: |
|
| Period Type: |
|
|
v3.25.0.1
| X |
- References
+ Details
| Name: |
us-gaap_RevenueFromContractWithCustomerAbstract |
| Namespace Prefix: |
us-gaap_ |
| Data Type: |
xbrli:stringItemType |
| Balance Type: |
na |
| Period Type: |
duration |
|
| X |
- DefinitionAmount of transaction price allocated to performance obligation that has not been recognized as revenue. Reference 1: http://www.xbrl.org/2003/role/disclosureRef
-Name Accounting Standards Codification
-Section 50
-Paragraph 13
-Subparagraph (a)
-SubTopic 10
-Topic 606
-Publisher FASB
-URI https://asc.fasb.org/1943274/2147479806/606-10-50-13
| Name: |
us-gaap_RevenueRemainingPerformanceObligation |
| Namespace Prefix: |
us-gaap_ |
| Data Type: |
xbrli:monetaryItemType |
| Balance Type: |
credit |
| Period Type: |
instant |
|
v3.25.0.1
SCHEDULE OF EVALUATED OIL AND GAS PROPERTIES SUBJECT TO AMORTIZATION (Details) - USD ($)
|
Dec. 31, 2024 |
Dec. 31, 2023 |
| Oil and Gas, Full Cost Method, Amortization Expense [Line Items] |
|
|
| Evaluated properties being amortized |
$ 62,770,657
|
$ 62,766,561
|
| Accumulated depreciation, depletion, amortization and impairment |
(61,653,021)
|
(61,206,942)
|
| Net capitalized costs |
1,117,636
|
1,559,619
|
| UNITED STATES |
|
|
| Oil and Gas, Full Cost Method, Amortization Expense [Line Items] |
|
|
| Evaluated properties being amortized |
13,326,003
|
13,321,907
|
| Accumulated depreciation, depletion, amortization and impairment |
(12,208,367)
|
(11,762,288)
|
| Net capitalized costs |
1,117,636
|
1,559,619
|
| South America [Member] |
|
|
| Oil and Gas, Full Cost Method, Amortization Expense [Line Items] |
|
|
| Evaluated properties being amortized |
49,444,654
|
49,444,654
|
| Accumulated depreciation, depletion, amortization and impairment |
(49,444,654)
|
(49,444,654)
|
| Net capitalized costs |
|
|
| X |
- DefinitionThe sum of the capitalized costs incurred, as of the balance sheet date, of proved properties being amortization including acquisition costs, exploration costs, development costs, and production costs.
| Name: |
HUSA_CapitalizedCostsOfProvedPropertiesBeingAmortizationCumulative |
| Namespace Prefix: |
HUSA_ |
| Data Type: |
xbrli:monetaryItemType |
| Balance Type: |
debit |
| Period Type: |
instant |
|
| X |
- DefinitionRepresents net capitalized costs after deducting accumulated depreciation, depletion, amortization and impairment of proved properties, oil and gas producing activities.
| Name: |
HUSA_CapitalizedCostsOfProvedPropertiesOilAndGasProducingActivitiesNet |
| Namespace Prefix: |
HUSA_ |
| Data Type: |
xbrli:monetaryItemType |
| Balance Type: |
debit |
| Period Type: |
instant |
|
| X |
- DefinitionLine items represent financial concepts included in a table. These concepts are used to disclose reportable information associated with domain members defined in one or many axes to the table. Reference 1: http://www.xbrl.org/2003/role/disclosureRef
-Topic 932
-SubTopic 360
-Name Accounting Standards Codification
-Section S50
-Paragraph 5
-Publisher FASB
-URI https://asc.fasb.org/1943274/2147477385/932-360-S50-5
Reference 2: http://www.xbrl.org/2003/role/disclosureRef
-Topic 932
-SubTopic 10
-Name Accounting Standards Codification
-Section S99
-Paragraph 1
-Subparagraph (SX 210.4-10(c)(7)(i))
-Publisher FASB
-URI https://asc.fasb.org/1943274/2147479664/932-10-S99-1
| Name: |
us-gaap_AmortizationExpensePerEquivalentUnitOfProductionOrPerDollarOfGrossRevenueLineItems |
| Namespace Prefix: |
us-gaap_ |
| Data Type: |
xbrli:stringItemType |
| Balance Type: |
na |
| Period Type: |
duration |
|
| X |
- DefinitionAmount of accumulated depreciation, depletion, amortization, and valuation allowance for capitalized cost in oil- and gas-producing activities. Reference 1: http://www.xbrl.org/2003/role/exampleRef
-Topic 932
-SubTopic 235
-Name Accounting Standards Codification
-Section 55
-Paragraph 3
-Publisher FASB
-URI https://asc.fasb.org/1943274/2147477916/932-235-55-3
Reference 2: http://www.xbrl.org/2003/role/disclosureRef
-Topic 932
-SubTopic 235
-Name Accounting Standards Codification
-Section 50
-Paragraph 15
-Subparagraph (b)
-Publisher FASB
-URI https://asc.fasb.org/1943274/2147477215/932-235-50-15
Reference 3: http://www.xbrl.org/2003/role/disclosureRef
-Topic 932
-SubTopic 235
-Name Accounting Standards Codification
-Section 50
-Paragraph 15
-Subparagraph (a)
-Publisher FASB
-URI https://asc.fasb.org/1943274/2147477215/932-235-50-15
Reference 4: http://www.xbrl.org/2003/role/disclosureRef
-Topic 932
-SubTopic 235
-Name Accounting Standards Codification
-Section 50
-Paragraph 13
-Publisher FASB
-URI https://asc.fasb.org/1943274/2147477215/932-235-50-13
Reference 5: http://www.xbrl.org/2003/role/exampleRef
-Topic 932
-SubTopic 235
-Name Accounting Standards Codification
-Section 50
-Paragraph 12
-Publisher FASB
-URI https://asc.fasb.org/1943274/2147477215/932-235-50-12
| Name: |
us-gaap_CapitalizedCostsAccumulatedDepreciationDepletionAmortizationAndValuationAllowanceForRelatingToOilAndGasProducingActivities |
| Namespace Prefix: |
us-gaap_ |
| Data Type: |
xbrli:monetaryItemType |
| Balance Type: |
credit |
| Period Type: |
instant |
|
| X |
- Details
| Name: |
srt_StatementGeographicalAxis=country_US |
| Namespace Prefix: |
|
| Data Type: |
na |
| Balance Type: |
|
| Period Type: |
|
|
| X |
- Details
| Name: |
srt_StatementGeographicalAxis=srt_SouthAmericaMember |
| Namespace Prefix: |
|
| Data Type: |
na |
| Balance Type: |
|
| Period Type: |
|
|
v3.25.0.1
| X |
- DefinitionAmount of impairment loss for oil and gas properties with proved and unproved reserves in oil- and gas-producing activities. Reference 1: http://fasb.org/us-gaap/role/ref/legacyRef
-Name Accounting Standards Codification
-Section 45
-Paragraph 28
-Subparagraph (b)
-SubTopic 10
-Topic 230
-Publisher FASB
-URI https://asc.fasb.org/1943274/2147482740/230-10-45-28
Reference 2: http://fasb.org/us-gaap/role/ref/legacyRef
-Topic 360
-SubTopic 10
-Name Accounting Standards Codification
-Section 50
-Paragraph 2
-Subparagraph (b)
-Publisher FASB
-URI https://asc.fasb.org/1943274/2147482099/360-10-50-2
| Name: |
us-gaap_ImpairmentOfOilAndGasProperties |
| Namespace Prefix: |
us-gaap_ |
| Data Type: |
xbrli:monetaryItemType |
| Balance Type: |
debit |
| Period Type: |
duration |
|
v3.25.0.1
| X |
- References
+ Details
| Name: |
HUSA_DisclosureEquityInvestmentAccountedForAtCostAbstract |
| Namespace Prefix: |
HUSA_ |
| Data Type: |
xbrli:stringItemType |
| Balance Type: |
na |
| Period Type: |
duration |
|
| X |
- DefinitionImpairment charges on equity method investments.
| Name: |
HUSA_ImpairmentChargesOnEquityMethodInvestments |
| Namespace Prefix: |
HUSA_ |
| Data Type: |
xbrli:monetaryItemType |
| Balance Type: |
debit |
| Period Type: |
duration |
|
| X |
- DefinitionThis element represents the aggregate cost of investments accounted for under the equity method of accounting. Reference 1: http://fasb.org/us-gaap/role/ref/legacyRef
-Topic 210
-SubTopic 10
-Name Accounting Standards Codification
-Section S99
-Paragraph 1
-Subparagraph (SX 210.5-02(12))
-Publisher FASB
-URI https://asc.fasb.org/1943274/2147480566/210-10-S99-1
| Name: |
us-gaap_EquityMethodInvestmentAggregateCost |
| Namespace Prefix: |
us-gaap_ |
| Data Type: |
xbrli:monetaryItemType |
| Balance Type: |
debit |
| Period Type: |
instant |
|
| X |
- DefinitionAmount of distribution received from equity method investee for return on investment, classified as operating activities. Excludes distribution for return of investment, classified as investing activities. Reference 1: http://fasb.org/us-gaap/role/ref/legacyRef
-Name Accounting Standards Codification
-Section 45
-Paragraph 28
-Subparagraph (b)
-SubTopic 10
-Topic 230
-Publisher FASB
-URI https://asc.fasb.org/1943274/2147482740/230-10-45-28
Reference 2: http://www.xbrl.org/2003/role/disclosureRef
-Topic 944
-SubTopic 220
-Name Accounting Standards Codification
-Section S99
-Paragraph 1
-Subparagraph (SX 210.7-04(10))
-Publisher FASB
-URI https://asc.fasb.org/1943274/2147477250/944-220-S99-1
Reference 3: http://fasb.org/us-gaap/role/ref/legacyRef
-Name Accounting Standards Codification
-Section 45
-Paragraph 21D
-SubTopic 10
-Topic 230
-Publisher FASB
-URI https://asc.fasb.org/1943274/2147482740/230-10-45-21D
Reference 4: http://fasb.org/us-gaap/role/ref/legacyRef
-Topic 220
-SubTopic 10
-Name Accounting Standards Codification
-Section S99
-Paragraph 2
-Subparagraph (SX 210.5-03(12))
-Publisher FASB
-URI https://asc.fasb.org/1943274/2147483621/220-10-S99-2
| Name: |
us-gaap_EquityMethodInvestmentDividendsOrDistributions |
| Namespace Prefix: |
us-gaap_ |
| Data Type: |
xbrli:monetaryItemType |
| Balance Type: |
debit |
| Period Type: |
duration |
|
| X |
- DefinitionIncludes other investments and securities that are not at fair value as of the balance sheet date and those that are not accounted for under the equity method. Reference 1: http://fasb.org/us-gaap/role/ref/legacyRef
-Topic 942
-SubTopic 210
-Name Accounting Standards Codification
-Section S99
-Paragraph 1
-Subparagraph (SX 210.9-03(5))
-Publisher FASB
-URI https://asc.fasb.org/1943274/2147478546/942-210-S99-1
Reference 2: http://www.xbrl.org/2009/role/commonPracticeRef
-Topic 210
-SubTopic 10
-Name Accounting Standards Codification
-Section S99
-Paragraph 1
-Subparagraph (SX 210.5-02(18))
-Publisher FASB
-URI https://asc.fasb.org/1943274/2147480566/210-10-S99-1
| Name: |
us-gaap_OtherInvestmentsAndSecuritiesAtCost |
| Namespace Prefix: |
us-gaap_ |
| Data Type: |
xbrli:monetaryItemType |
| Balance Type: |
debit |
| Period Type: |
instant |
|
v3.25.0.1
SCHEDULE OF CHANGES IN OUR ASSET RETIREMENT LIABILITY (Details) - USD ($)
|
12 Months Ended |
Dec. 31, 2024 |
Dec. 31, 2023 |
| Asset Retirement Obligation Disclosure [Abstract] |
|
|
| ARO liability at January 1 |
$ 63,084
|
$ 72,789
|
| Additions from new drilling |
|
|
| Liabilities settled |
|
(2,706)
|
| Changes in estimates |
(5,904)
|
(9,706)
|
| Accretion expense |
|
2,707
|
| ARO liability at December 31 |
$ 57,180
|
$ 63,084
|
| X |
- DefinitionAsset retirement obligation additions from new drilling.
| Name: |
HUSA_AssetRetirementObligationAdditionsFromNewDrilling |
| Namespace Prefix: |
HUSA_ |
| Data Type: |
xbrli:monetaryItemType |
| Balance Type: |
credit |
| Period Type: |
duration |
|
| X |
- DefinitionThe carrying amount of a liability for an asset retirement obligation. An asset retirement obligation is a legal obligation associated with the disposal or retirement of a tangible long-lived asset that results from the acquisition, construction or development, or the normal operations of a long-lived asset, except for certain obligations of lessees. Reference 1: http://www.xbrl.org/2003/role/disclosureRef
-Topic 410
-SubTopic 20
-Name Accounting Standards Codification
-Section 25
-Paragraph 4
-Publisher FASB
-URI https://asc.fasb.org/1943274/2147481999/410-20-25-4
Reference 2: http://www.xbrl.org/2003/role/disclosureRef
-Topic 410
-SubTopic 20
-Name Accounting Standards Codification
-Section 50
-Paragraph 1
-Subparagraph (c)
-Publisher FASB
-URI https://asc.fasb.org/1943274/2147481850/410-20-50-1
| Name: |
us-gaap_AssetRetirementObligation |
| Namespace Prefix: |
us-gaap_ |
| Data Type: |
xbrli:monetaryItemType |
| Balance Type: |
credit |
| Period Type: |
instant |
|
| X |
- DefinitionAmount of accretion expense recognized during the period that is associated with an asset retirement obligation. Accretion expense measures and incorporates changes due to the passage of time into the carrying amount of the liability. Reference 1: http://www.xbrl.org/2003/role/disclosureRef
-Topic 410
-SubTopic 20
-Name Accounting Standards Codification
-Section 45
-Paragraph 1
-Publisher FASB
-URI https://asc.fasb.org/1943274/2147481879/410-20-45-1
Reference 2: http://www.xbrl.org/2003/role/disclosureRef
-Topic 410
-SubTopic 20
-Name Accounting Standards Codification
-Section 50
-Paragraph 1
-Subparagraph (c)(3)
-Publisher FASB
-URI https://asc.fasb.org/1943274/2147481850/410-20-50-1
| Name: |
us-gaap_AssetRetirementObligationAccretionExpense |
| Namespace Prefix: |
us-gaap_ |
| Data Type: |
xbrli:monetaryItemType |
| Balance Type: |
debit |
| Period Type: |
duration |
|
| X |
- References
+ Details
| Name: |
us-gaap_AssetRetirementObligationDisclosureAbstract |
| Namespace Prefix: |
us-gaap_ |
| Data Type: |
xbrli:stringItemType |
| Balance Type: |
na |
| Period Type: |
duration |
|
| X |
- DefinitionAmount of asset retirement obligations settled, or otherwise disposed of, during the period. This may include asset retirement obligations transferred to third parties associated with the sale of a long-lived asset. Reference 1: http://www.xbrl.org/2003/role/disclosureRef
-Topic 410
-SubTopic 20
-Name Accounting Standards Codification
-Section 50
-Paragraph 1
-Subparagraph (c)(2)
-Publisher FASB
-URI https://asc.fasb.org/1943274/2147481850/410-20-50-1
| Name: |
us-gaap_AssetRetirementObligationLiabilitiesSettled |
| Namespace Prefix: |
us-gaap_ |
| Data Type: |
xbrli:monetaryItemType |
| Balance Type: |
debit |
| Period Type: |
duration |
|
| X |
- DefinitionAmount of increase (decrease) in the asset retirement obligation from changes in the amount or timing of the estimated cash flows associated with the settlement of the obligation. Reference 1: http://www.xbrl.org/2003/role/disclosureRef
-Topic 410
-SubTopic 20
-Name Accounting Standards Codification
-Section 50
-Paragraph 1
-Subparagraph (c)(4)
-Publisher FASB
-URI https://asc.fasb.org/1943274/2147481850/410-20-50-1
| Name: |
us-gaap_AssetRetirementObligationRevisionOfEstimate |
| Namespace Prefix: |
us-gaap_ |
| Data Type: |
xbrli:monetaryItemType |
| Balance Type: |
credit |
| Period Type: |
duration |
|
v3.25.0.1
SUMMARY OF STOCK OPTION ACTIVITY (Details) - USD ($)
|
12 Months Ended |
Dec. 31, 2024 |
Dec. 31, 2023 |
| Share-Based Payment Arrangement [Abstract] |
|
|
| Options Outstanding at beginning of the period |
1,000,807
|
944,177
|
| Weighted-Average Exercise Price Outstanding at beginning of the period |
$ 2.46
|
$ 2.08
|
| Options Granted |
82,320
|
60,000
|
| Weighted-Average Exercise Price Granted |
$ 1.08
|
$ 2.09
|
| Option exercised |
|
|
| Weighted Average Exercise Price Exercised |
|
$ 3.84
|
| Options Forfeited |
|
(3,370)
|
| Weighted-Average Exercise Price Forfeited |
|
$ 20.43
|
| Options Expired |
(166,140)
|
|
| Weighted-Average Exercise Price Expired |
$ 3.87
|
|
| Options Outstanding at end of the period |
916,987
|
1,000,807
|
| Weighted-Average Exercise Price Outstanding at end of the period |
$ 2.06
|
$ 2.46
|
| Weighted average remaining contractual term of the outstanding options |
6 years 1 month 6 days
|
|
| Aggregate Intrinsic Value Outstanding at end of the period |
|
$ 16,956
|
| Options Outstanding Exercisable at end of the period |
851,131
|
|
| Weighted-Average Exercise Price Outstanding Exercisable at end of the period |
$ 2.13
|
|
| Weighted average remaining contractual term of the exercisable options |
5 years 10 months 9 days
|
|
| Aggregate Intrinsic Value Outstanding Exercisable at end of the period |
$ 16,956
|
|
| X |
- DefinitionThe number of shares into which fully or partially vested stock options outstanding as of the balance sheet date can be currently converted under the option plan. Reference 1: http://www.xbrl.org/2003/role/disclosureRef
-Topic 718
-SubTopic 10
-Name Accounting Standards Codification
-Section 50
-Paragraph 2
-Subparagraph (c)(1)(iii)
-Publisher FASB
-URI https://asc.fasb.org/1943274/2147480429/718-10-50-2
| Name: |
us-gaap_ShareBasedCompensationArrangementByShareBasedPaymentAwardOptionsExercisableNumber |
| Namespace Prefix: |
us-gaap_ |
| Data Type: |
xbrli:sharesItemType |
| Balance Type: |
na |
| Period Type: |
instant |
|
| X |
- DefinitionThe weighted-average price as of the balance sheet date at which grantees can acquire the shares reserved for issuance on vested portions of options outstanding and currently exercisable under the stock option plan. Reference 1: http://www.xbrl.org/2003/role/disclosureRef
-Topic 718
-SubTopic 10
-Name Accounting Standards Codification
-Section 50
-Paragraph 2
-Subparagraph (c)(1)(iii)
-Publisher FASB
-URI https://asc.fasb.org/1943274/2147480429/718-10-50-2
| Name: |
us-gaap_ShareBasedCompensationArrangementByShareBasedPaymentAwardOptionsExercisableWeightedAverageExercisePrice |
| Namespace Prefix: |
us-gaap_ |
| Data Type: |
dtr-types:perShareItemType |
| Balance Type: |
na |
| Period Type: |
instant |
|
| X |
- DefinitionNumber of options or other stock instruments for which the right to exercise has lapsed under the terms of the plan agreements. Reference 1: http://www.xbrl.org/2003/role/disclosureRef
-Topic 718
-SubTopic 10
-Name Accounting Standards Codification
-Section 50
-Paragraph 2
-Subparagraph (c)(1)(iv)(04)
-Publisher FASB
-URI https://asc.fasb.org/1943274/2147480429/718-10-50-2
| Name: |
us-gaap_ShareBasedCompensationArrangementByShareBasedPaymentAwardOptionsExpirationsInPeriod |
| Namespace Prefix: |
us-gaap_ |
| Data Type: |
xbrli:sharesItemType |
| Balance Type: |
na |
| Period Type: |
duration |
|
| X |
- DefinitionThe number of shares under options that were cancelled during the reporting period as a result of occurrence of a terminating event specified in contractual agreements pertaining to the stock option plan. Reference 1: http://www.xbrl.org/2003/role/disclosureRef
-Topic 718
-SubTopic 10
-Name Accounting Standards Codification
-Section 50
-Paragraph 2
-Subparagraph (c)(1)(iv)(03)
-Publisher FASB
-URI https://asc.fasb.org/1943274/2147480429/718-10-50-2
| Name: |
us-gaap_ShareBasedCompensationArrangementByShareBasedPaymentAwardOptionsForfeituresInPeriod |
| Namespace Prefix: |
us-gaap_ |
| Data Type: |
xbrli:sharesItemType |
| Balance Type: |
na |
| Period Type: |
duration |
|
| X |
- DefinitionGross number of share options (or share units) granted during the period. Reference 1: http://www.xbrl.org/2003/role/disclosureRef
-Topic 718
-SubTopic 10
-Name Accounting Standards Codification
-Section 50
-Paragraph 2
-Subparagraph (c)(1)(iv)(01)
-Publisher FASB
-URI https://asc.fasb.org/1943274/2147480429/718-10-50-2
| Name: |
us-gaap_ShareBasedCompensationArrangementByShareBasedPaymentAwardOptionsGrantsInPeriodGross |
| Namespace Prefix: |
us-gaap_ |
| Data Type: |
xbrli:sharesItemType |
| Balance Type: |
na |
| Period Type: |
duration |
|
| X |
- DefinitionAmount by which the current fair value of the underlying stock exceeds the exercise price of options outstanding. Reference 1: http://fasb.org/us-gaap/role/ref/legacyRef
-Name Accounting Standards Codification
-Topic 718
-SubTopic 10
-Section 50
-Paragraph 2
-Publisher FASB
-URI https://asc.fasb.org/1943274/2147480429/718-10-50-2
| Name: |
us-gaap_ShareBasedCompensationArrangementByShareBasedPaymentAwardOptionsOutstandingIntrinsicValue |
| Namespace Prefix: |
us-gaap_ |
| Data Type: |
xbrli:monetaryItemType |
| Balance Type: |
debit |
| Period Type: |
instant |
|
| X |
- DefinitionNumber of options outstanding, including both vested and non-vested options. Reference 1: http://www.xbrl.org/2003/role/disclosureRef
-Topic 718
-SubTopic 10
-Name Accounting Standards Codification
-Section 50
-Paragraph 2
-Subparagraph (c)(1)(i)
-Publisher FASB
-URI https://asc.fasb.org/1943274/2147480429/718-10-50-2
Reference 2: http://www.xbrl.org/2003/role/disclosureRef
-Topic 718
-SubTopic 10
-Name Accounting Standards Codification
-Section 50
-Paragraph 2
-Subparagraph (c)(1)(ii)
-Publisher FASB
-URI https://asc.fasb.org/1943274/2147480429/718-10-50-2
| Name: |
us-gaap_ShareBasedCompensationArrangementByShareBasedPaymentAwardOptionsOutstandingNumber |
| Namespace Prefix: |
us-gaap_ |
| Data Type: |
xbrli:sharesItemType |
| Balance Type: |
na |
| Period Type: |
instant |
|
| X |
- DefinitionWeighted average price at which grantees can acquire the shares reserved for issuance under the stock option plan. Reference 1: http://www.xbrl.org/2003/role/disclosureRef
-Topic 718
-SubTopic 10
-Name Accounting Standards Codification
-Section 50
-Paragraph 2
-Subparagraph (c)(1)(i)
-Publisher FASB
-URI https://asc.fasb.org/1943274/2147480429/718-10-50-2
Reference 2: http://www.xbrl.org/2003/role/disclosureRef
-Topic 718
-SubTopic 10
-Name Accounting Standards Codification
-Section 50
-Paragraph 2
-Subparagraph (c)(1)(ii)
-Publisher FASB
-URI https://asc.fasb.org/1943274/2147480429/718-10-50-2
| Name: |
us-gaap_ShareBasedCompensationArrangementByShareBasedPaymentAwardOptionsOutstandingWeightedAverageExercisePrice |
| Namespace Prefix: |
us-gaap_ |
| Data Type: |
dtr-types:perShareItemType |
| Balance Type: |
na |
| Period Type: |
instant |
|
| X |
- DefinitionWeighted average price at which option holders acquired shares when converting their stock options into shares. Reference 1: http://www.xbrl.org/2003/role/disclosureRef
-Topic 718
-SubTopic 10
-Name Accounting Standards Codification
-Section 50
-Paragraph 2
-Subparagraph (c)(1)(iv)(02)
-Publisher FASB
-URI https://asc.fasb.org/1943274/2147480429/718-10-50-2
| Name: |
us-gaap_ShareBasedCompensationArrangementsByShareBasedPaymentAwardOptionsExercisesInPeriodWeightedAverageExercisePrice |
| Namespace Prefix: |
us-gaap_ |
| Data Type: |
dtr-types:perShareItemType |
| Balance Type: |
na |
| Period Type: |
duration |
|
| X |
- DefinitionWeighted average price at which grantees could have acquired the underlying shares with respect to stock options of the plan that expired. Reference 1: http://www.xbrl.org/2003/role/disclosureRef
-Topic 718
-SubTopic 10
-Name Accounting Standards Codification
-Section 50
-Paragraph 2
-Subparagraph (c)(1)(iv)(04)
-Publisher FASB
-URI https://asc.fasb.org/1943274/2147480429/718-10-50-2
| Name: |
us-gaap_ShareBasedCompensationArrangementsByShareBasedPaymentAwardOptionsExpirationsInPeriodWeightedAverageExercisePrice |
| Namespace Prefix: |
us-gaap_ |
| Data Type: |
dtr-types:perShareItemType |
| Balance Type: |
na |
| Period Type: |
duration |
|
| X |
- DefinitionWeighted average price at which grantees could have acquired the underlying shares with respect to stock options that were terminated. Reference 1: http://www.xbrl.org/2003/role/disclosureRef
-Topic 718
-SubTopic 10
-Name Accounting Standards Codification
-Section 50
-Paragraph 2
-Subparagraph (c)(1)(iv)(03)
-Publisher FASB
-URI https://asc.fasb.org/1943274/2147480429/718-10-50-2
| Name: |
us-gaap_ShareBasedCompensationArrangementsByShareBasedPaymentAwardOptionsForfeituresInPeriodWeightedAverageExercisePrice |
| Namespace Prefix: |
us-gaap_ |
| Data Type: |
dtr-types:perShareItemType |
| Balance Type: |
na |
| Period Type: |
duration |
|
| X |
- DefinitionWeighted average per share amount at which grantees can acquire shares of common stock by exercise of options. Reference 1: http://www.xbrl.org/2003/role/disclosureRef
-Topic 718
-SubTopic 10
-Name Accounting Standards Codification
-Section 50
-Paragraph 2
-Subparagraph (c)(1)(iv)(01)
-Publisher FASB
-URI https://asc.fasb.org/1943274/2147480429/718-10-50-2
| Name: |
us-gaap_ShareBasedCompensationArrangementsByShareBasedPaymentAwardOptionsGrantsInPeriodWeightedAverageExercisePrice |
| Namespace Prefix: |
us-gaap_ |
| Data Type: |
dtr-types:perShareItemType |
| Balance Type: |
na |
| Period Type: |
duration |
|
| X |
- DefinitionAmount of difference between fair value of the underlying shares reserved for issuance and exercise price of vested portions of options outstanding and currently exercisable. Reference 1: http://fasb.org/us-gaap/role/ref/legacyRef
-Name Accounting Standards Codification
-Topic 718
-SubTopic 10
-Section 50
-Paragraph 2
-Publisher FASB
-URI https://asc.fasb.org/1943274/2147480429/718-10-50-2
| Name: |
us-gaap_SharebasedCompensationArrangementBySharebasedPaymentAwardOptionsExercisableIntrinsicValue1 |
| Namespace Prefix: |
us-gaap_ |
| Data Type: |
xbrli:monetaryItemType |
| Balance Type: |
debit |
| Period Type: |
instant |
|
| X |
- DefinitionWeighted average remaining contractual term for vested portions of options outstanding and currently exercisable or convertible, in 'PnYnMnDTnHnMnS' format, for example, 'P1Y5M13D' represents the reported fact of one year, five months, and thirteen days. Reference 1: http://fasb.org/us-gaap/role/ref/legacyRef
-Name Accounting Standards Codification
-Topic 718
-SubTopic 10
-Section 50
-Paragraph 2
-Publisher FASB
-URI https://asc.fasb.org/1943274/2147480429/718-10-50-2
| Name: |
us-gaap_SharebasedCompensationArrangementBySharebasedPaymentAwardOptionsExercisableWeightedAverageRemainingContractualTerm1 |
| Namespace Prefix: |
us-gaap_ |
| Data Type: |
xbrli:durationItemType |
| Balance Type: |
na |
| Period Type: |
duration |
|
| X |
- DefinitionWeighted average remaining contractual term of outstanding stock options, in 'PnYnMnDTnHnMnS' format, for example, 'P1Y5M13D' represents the reported fact of one year, five months, and thirteen days. Reference 1: http://fasb.org/us-gaap/role/ref/legacyRef
-Topic 718
-SubTopic 10
-Subparagraph (e)(1)
-Name Accounting Standards Codification
-Paragraph 2
-Section 50
-Publisher FASB
-URI https://asc.fasb.org/1943274/2147480429/718-10-50-2
| Name: |
us-gaap_SharebasedCompensationSharesAuthorizedUnderStockOptionPlansExercisePriceRangeOutstandingOptionsWeightedAverageRemainingContractualTerm2 |
| Namespace Prefix: |
us-gaap_ |
| Data Type: |
xbrli:durationItemType |
| Balance Type: |
na |
| Period Type: |
duration |
|
| X |
- DefinitionNumber of share options (or share units) exercised during the current period. Reference 1: http://fasb.org/us-gaap/role/ref/legacyRef
-Name Accounting Standards Codification
-Section 50
-Paragraph 2
-SubTopic 10
-Topic 505
-Publisher FASB
-URI https://asc.fasb.org/1943274/2147481112/505-10-50-2
Reference 2: http://fasb.org/us-gaap/role/ref/legacyRef
-Topic 210
-SubTopic 10
-Name Accounting Standards Codification
-Section S99
-Paragraph 1
-Subparagraph (SX 210.5-02(28))
-Publisher FASB
-URI https://asc.fasb.org/1943274/2147480566/210-10-S99-1
Reference 3: http://fasb.org/us-gaap/role/ref/legacyRef
-Topic 210
-SubTopic 10
-Name Accounting Standards Codification
-Section S99
-Paragraph 1
-Subparagraph (SX 210.5-02(29))
-Publisher FASB
-URI https://asc.fasb.org/1943274/2147480566/210-10-S99-1
Reference 4: http://www.xbrl.org/2003/role/disclosureRef
-Topic 718
-SubTopic 10
-Name Accounting Standards Codification
-Section 50
-Paragraph 2
-Subparagraph (c)(1)(iv)(02)
-Publisher FASB
-URI https://asc.fasb.org/1943274/2147480429/718-10-50-2
Reference 5: http://fasb.org/us-gaap/role/ref/legacyRef
-Topic 505
-SubTopic 10
-Name Accounting Standards Codification
-Section S99
-Paragraph 1
-Subparagraph (SX 210.3-04)
-Publisher FASB
-URI https://asc.fasb.org/1943274/2147480008/505-10-S99-1
| Name: |
us-gaap_StockIssuedDuringPeriodSharesStockOptionsExercised |
| Namespace Prefix: |
us-gaap_ |
| Data Type: |
xbrli:sharesItemType |
| Balance Type: |
na |
| Period Type: |
duration |
|
v3.25.0.1
| X |
- DefinitionEffect of share based compensation expense on earning per share.
| Name: |
HUSA_EarningsPerShareEffectOfShareBasedCompensationExpense |
| Namespace Prefix: |
HUSA_ |
| Data Type: |
dtr-types:perShareItemType |
| Balance Type: |
na |
| Period Type: |
duration |
|
| X |
- DefinitionAmount of noncash expense for share-based payment arrangement. Reference 1: http://fasb.org/us-gaap/role/ref/legacyRef
-Name Accounting Standards Codification
-Section 45
-Paragraph 28
-Subparagraph (a)
-SubTopic 10
-Topic 230
-Publisher FASB
-URI https://asc.fasb.org/1943274/2147482740/230-10-45-28
| Name: |
us-gaap_ShareBasedCompensation |
| Namespace Prefix: |
us-gaap_ |
| Data Type: |
xbrli:monetaryItemType |
| Balance Type: |
debit |
| Period Type: |
duration |
|
v3.25.0.1
STOCK-BASED COMPENSATION (Details Narrative) - USD ($)
|
1 Months Ended |
12 Months Ended |
|
|
|
Dec. 31, 2024 |
Nov. 30, 2024 |
Jun. 30, 2024 |
Jun. 30, 2023 |
Dec. 31, 2024 |
Dec. 31, 2023 |
Dec. 31, 2021 |
Dec. 31, 2017 |
Dec. 31, 2008 |
| Share-Based Compensation Arrangement by Share-Based Payment Award [Line Items] |
|
|
|
|
|
|
|
|
|
| Number of options granted during period |
|
|
|
|
82,320
|
60,000
|
|
|
|
| Ten-year life exercisable |
$ 2.13
|
|
|
|
$ 2.13
|
|
|
|
|
| Number of non-vested options |
|
|
|
|
65,856
|
|
|
|
|
| Unrecognized share-based compensation expense related to non-vested stock options |
$ 40,790
|
|
|
|
$ 40,790
|
|
|
|
|
| Weighted average period for unrecognition of compensation expense |
|
|
|
|
2 months 26 days
|
|
|
|
|
| Weighted average remaining contractual term of the outstanding options |
|
|
|
|
6 years 1 month 6 days
|
|
|
|
|
| Weighted average remaining contractual term of the exercisable options |
|
|
|
|
5 years 10 months 9 days
|
|
|
|
|
| Issuance of common stock, shares |
|
|
|
|
87,680
|
|
|
|
|
| Directors [Member] |
|
|
|
|
|
|
|
|
|
| Share-Based Compensation Arrangement by Share-Based Payment Award [Line Items] |
|
|
|
|
|
|
|
|
|
| Number of options granted during period |
|
|
60,000
|
60,000
|
|
|
|
|
|
| Weighted average remaining contractual term options, outstanding |
|
|
10 years
|
10 years
|
|
|
|
|
|
| Ten-year life exercisable |
|
|
$ 1.21
|
$ 2.09
|
|
|
|
|
|
| Description on vesting of stock options |
|
|
vest 20% on the date of grant and 80% ten months
from the date of grant.
|
vest 20% on the date of grant and 80% ten months
from the date of grant.
|
|
|
|
|
|
| Fair value of options granted |
|
|
$ 63,730
|
$ 119,252
|
|
|
|
|
|
| Market value of common stock |
|
|
$ 1.21
|
$ 2.09
|
|
|
|
|
|
| Risk free interest rate |
|
|
0.00%
|
0.00%
|
|
|
|
|
|
| Expected dividend yield |
|
|
0.00%
|
0.00%
|
|
|
|
|
|
| Expected stock volatility |
|
|
97.80%
|
116.00%
|
|
|
|
|
|
| Weighted average expected life (in years) |
|
|
10 years
|
10 years
|
|
|
|
|
|
| Expected forfeiture rate |
|
|
0.00%
|
0.00%
|
|
|
|
|
|
| Chief Executive Officer [Member] |
|
|
|
|
|
|
|
|
|
| Share-Based Compensation Arrangement by Share-Based Payment Award [Line Items] |
|
|
|
|
|
|
|
|
|
| Weighted average remaining contractual term options, outstanding |
|
10 years
|
|
|
|
|
|
|
|
| Ten-year life exercisable |
$ 0.73
|
$ 0.76
|
|
|
$ 0.73
|
|
|
|
|
| Description on vesting of stock options |
|
vest
20% on the date of grant and 80% ten months from the date of grant.
|
|
|
|
|
|
|
|
| Fair value of options granted |
$ 13,225
|
$ 14,657
|
|
|
|
|
|
|
|
| Market value of common stock |
$ 1.36
|
$ 1.43
|
|
|
$ 1.36
|
|
|
|
|
| Risk free interest rate |
|
0.00%
|
|
|
|
|
|
|
|
| Expected dividend yield |
|
0.00%
|
|
|
|
|
|
|
|
| Expected stock volatility |
|
92.00%
|
|
|
|
|
|
|
|
| Weighted average expected life (in years) |
|
10 years
|
|
|
|
|
|
|
|
| Expected forfeiture rate |
|
0.00%
|
|
|
|
|
|
|
|
| Number of options granted during period |
|
$ 15,000
|
|
|
|
|
|
|
|
| 2008 Equity Incentive Plan [Member] | Maximum [Member] |
|
|
|
|
|
|
|
|
|
| Share-Based Compensation Arrangement by Share-Based Payment Award [Line Items] |
|
|
|
|
|
|
|
|
|
| Number of options authorized to purchase shares of common stock |
|
|
|
|
|
|
|
|
480,000
|
| 2017 Equity Incentive Plan [Member] | Maximum [Member] |
|
|
|
|
|
|
|
|
|
| Share-Based Compensation Arrangement by Share-Based Payment Award [Line Items] |
|
|
|
|
|
|
|
|
|
| Number of options authorized to purchase shares of common stock |
|
|
|
|
|
|
|
400,000
|
|
| 2021 Equity Incentive Plan [Member] | Maximum [Member] |
|
|
|
|
|
|
|
|
|
| Share-Based Compensation Arrangement by Share-Based Payment Award [Line Items] |
|
|
|
|
|
|
|
|
|
| Number of options authorized to purchase shares of common stock |
|
|
|
|
|
|
500,000
|
|
|
| X |
- DefinitionShare based compensation arrangement by share based payment award fair value assumptions expected forfeited rate.
| Name: |
HUSA_ShareBasedCompensationArrangementByShareBasedPaymentAwardFairValueAssumptionsExpectedForfeitedRate |
| Namespace Prefix: |
HUSA_ |
| Data Type: |
dtr-types:percentItemType |
| Balance Type: |
na |
| Period Type: |
duration |
|
| X |
- DefinitionWeighted-average period over which cost not yet recognized is expected to be recognized for award under share-based payment arrangement, in 'PnYnMnDTnHnMnS' format, for example, 'P1Y5M13D' represents reported fact of one year, five months, and thirteen days. Reference 1: http://www.xbrl.org/2003/role/disclosureRef
-Topic 718
-SubTopic 10
-Name Accounting Standards Codification
-Section 50
-Paragraph 2
-Subparagraph (i)
-Publisher FASB
-URI https://asc.fasb.org/1943274/2147480429/718-10-50-2
| Name: |
us-gaap_EmployeeServiceShareBasedCompensationNonvestedAwardsTotalCompensationCostNotYetRecognizedPeriodForRecognition1 |
| Namespace Prefix: |
us-gaap_ |
| Data Type: |
xbrli:durationItemType |
| Balance Type: |
na |
| Period Type: |
duration |
|
| X |
- DefinitionAmount of cost to be recognized for option under share-based payment arrangement. Reference 1: http://www.xbrl.org/2009/role/commonPracticeRef
-Topic 718
-SubTopic 10
-Name Accounting Standards Codification
-Section 50
-Paragraph 2
-Subparagraph (i)
-Publisher FASB
-URI https://asc.fasb.org/1943274/2147480429/718-10-50-2
| Name: |
us-gaap_EmployeeServiceShareBasedCompensationNonvestedAwardsTotalCompensationCostNotYetRecognizedStockOptions |
| Namespace Prefix: |
us-gaap_ |
| Data Type: |
xbrli:monetaryItemType |
| Balance Type: |
debit |
| Period Type: |
instant |
|
| X |
- DefinitionThe estimated dividend rate (a percentage of the share price) to be paid (expected dividends) to holders of the underlying shares over the option's term. Reference 1: http://www.xbrl.org/2003/role/disclosureRef
-Topic 718
-SubTopic 10
-Name Accounting Standards Codification
-Section 50
-Paragraph 2
-Subparagraph (f)(2)(iii)
-Publisher FASB
-URI https://asc.fasb.org/1943274/2147480429/718-10-50-2
| Name: |
us-gaap_ShareBasedCompensationArrangementByShareBasedPaymentAwardFairValueAssumptionsExpectedDividendRate |
| Namespace Prefix: |
us-gaap_ |
| Data Type: |
dtr-types:percentItemType |
| Balance Type: |
na |
| Period Type: |
duration |
|
| X |
- DefinitionThe estimated measure of the percentage by which a share price is expected to fluctuate during a period. Volatility also may be defined as a probability-weighted measure of the dispersion of returns about the mean. The volatility of a share price is the standard deviation of the continuously compounded rates of return on the share over a specified period. That is the same as the standard deviation of the differences in the natural logarithms of the stock prices plus dividends, if any, over the period. Reference 1: http://www.xbrl.org/2003/role/disclosureRef
-Topic 718
-SubTopic 10
-Name Accounting Standards Codification
-Section 50
-Paragraph 2
-Subparagraph (f)(2)(ii)
-Publisher FASB
-URI https://asc.fasb.org/1943274/2147480429/718-10-50-2
| Name: |
us-gaap_ShareBasedCompensationArrangementByShareBasedPaymentAwardFairValueAssumptionsExpectedVolatilityRate |
| Namespace Prefix: |
us-gaap_ |
| Data Type: |
dtr-types:percentItemType |
| Balance Type: |
na |
| Period Type: |
duration |
|
| X |
- DefinitionThe risk-free interest rate assumption that is used in valuing an option on its own shares. Reference 1: http://www.xbrl.org/2003/role/disclosureRef
-Topic 718
-SubTopic 10
-Name Accounting Standards Codification
-Section 50
-Paragraph 2
-Subparagraph (f)(2)(iv)
-Publisher FASB
-URI https://asc.fasb.org/1943274/2147480429/718-10-50-2
| Name: |
us-gaap_ShareBasedCompensationArrangementByShareBasedPaymentAwardFairValueAssumptionsRiskFreeInterestRate |
| Namespace Prefix: |
us-gaap_ |
| Data Type: |
dtr-types:percentItemType |
| Balance Type: |
na |
| Period Type: |
duration |
|
| X |
- DefinitionLine items represent financial concepts included in a table. These concepts are used to disclose reportable information associated with domain members defined in one or many axes to the table. Reference 1: http://www.xbrl.org/2003/role/disclosureRef
-Topic 718
-SubTopic 10
-Name Accounting Standards Codification
-Section 35
-Paragraph 1D
-Publisher FASB
-URI https://asc.fasb.org/1943274/2147480483/718-10-35-1D
Reference 2: http://www.xbrl.org/2003/role/disclosureRef
-Topic 718
-SubTopic 10
-Name Accounting Standards Codification
-Section 35
-Paragraph 3
-Publisher FASB
-URI https://asc.fasb.org/1943274/2147480483/718-10-35-3
Reference 3: http://www.xbrl.org/2003/role/disclosureRef
-Topic 718
-SubTopic 10
-Name Accounting Standards Codification
-Section 50
-Paragraph 2
-Subparagraph (a)(1)
-Publisher FASB
-URI https://asc.fasb.org/1943274/2147480429/718-10-50-2
Reference 4: http://www.xbrl.org/2003/role/disclosureRef
-Topic 718
-SubTopic 10
-Name Accounting Standards Codification
-Section 50
-Paragraph 2
-Subparagraph (a)(2)
-Publisher FASB
-URI https://asc.fasb.org/1943274/2147480429/718-10-50-2
Reference 5: http://www.xbrl.org/2003/role/disclosureRef
-Topic 718
-SubTopic 10
-Name Accounting Standards Codification
-Section 50
-Paragraph 2
-Subparagraph (a)(3)
-Publisher FASB
-URI https://asc.fasb.org/1943274/2147480429/718-10-50-2
Reference 6: http://www.xbrl.org/2003/role/disclosureRef
-Topic 718
-SubTopic 10
-Name Accounting Standards Codification
-Section 50
-Paragraph 2
-Subparagraph (c)(1)(i)
-Publisher FASB
-URI https://asc.fasb.org/1943274/2147480429/718-10-50-2
Reference 7: http://www.xbrl.org/2003/role/disclosureRef
-Topic 718
-SubTopic 10
-Name Accounting Standards Codification
-Section 50
-Paragraph 2
-Subparagraph (c)(1)(ii)
-Publisher FASB
-URI https://asc.fasb.org/1943274/2147480429/718-10-50-2
Reference 8: http://www.xbrl.org/2003/role/disclosureRef
-Topic 718
-SubTopic 10
-Name Accounting Standards Codification
-Section 50
-Paragraph 2
-Subparagraph (c)(1)(iii)
-Publisher FASB
-URI https://asc.fasb.org/1943274/2147480429/718-10-50-2
Reference 9: http://www.xbrl.org/2003/role/disclosureRef
-Topic 718
-SubTopic 10
-Name Accounting Standards Codification
-Section 50
-Paragraph 2
-Subparagraph (c)(1)(iv)
-Publisher FASB
-URI https://asc.fasb.org/1943274/2147480429/718-10-50-2
Reference 10: http://www.xbrl.org/2003/role/disclosureRef
-Topic 718
-SubTopic 10
-Name Accounting Standards Codification
-Section 50
-Paragraph 2
-Subparagraph (c)(1)(iv)(01)
-Publisher FASB
-URI https://asc.fasb.org/1943274/2147480429/718-10-50-2
Reference 11: http://www.xbrl.org/2003/role/disclosureRef
-Topic 718
-SubTopic 10
-Name Accounting Standards Codification
-Section 50
-Paragraph 2
-Subparagraph (c)(1)(iv)(02)
-Publisher FASB
-URI https://asc.fasb.org/1943274/2147480429/718-10-50-2
Reference 12: http://www.xbrl.org/2003/role/disclosureRef
-Topic 718
-SubTopic 10
-Name Accounting Standards Codification
-Section 50
-Paragraph 2
-Subparagraph (c)(1)(iv)(03)
-Publisher FASB
-URI https://asc.fasb.org/1943274/2147480429/718-10-50-2
Reference 13: http://www.xbrl.org/2003/role/disclosureRef
-Topic 718
-SubTopic 10
-Name Accounting Standards Codification
-Section 50
-Paragraph 2
-Subparagraph (c)(1)(iv)(04)
-Publisher FASB
-URI https://asc.fasb.org/1943274/2147480429/718-10-50-2
Reference 14: http://www.xbrl.org/2003/role/disclosureRef
-Topic 718
-SubTopic 10
-Name Accounting Standards Codification
-Section 50
-Paragraph 2
-Subparagraph (c)(2)(i)
-Publisher FASB
-URI https://asc.fasb.org/1943274/2147480429/718-10-50-2
Reference 15: http://www.xbrl.org/2003/role/disclosureRef
-Topic 718
-SubTopic 10
-Name Accounting Standards Codification
-Section 50
-Paragraph 2
-Subparagraph (c)(2)(ii)
-Publisher FASB
-URI https://asc.fasb.org/1943274/2147480429/718-10-50-2
Reference 16: http://www.xbrl.org/2003/role/disclosureRef
-Topic 718
-SubTopic 10
-Name Accounting Standards Codification
-Section 50
-Paragraph 2
-Subparagraph (c)(2)(iii)
-Publisher FASB
-URI https://asc.fasb.org/1943274/2147480429/718-10-50-2
Reference 17: http://www.xbrl.org/2003/role/disclosureRef
-Topic 718
-SubTopic 10
-Name Accounting Standards Codification
-Section 50
-Paragraph 2
-Subparagraph (c)(2)(iii)(01)
-Publisher FASB
-URI https://asc.fasb.org/1943274/2147480429/718-10-50-2
Reference 18: http://www.xbrl.org/2003/role/disclosureRef
-Topic 718
-SubTopic 10
-Name Accounting Standards Codification
-Section 50
-Paragraph 2
-Subparagraph (c)(2)(iii)(02)
-Publisher FASB
-URI https://asc.fasb.org/1943274/2147480429/718-10-50-2
Reference 19: http://www.xbrl.org/2003/role/disclosureRef
-Topic 718
-SubTopic 10
-Name Accounting Standards Codification
-Section 50
-Paragraph 2
-Subparagraph (c)(2)(iii)(03)
-Publisher FASB
-URI https://asc.fasb.org/1943274/2147480429/718-10-50-2
Reference 20: http://www.xbrl.org/2003/role/disclosureRef
-Topic 718
-SubTopic 10
-Name Accounting Standards Codification
-Section 50
-Paragraph 2
-Subparagraph (d)(1)
-Publisher FASB
-URI https://asc.fasb.org/1943274/2147480429/718-10-50-2
Reference 21: http://www.xbrl.org/2003/role/disclosureRef
-Topic 718
-SubTopic 10
-Name Accounting Standards Codification
-Section 50
-Paragraph 2
-Subparagraph (d)(2)
-Publisher FASB
-URI https://asc.fasb.org/1943274/2147480429/718-10-50-2
Reference 22: http://www.xbrl.org/2003/role/disclosureRef
-Topic 718
-SubTopic 10
-Name Accounting Standards Codification
-Section 50
-Paragraph 2
-Subparagraph (e)(1)
-Publisher FASB
-URI https://asc.fasb.org/1943274/2147480429/718-10-50-2
Reference 23: http://www.xbrl.org/2003/role/disclosureRef
-Topic 718
-SubTopic 10
-Name Accounting Standards Codification
-Section 50
-Paragraph 2
-Subparagraph (e)(2)
-Publisher FASB
-URI https://asc.fasb.org/1943274/2147480429/718-10-50-2
Reference 24: http://www.xbrl.org/2003/role/disclosureRef
-Topic 718
-SubTopic 10
-Name Accounting Standards Codification
-Section 50
-Paragraph 2
-Subparagraph (f)(2)(i)
-Publisher FASB
-URI https://asc.fasb.org/1943274/2147480429/718-10-50-2
Reference 25: http://www.xbrl.org/2003/role/disclosureRef
-Topic 718
-SubTopic 10
-Name Accounting Standards Codification
-Section 50
-Paragraph 2
-Subparagraph (f)(2)(ii)
-Publisher FASB
-URI https://asc.fasb.org/1943274/2147480429/718-10-50-2
Reference 26: http://www.xbrl.org/2003/role/disclosureRef
-Topic 718
-SubTopic 10
-Name Accounting Standards Codification
-Section 50
-Paragraph 2
-Subparagraph (f)(2)(iii)
-Publisher FASB
-URI https://asc.fasb.org/1943274/2147480429/718-10-50-2
Reference 27: http://www.xbrl.org/2003/role/disclosureRef
-Topic 718
-SubTopic 10
-Name Accounting Standards Codification
-Section 50
-Paragraph 2
-Subparagraph (f)(2)(iv)
-Publisher FASB
-URI https://asc.fasb.org/1943274/2147480429/718-10-50-2
Reference 28: http://www.xbrl.org/2003/role/disclosureRef
-Topic 718
-SubTopic 10
-Name Accounting Standards Codification
-Section 50
-Paragraph 2
-Subparagraph (f)(2)(v)
-Publisher FASB
-URI https://asc.fasb.org/1943274/2147480429/718-10-50-2
| Name: |
us-gaap_ShareBasedCompensationArrangementByShareBasedPaymentAwardLineItems |
| Namespace Prefix: |
us-gaap_ |
| Data Type: |
xbrli:stringItemType |
| Balance Type: |
na |
| Period Type: |
duration |
|
| X |
- DefinitionNumber of shares authorized for issuance under share-based payment arrangement. Reference 1: http://www.xbrl.org/2003/role/exampleRef
-Topic 718
-SubTopic 10
-Name Accounting Standards Codification
-Section 50
-Paragraph 2
-Subparagraph (a)(3)
-Publisher FASB
-URI https://asc.fasb.org/1943274/2147480429/718-10-50-2
| Name: |
us-gaap_ShareBasedCompensationArrangementByShareBasedPaymentAwardNumberOfSharesAuthorized |
| Namespace Prefix: |
us-gaap_ |
| Data Type: |
xbrli:sharesItemType |
| Balance Type: |
na |
| Period Type: |
instant |
|
| X |
- DefinitionThe weighted-average price as of the balance sheet date at which grantees can acquire the shares reserved for issuance on vested portions of options outstanding and currently exercisable under the stock option plan. Reference 1: http://www.xbrl.org/2003/role/disclosureRef
-Topic 718
-SubTopic 10
-Name Accounting Standards Codification
-Section 50
-Paragraph 2
-Subparagraph (c)(1)(iii)
-Publisher FASB
-URI https://asc.fasb.org/1943274/2147480429/718-10-50-2
| Name: |
us-gaap_ShareBasedCompensationArrangementByShareBasedPaymentAwardOptionsExercisableWeightedAverageExercisePrice |
| Namespace Prefix: |
us-gaap_ |
| Data Type: |
dtr-types:perShareItemType |
| Balance Type: |
na |
| Period Type: |
instant |
|
| X |
- DefinitionGross number of share options (or share units) granted during the period. Reference 1: http://www.xbrl.org/2003/role/disclosureRef
-Topic 718
-SubTopic 10
-Name Accounting Standards Codification
-Section 50
-Paragraph 2
-Subparagraph (c)(1)(iv)(01)
-Publisher FASB
-URI https://asc.fasb.org/1943274/2147480429/718-10-50-2
| Name: |
us-gaap_ShareBasedCompensationArrangementByShareBasedPaymentAwardOptionsGrantsInPeriodGross |
| Namespace Prefix: |
us-gaap_ |
| Data Type: |
xbrli:sharesItemType |
| Balance Type: |
na |
| Period Type: |
duration |
|
| X |
- DefinitionDescription of terms of award under share-based payment arrangement. Reference 1: http://fasb.org/us-gaap/role/ref/legacyRef
-Name Accounting Standards Codification
-Topic 718
-SubTopic 10
-Section 50
-Paragraph 2
-Subparagraph (a)
-Publisher FASB
-URI https://asc.fasb.org/1943274/2147480429/718-10-50-2
| Name: |
us-gaap_ShareBasedCompensationArrangementByShareBasedPaymentAwardTermsOfAward |
| Namespace Prefix: |
us-gaap_ |
| Data Type: |
xbrli:stringItemType |
| Balance Type: |
na |
| Period Type: |
duration |
|
| X |
- DefinitionPrice of a single share of a number of saleable stocks of a company.
| Name: |
us-gaap_SharePrice |
| Namespace Prefix: |
us-gaap_ |
| Data Type: |
dtr-types:perShareItemType |
| Balance Type: |
na |
| Period Type: |
instant |
|
| X |
- DefinitionExpected term of award under share-based payment arrangement, in 'PnYnMnDTnHnMnS' format, for example, 'P1Y5M13D' represents reported fact of one year, five months, and thirteen days. Reference 1: http://www.xbrl.org/2003/role/disclosureRef
-Topic 718
-SubTopic 10
-Name Accounting Standards Codification
-Section 50
-Paragraph 2
-Subparagraph (f)(2)(i)
-Publisher FASB
-URI https://asc.fasb.org/1943274/2147480429/718-10-50-2
| Name: |
us-gaap_SharebasedCompensationArrangementBySharebasedPaymentAwardFairValueAssumptionsExpectedTerm1 |
| Namespace Prefix: |
us-gaap_ |
| Data Type: |
xbrli:durationItemType |
| Balance Type: |
na |
| Period Type: |
duration |
|
| X |
- DefinitionWeighted average remaining contractual term for vested portions of options outstanding and currently exercisable or convertible, in 'PnYnMnDTnHnMnS' format, for example, 'P1Y5M13D' represents the reported fact of one year, five months, and thirteen days. Reference 1: http://fasb.org/us-gaap/role/ref/legacyRef
-Name Accounting Standards Codification
-Topic 718
-SubTopic 10
-Section 50
-Paragraph 2
-Publisher FASB
-URI https://asc.fasb.org/1943274/2147480429/718-10-50-2
| Name: |
us-gaap_SharebasedCompensationArrangementBySharebasedPaymentAwardOptionsExercisableWeightedAverageRemainingContractualTerm1 |
| Namespace Prefix: |
us-gaap_ |
| Data Type: |
xbrli:durationItemType |
| Balance Type: |
na |
| Period Type: |
duration |
|
| X |
- DefinitionWeighted average remaining contractual term for option awards outstanding, in 'PnYnMnDTnHnMnS' format, for example, 'P1Y5M13D' represents the reported fact of one year, five months, and thirteen days. Reference 1: http://fasb.org/us-gaap/role/ref/legacyRef
-Topic 718
-SubTopic 10
-Subparagraph (e)(1)
-Name Accounting Standards Codification
-Paragraph 2
-Section 50
-Publisher FASB
-URI https://asc.fasb.org/1943274/2147480429/718-10-50-2
| Name: |
us-gaap_SharebasedCompensationArrangementBySharebasedPaymentAwardOptionsOutstandingWeightedAverageRemainingContractualTerm2 |
| Namespace Prefix: |
us-gaap_ |
| Data Type: |
xbrli:durationItemType |
| Balance Type: |
na |
| Period Type: |
duration |
|
| X |
- DefinitionFair value of options vested. Excludes equity instruments other than options, for example, but not limited to, share units, stock appreciation rights, restricted stock. Reference 1: http://www.xbrl.org/2003/role/disclosureRef
-Topic 718
-SubTopic 10
-Name Accounting Standards Codification
-Section 50
-Paragraph 2
-Subparagraph (d)(2)
-Publisher FASB
-URI https://asc.fasb.org/1943274/2147480429/718-10-50-2
| Name: |
us-gaap_SharebasedCompensationArrangementBySharebasedPaymentAwardOptionsVestedInPeriodFairValue1 |
| Namespace Prefix: |
us-gaap_ |
| Data Type: |
xbrli:monetaryItemType |
| Balance Type: |
credit |
| Period Type: |
duration |
|
| X |
- DefinitionNumber of options vested.
| Name: |
us-gaap_SharebasedCompensationArrangementBySharebasedPaymentAwardOptionsVestedNumberOfShares |
| Namespace Prefix: |
us-gaap_ |
| Data Type: |
xbrli:sharesItemType |
| Balance Type: |
na |
| Period Type: |
duration |
|
| X |
- DefinitionWeighted average remaining contractual term of outstanding stock options, in 'PnYnMnDTnHnMnS' format, for example, 'P1Y5M13D' represents the reported fact of one year, five months, and thirteen days. Reference 1: http://fasb.org/us-gaap/role/ref/legacyRef
-Topic 718
-SubTopic 10
-Subparagraph (e)(1)
-Name Accounting Standards Codification
-Paragraph 2
-Section 50
-Publisher FASB
-URI https://asc.fasb.org/1943274/2147480429/718-10-50-2
| Name: |
us-gaap_SharebasedCompensationSharesAuthorizedUnderStockOptionPlansExercisePriceRangeOutstandingOptionsWeightedAverageRemainingContractualTerm2 |
| Namespace Prefix: |
us-gaap_ |
| Data Type: |
xbrli:durationItemType |
| Balance Type: |
na |
| Period Type: |
duration |
|
| X |
- DefinitionNumber of new stock issued during the period. Reference 1: http://fasb.org/us-gaap/role/ref/legacyRef
-Name Accounting Standards Codification
-Section 50
-Paragraph 2
-SubTopic 10
-Topic 505
-Publisher FASB
-URI https://asc.fasb.org/1943274/2147481112/505-10-50-2
Reference 2: http://fasb.org/us-gaap/role/ref/legacyRef
-Topic 210
-SubTopic 10
-Name Accounting Standards Codification
-Section S99
-Paragraph 1
-Subparagraph (SX 210.5-02(28))
-Publisher FASB
-URI https://asc.fasb.org/1943274/2147480566/210-10-S99-1
Reference 3: http://fasb.org/us-gaap/role/ref/legacyRef
-Topic 210
-SubTopic 10
-Name Accounting Standards Codification
-Section S99
-Paragraph 1
-Subparagraph (SX 210.5-02(29))
-Publisher FASB
-URI https://asc.fasb.org/1943274/2147480566/210-10-S99-1
Reference 4: http://www.xbrl.org/2003/role/disclosureRef
-Topic 946
-SubTopic 505
-Name Accounting Standards Codification
-Section 50
-Paragraph 2
-Subparagraph (a)
-Publisher FASB
-URI https://asc.fasb.org/1943274/2147478448/946-505-50-2
Reference 5: http://www.xbrl.org/2003/role/disclosureRef
-Topic 946
-SubTopic 220
-Name Accounting Standards Codification
-Section S99
-Paragraph 3
-Subparagraph (SX 210.6-09(4)(b))
-Publisher FASB
-URI https://asc.fasb.org/1943274/2147479134/946-220-S99-3
Reference 6: http://www.xbrl.org/2003/role/disclosureRef
-Topic 946
-SubTopic 10
-Name Accounting Standards Codification
-Section S99
-Paragraph 3
-Subparagraph (SX 210.6-03(i)(1))
-Publisher FASB
-URI https://asc.fasb.org/1943274/2147479886/946-10-S99-3
Reference 7: http://fasb.org/us-gaap/role/ref/legacyRef
-Topic 505
-SubTopic 10
-Name Accounting Standards Codification
-Section S99
-Paragraph 1
-Subparagraph (SX 210.3-04)
-Publisher FASB
-URI https://asc.fasb.org/1943274/2147480008/505-10-S99-1
| Name: |
us-gaap_StockIssuedDuringPeriodSharesNewIssues |
| Namespace Prefix: |
us-gaap_ |
| Data Type: |
xbrli:sharesItemType |
| Balance Type: |
na |
| Period Type: |
duration |
|
| X |
- DefinitionValue, before forfeiture, of shares issued under share-based payment arrangement. Excludes employee stock ownership plan (ESOP).
| Name: |
us-gaap_StockIssuedDuringPeriodValueShareBasedCompensationGross |
| Namespace Prefix: |
us-gaap_ |
| Data Type: |
xbrli:monetaryItemType |
| Balance Type: |
credit |
| Period Type: |
duration |
|
| X |
- Details
| Name: |
srt_TitleOfIndividualAxis=HUSA_DirectorsMember |
| Namespace Prefix: |
|
| Data Type: |
na |
| Balance Type: |
|
| Period Type: |
|
|
| X |
- Details
| Name: |
srt_TitleOfIndividualAxis=srt_ChiefExecutiveOfficerMember |
| Namespace Prefix: |
|
| Data Type: |
na |
| Balance Type: |
|
| Period Type: |
|
|
| X |
- Details
| Name: |
us-gaap_PlanNameAxis=HUSA_TwoThousandAndEightEquityIncentivePlanMember |
| Namespace Prefix: |
|
| Data Type: |
na |
| Balance Type: |
|
| Period Type: |
|
|
| X |
- Details
| Name: |
srt_RangeAxis=srt_MaximumMember |
| Namespace Prefix: |
|
| Data Type: |
na |
| Balance Type: |
|
| Period Type: |
|
|
| X |
- Details
| Name: |
us-gaap_PlanNameAxis=HUSA_TwoThousandAndSeventeenEquityIncentivePlanMember |
| Namespace Prefix: |
|
| Data Type: |
na |
| Balance Type: |
|
| Period Type: |
|
|
| X |
- Details
| Name: |
us-gaap_PlanNameAxis=HUSA_TwoThousandAndTwentyOneEquityIncentivePlanMember |
| Namespace Prefix: |
|
| Data Type: |
na |
| Balance Type: |
|
| Period Type: |
|
|
v3.25.0.1
SUMMARY OF WARRANT ACTIVITY (Details) - USD ($)
|
12 Months Ended |
Dec. 31, 2024 |
Dec. 31, 2023 |
| Equity [Abstract] |
|
|
| Warrants Outstanding, Beginning |
94,400
|
94,400
|
| Weighted-Average Exercise Price Outstanding, Beginning |
$ 2.50
|
$ 2.50
|
| Warrants Outstanding, Beginning |
|
|
| Weighted-Average Exercise Price Outstanding, Beginning |
|
|
| Warrants Outstanding, Beginning |
|
|
| Weighted-Average Exercise Price Outstanding, Beginning |
|
|
| Warrants Outstanding, Beginning |
|
|
| Weighted-Average Exercise Price Outstanding, Beginning |
|
|
| Warrants Outstanding, Beginning |
94,400
|
94,400
|
| Weighted-Average Exercise Price Outstanding, Beginning |
$ 2.50
|
$ 2.50
|
| [custom:ShareBasedCompensationArrangementByShareBasedPaymentAwardOptionsOutstandingWarrantIntrinsicValue-0] |
|
|
| Warrants Outstanding, Beginning |
94,400
|
|
| Weighted-Average Exercise Price Outstanding, Beginning |
$ 2.50
|
|
| [custom:SharebasedCompensationArrangementBySharebasedPaymentAwardOptionsWarrantsExercisableIntrinsicValue1-0] |
|
|
| X |
- DefinitionShare-based Compensation Arrangement by Share-based Payment Award, Non-Option Equity Instruments, Exercisable.
| Name: |
HUSA_ShareBasedCompensationArrangementByShareBasedPaymentAwardNonOptionEquityInstrumentsExercisableNumber |
| Namespace Prefix: |
HUSA_ |
| Data Type: |
xbrli:sharesItemType |
| Balance Type: |
na |
| Period Type: |
instant |
|
| X |
- DefinitionShare based compensation arrangement by share based payment award non option exercised in period exercise price.
| Name: |
HUSA_ShareBasedCompensationArrangementByShareBasedPaymentAwardNonOptionExercisedInPeriodExercisePrice |
| Namespace Prefix: |
HUSA_ |
| Data Type: |
dtr-types:perShareItemType |
| Balance Type: |
na |
| Period Type: |
duration |
|
| X |
- DefinitionShareBased Compensation Arrangement by ShareBased Payment Award Non Option Forfeited Or Expired in Period Exercise Price.
| Name: |
HUSA_ShareBasedCompensationArrangementByShareBasedPaymentAwardNonOptionForfeitedOrExpiredInPeriodExercisePrice |
| Namespace Prefix: |
HUSA_ |
| Data Type: |
dtr-types:perShareItemType |
| Balance Type: |
na |
| Period Type: |
duration |
|
| X |
- DefinitionShare based compensation arrangement by share based payment award non option grand in period exercise price.
| Name: |
HUSA_ShareBasedCompensationArrangementByShareBasedPaymentAwardNonOptionGrantsInPeriodExercisePrice |
| Namespace Prefix: |
HUSA_ |
| Data Type: |
dtr-types:perShareItemType |
| Balance Type: |
na |
| Period Type: |
duration |
|
| X |
- DefinitionShare based compensation arrangement by share based payment award non option outstanding exercisable weighted average exercise price.
| Name: |
HUSA_ShareBasedCompensationArrangementByShareBasedPaymentAwardNonOptionOutstandingExercisableWeightedAverageExercisePrice |
| Namespace Prefix: |
HUSA_ |
| Data Type: |
dtr-types:perShareItemType |
| Balance Type: |
na |
| Period Type: |
instant |
|
| X |
- DefinitionShareBased Compensation Arrangement By ShareBased Payment Award NonOption Outstanding Exercise Price Rage Number of Share.
| Name: |
HUSA_ShareBasedCompensationArrangementByShareBasedPaymentAwardNonOptionOutstandingExercisePriceRageNumberOfShare |
| Namespace Prefix: |
HUSA_ |
| Data Type: |
dtr-types:perShareItemType |
| Balance Type: |
na |
| Period Type: |
instant |
|
| X |
- DefinitionShare based compensation arrangement by share based payment award options outstanding warrant intrinsic value.
| Name: |
HUSA_ShareBasedCompensationArrangementByShareBasedPaymentAwardOptionsOutstandingWarrantIntrinsicValue |
| Namespace Prefix: |
HUSA_ |
| Data Type: |
xbrli:monetaryItemType |
| Balance Type: |
debit |
| Period Type: |
instant |
|
| X |
- DefinitionShare based compensation arrangement by share based payment award options outstanding warrant intrinsic exercised.
| Name: |
HUSA_SharebasedCompensationArrangementBySharebasedPaymentAwardOptionsWarrantsExercisableIntrinsicValue1 |
| Namespace Prefix: |
HUSA_ |
| Data Type: |
xbrli:monetaryItemType |
| Balance Type: |
debit |
| Period Type: |
instant |
|
| X |
- References
+ Details
| Name: |
us-gaap_EquityAbstract |
| Namespace Prefix: |
us-gaap_ |
| Data Type: |
xbrli:stringItemType |
| Balance Type: |
na |
| Period Type: |
duration |
|
| X |
- DefinitionNumber of non-option equity instruments exercised by participants. Reference 1: http://fasb.org/us-gaap/role/ref/legacyRef
-Name Accounting Standards Codification
-Section 50
-Paragraph 2
-Subparagraph (c)(1)(iv)(02)
-SubTopic 10
-Topic 718
-Publisher FASB
-URI https://asc.fasb.org/1943274/2147480429/718-10-50-2
| Name: |
us-gaap_ShareBasedCompensationArrangementByShareBasedPaymentAwardNonOptionEquityInstrumentsExercised |
| Namespace Prefix: |
us-gaap_ |
| Data Type: |
xbrli:sharesItemType |
| Balance Type: |
na |
| Period Type: |
duration |
|
| X |
- DefinitionNumber of shares under non-option equity instrument agreements that were either cancelled or expired. Reference 1: http://fasb.org/us-gaap/role/ref/legacyRef
-Topic 718
-SubTopic 10
-Name Accounting Standards Codification
-Section 50
-Paragraph 2
-Subparagraph (c)(1)(iv)(04)
-Publisher FASB
-URI https://asc.fasb.org/1943274/2147480429/718-10-50-2
Reference 2: http://fasb.org/us-gaap/role/ref/legacyRef
-Topic 718
-SubTopic 10
-Name Accounting Standards Codification
-Section 50
-Paragraph 2
-Subparagraph (c)(1)(iv)(03)
-Publisher FASB
-URI https://asc.fasb.org/1943274/2147480429/718-10-50-2
| Name: |
us-gaap_ShareBasedCompensationArrangementByShareBasedPaymentAwardNonOptionEquityInstrumentsForfeituresAndExpirations |
| Namespace Prefix: |
us-gaap_ |
| Data Type: |
xbrli:sharesItemType |
| Balance Type: |
na |
| Period Type: |
duration |
|
| X |
- DefinitionNet number of non-option equity instruments granted to participants. Reference 1: http://fasb.org/us-gaap/role/ref/legacyRef
-Name Accounting Standards Codification
-Section 50
-Paragraph 2
-Subparagraph (c)(1)(iv)(01)
-SubTopic 10
-Topic 718
-Publisher FASB
-URI https://asc.fasb.org/1943274/2147480429/718-10-50-2
| Name: |
us-gaap_ShareBasedCompensationArrangementByShareBasedPaymentAwardNonOptionEquityInstrumentsGranted |
| Namespace Prefix: |
us-gaap_ |
| Data Type: |
xbrli:sharesItemType |
| Balance Type: |
na |
| Period Type: |
duration |
|
| X |
- DefinitionNumber of equity instruments other than options outstanding, including both vested and non-vested instruments. Reference 1: http://fasb.org/us-gaap/role/ref/legacyRef
-Topic 718
-SubTopic 10
-Name Accounting Standards Codification
-Section 50
-Paragraph 2
-Subparagraph (c)(1)(ii)
-Publisher FASB
-URI https://asc.fasb.org/1943274/2147480429/718-10-50-2
Reference 2: http://fasb.org/us-gaap/role/ref/legacyRef
-Topic 718
-SubTopic 10
-Name Accounting Standards Codification
-Section 50
-Paragraph 2
-Subparagraph (c)(1)(i)
-Publisher FASB
-URI https://asc.fasb.org/1943274/2147480429/718-10-50-2
| Name: |
us-gaap_ShareBasedCompensationArrangementByShareBasedPaymentAwardNonOptionEquityInstrumentsOutstandingNumber |
| Namespace Prefix: |
us-gaap_ |
| Data Type: |
xbrli:sharesItemType |
| Balance Type: |
na |
| Period Type: |
instant |
|
v3.25.0.1
CAPITAL STOCK (Details Narrative) - USD ($)
|
1 Months Ended |
12 Months Ended |
Nov. 30, 2022 |
Sep. 30, 2019 |
Dec. 31, 2024 |
Dec. 31, 2023 |
| Bridge Loan Warrants [Member] |
|
|
|
|
| Accumulated Other Comprehensive Income (Loss) [Line Items] |
|
|
|
|
| Expected life (in years) |
|
10 years
|
|
|
| Warrants expiration date |
|
Sep. 18, 2029
|
|
|
| Number of warrants issued to purchase common stock |
|
94,400
|
|
|
| Warrants exercise price |
|
$ 2.50
|
|
|
| Warrants fair value |
|
$ 144,948
|
|
|
| Risk free interest rate |
|
1.80%
|
|
|
| Expected stock volatility |
|
82.90%
|
|
|
| Expected dividend yield |
|
0.00%
|
|
|
| 2022 ATM Offering [Member] |
|
|
|
|
| Accumulated Other Comprehensive Income (Loss) [Line Items] |
|
|
|
|
| Sale of stock shares of common stock value |
|
|
|
$ 1,700,000
|
| Number shares sold |
|
|
2,180,180
|
578,707
|
| 2022 ATM Offering [Member] | West Park Capital LLC [Member] | Maximum [Member] |
|
|
|
|
| Accumulated Other Comprehensive Income (Loss) [Line Items] |
|
|
|
|
| Sale of stock shares of common stock value |
$ 3,500,000
|
|
|
|
| 2021 ATM Offering [Member] |
|
|
|
|
| Accumulated Other Comprehensive Income (Loss) [Line Items] |
|
|
|
|
| Sale of stock shares of common stock value |
|
|
$ 2,300,000
|
|
| X |
- DefinitionLine items represent financial concepts included in a table. These concepts are used to disclose reportable information associated with domain members defined in one or many axes to the table. Reference 1: http://www.xbrl.org/2003/role/disclosureRef
-Topic 220
-SubTopic 10
-Name Accounting Standards Codification
-Section 50
-Paragraph 4
-Publisher FASB
-URI https://asc.fasb.org/1943274/2147482765/220-10-50-4
Reference 2: http://www.xbrl.org/2003/role/disclosureRef
-Topic 220
-SubTopic 10
-Name Accounting Standards Codification
-Section 50
-Paragraph 5
-Publisher FASB
-URI https://asc.fasb.org/1943274/2147482765/220-10-50-5
Reference 3: http://www.xbrl.org/2003/role/disclosureRef
-Topic 830
-SubTopic 30
-Name Accounting Standards Codification
-Section 50
-Paragraph 1
-Publisher FASB
-URI https://asc.fasb.org/1943274/2147481674/830-30-50-1
Reference 4: http://www.xbrl.org/2003/role/disclosureRef
-Topic 830
-SubTopic 30
-Name Accounting Standards Codification
-Section 45
-Paragraph 17
-Publisher FASB
-URI https://asc.fasb.org/1943274/2147481694/830-30-45-17
Reference 5: http://www.xbrl.org/2003/role/disclosureRef
-Topic 830
-SubTopic 30
-Name Accounting Standards Codification
-Section 45
-Paragraph 20
-Subparagraph (a)
-Publisher FASB
-URI https://asc.fasb.org/1943274/2147481694/830-30-45-20
Reference 6: http://www.xbrl.org/2003/role/disclosureRef
-Topic 830
-SubTopic 30
-Name Accounting Standards Codification
-Section 45
-Paragraph 20
-Subparagraph (b)
-Publisher FASB
-URI https://asc.fasb.org/1943274/2147481694/830-30-45-20
Reference 7: http://www.xbrl.org/2003/role/disclosureRef
-Topic 830
-SubTopic 30
-Name Accounting Standards Codification
-Section 45
-Paragraph 20
-Subparagraph (c)
-Publisher FASB
-URI https://asc.fasb.org/1943274/2147481694/830-30-45-20
Reference 8: http://www.xbrl.org/2003/role/disclosureRef
-Topic 830
-SubTopic 30
-Name Accounting Standards Codification
-Section 45
-Paragraph 20
-Subparagraph (d)
-Publisher FASB
-URI https://asc.fasb.org/1943274/2147481694/830-30-45-20
| Name: |
us-gaap_AccumulatedOtherComprehensiveIncomeLossLineItems |
| Namespace Prefix: |
us-gaap_ |
| Data Type: |
xbrli:stringItemType |
| Balance Type: |
na |
| Period Type: |
duration |
|
| X |
- DefinitionExercise price per share or per unit of warrants or rights outstanding. Reference 1: http://www.xbrl.org/2003/role/disclosureRef
-Topic 505
-SubTopic 10
-Name Accounting Standards Codification
-Section 50
-Paragraph 3
-Publisher FASB
-URI https://asc.fasb.org/1943274/2147481112/505-10-50-3
| Name: |
us-gaap_ClassOfWarrantOrRightExercisePriceOfWarrantsOrRights1 |
| Namespace Prefix: |
us-gaap_ |
| Data Type: |
dtr-types:perShareItemType |
| Balance Type: |
na |
| Period Type: |
instant |
|
| X |
- DefinitionNumber of securities into which each warrant or right may be converted. For example, but not limited to, each warrant may be converted into two shares.
| Name: |
us-gaap_ClassOfWarrantOrRightNumberOfSecuritiesCalledByEachWarrantOrRight |
| Namespace Prefix: |
us-gaap_ |
| Data Type: |
xbrli:sharesItemType |
| Balance Type: |
na |
| Period Type: |
instant |
|
| X |
- DefinitionAmount of expense (income) related to adjustment to fair value of warrant liability. Reference 1: http://fasb.org/us-gaap/role/ref/legacyRef
-Name Accounting Standards Codification
-Section 45
-Paragraph 28
-Subparagraph (b)
-SubTopic 10
-Topic 230
-Publisher FASB
-URI https://asc.fasb.org/1943274/2147482740/230-10-45-28
Reference 2: http://fasb.org/us-gaap/role/ref/legacyRef
-Name Accounting Standards Codification
-Section 25
-Paragraph 13
-SubTopic 10
-Topic 480
-Publisher FASB
-URI https://asc.fasb.org/1943274/2147481766/480-10-25-13
| Name: |
us-gaap_FairValueAdjustmentOfWarrants |
| Namespace Prefix: |
us-gaap_ |
| Data Type: |
xbrli:monetaryItemType |
| Balance Type: |
debit |
| Period Type: |
duration |
|
| X |
- DefinitionCash received on stock transaction after deduction of issuance costs.
| Name: |
us-gaap_SaleOfStockConsiderationReceivedOnTransaction |
| Namespace Prefix: |
us-gaap_ |
| Data Type: |
xbrli:monetaryItemType |
| Balance Type: |
debit |
| Period Type: |
duration |
|
| X |
- DefinitionThe number of shares issued or sold by the subsidiary or equity method investee per stock transaction.
| Name: |
us-gaap_SaleOfStockNumberOfSharesIssuedInTransaction |
| Namespace Prefix: |
us-gaap_ |
| Data Type: |
xbrli:sharesItemType |
| Balance Type: |
na |
| Period Type: |
duration |
|
| X |
- DefinitionThe estimated dividend rate (a percentage of the share price) to be paid (expected dividends) to holders of the underlying shares over the option's term. Reference 1: http://www.xbrl.org/2003/role/disclosureRef
-Topic 718
-SubTopic 10
-Name Accounting Standards Codification
-Section 50
-Paragraph 2
-Subparagraph (f)(2)(iii)
-Publisher FASB
-URI https://asc.fasb.org/1943274/2147480429/718-10-50-2
| Name: |
us-gaap_ShareBasedCompensationArrangementByShareBasedPaymentAwardFairValueAssumptionsExpectedDividendRate |
| Namespace Prefix: |
us-gaap_ |
| Data Type: |
dtr-types:percentItemType |
| Balance Type: |
na |
| Period Type: |
duration |
|
| X |
- DefinitionThe estimated measure of the percentage by which a share price is expected to fluctuate during a period. Volatility also may be defined as a probability-weighted measure of the dispersion of returns about the mean. The volatility of a share price is the standard deviation of the continuously compounded rates of return on the share over a specified period. That is the same as the standard deviation of the differences in the natural logarithms of the stock prices plus dividends, if any, over the period. Reference 1: http://www.xbrl.org/2003/role/disclosureRef
-Topic 718
-SubTopic 10
-Name Accounting Standards Codification
-Section 50
-Paragraph 2
-Subparagraph (f)(2)(ii)
-Publisher FASB
-URI https://asc.fasb.org/1943274/2147480429/718-10-50-2
| Name: |
us-gaap_ShareBasedCompensationArrangementByShareBasedPaymentAwardFairValueAssumptionsExpectedVolatilityRate |
| Namespace Prefix: |
us-gaap_ |
| Data Type: |
dtr-types:percentItemType |
| Balance Type: |
na |
| Period Type: |
duration |
|
| X |
- DefinitionThe risk-free interest rate assumption that is used in valuing an option on its own shares. Reference 1: http://www.xbrl.org/2003/role/disclosureRef
-Topic 718
-SubTopic 10
-Name Accounting Standards Codification
-Section 50
-Paragraph 2
-Subparagraph (f)(2)(iv)
-Publisher FASB
-URI https://asc.fasb.org/1943274/2147480429/718-10-50-2
| Name: |
us-gaap_ShareBasedCompensationArrangementByShareBasedPaymentAwardFairValueAssumptionsRiskFreeInterestRate |
| Namespace Prefix: |
us-gaap_ |
| Data Type: |
dtr-types:percentItemType |
| Balance Type: |
na |
| Period Type: |
duration |
|
| X |
- DefinitionExpected term of award under share-based payment arrangement, in 'PnYnMnDTnHnMnS' format, for example, 'P1Y5M13D' represents reported fact of one year, five months, and thirteen days. Reference 1: http://www.xbrl.org/2003/role/disclosureRef
-Topic 718
-SubTopic 10
-Name Accounting Standards Codification
-Section 50
-Paragraph 2
-Subparagraph (f)(2)(i)
-Publisher FASB
-URI https://asc.fasb.org/1943274/2147480429/718-10-50-2
| Name: |
us-gaap_SharebasedCompensationArrangementBySharebasedPaymentAwardFairValueAssumptionsExpectedTerm1 |
| Namespace Prefix: |
us-gaap_ |
| Data Type: |
xbrli:durationItemType |
| Balance Type: |
na |
| Period Type: |
duration |
|
| X |
- DefinitionExpiration date of outstanding warrant and right embodying unconditional obligation requiring redemption by transferring asset at specified or determinable date or upon event certain to occur, in YYYY-MM-DD format. Reference 1: http://www.xbrl.org/2009/role/commonPracticeRef
-Topic 820
-SubTopic 10
-Name Accounting Standards Codification
-Section 50
-Paragraph 2
-Subparagraph (bbb)(2)(i)
-Publisher FASB
-URI https://asc.fasb.org/1943274/2147482106/820-10-50-2
Reference 2: http://www.xbrl.org/2009/role/commonPracticeRef
-Topic 820
-SubTopic 10
-Name Accounting Standards Codification
-Section 50
-Paragraph 2
-Subparagraph (bbb)(2)
-Publisher FASB
-URI https://asc.fasb.org/1943274/2147482106/820-10-50-2
Reference 3: http://www.xbrl.org/2009/role/commonPracticeRef
-Topic 820
-SubTopic 10
-Name Accounting Standards Codification
-Section 50
-Paragraph 2
-Subparagraph (bbb)(1)
-Publisher FASB
-URI https://asc.fasb.org/1943274/2147482106/820-10-50-2
| Name: |
us-gaap_WarrantsAndRightsOutstandingMaturityDate |
| Namespace Prefix: |
us-gaap_ |
| Data Type: |
xbrli:dateItemType |
| Balance Type: |
na |
| Period Type: |
instant |
|
| X |
- Details
| Name: |
us-gaap_StatementEquityComponentsAxis=HUSA_BridgeLoanWarrantsMember |
| Namespace Prefix: |
|
| Data Type: |
na |
| Balance Type: |
|
| Period Type: |
|
|
| X |
- Details
| Name: |
us-gaap_TypeOfArrangementAxis=HUSA_SalesAgreementTwoThousandTwentyTwoATMOfferingMember |
| Namespace Prefix: |
|
| Data Type: |
na |
| Balance Type: |
|
| Period Type: |
|
|
| X |
- Details
| Name: |
dei_LegalEntityAxis=HUSA_WestParkCapitalLLCMember |
| Namespace Prefix: |
|
| Data Type: |
na |
| Balance Type: |
|
| Period Type: |
|
|
| X |
- Details
| Name: |
srt_RangeAxis=srt_MaximumMember |
| Namespace Prefix: |
|
| Data Type: |
na |
| Balance Type: |
|
| Period Type: |
|
|
| X |
- Details
| Name: |
us-gaap_TypeOfArrangementAxis=HUSA_TwoThousandTwentyOneATMOfferingMember |
| Namespace Prefix: |
|
| Data Type: |
na |
| Balance Type: |
|
| Period Type: |
|
|
v3.25.0.1
SCHEDULE OF RECONCILIATION OF STATUTORY FEDERAL INCOME TAX (Details) - USD ($)
|
12 Months Ended |
Dec. 31, 2024 |
Dec. 31, 2023 |
| Income Tax Disclosure [Abstract] |
|
|
| Income (loss) before income taxes |
$ (8,216,112)
|
$ (3,211,277)
|
| Income tax expense (benefit) computed at statutory rates |
(1,725,727)
|
(674,368)
|
| Permanent differences, nondeductible expenses |
28
|
9
|
| Increase (decrease) in valuation allowance |
1,807,535
|
710,336
|
| Expiration of options |
32,060
|
|
| RTA True-Ups |
(227,729)
|
(10,919)
|
| Deferred True-Up |
113,833
|
(25,088)
|
| Tax provision |
|
|
| Foreign Income Tax Expense (Benefit), Continuing Operations |
|
|
| Income tax expense benefits |
|
|
v3.25.0.1
SIGNIFICANT COMPONENTS OF DEFERRED TAX ASSET AND LIABILITY (Details) - USD ($)
|
Dec. 31, 2024 |
Dec. 31, 2023 |
| Income Tax Disclosure [Abstract] |
|
|
| Net operating loss carry forward |
$ 12,729,620
|
$ 12,355,137
|
| Foreign tax credit carry forward |
18,865
|
18,865
|
| Deferred state tax |
|
|
| Stock compensation |
460,368
|
470,816
|
| Book in excess of tax depreciation, depletion and capitalization methods on oil and gas properties |
1,497,253
|
53,720
|
| Other |
|
|
| ASC 842 lease standard – building lease |
248
|
281
|
| Pass-through investment |
|
|
| Total Non-Current Deferred tax assets |
14,706,354
|
12,898,819
|
| Valuation Allowance |
(14,706,354)
|
(12,898,819)
|
| Net deferred tax asset |
|
|
| X |
- DefinitionASC 842 lease standard - building lease.
| Name: |
HUSA_Asc842LeaseStandardBuildingLease |
| Namespace Prefix: |
HUSA_ |
| Data Type: |
xbrli:monetaryItemType |
| Balance Type: |
debit |
| Period Type: |
instant |
|
| X |
- DefinitionBook in excess of tax depreciation, depletion and capitalization methods on oil and gas properties.
| Name: |
HUSA_DeferredTaxAssetsBookInExcessOfTaxDepreciationDepletionAndCapitalizationMethodsOnOilAndGasProperties |
| Namespace Prefix: |
HUSA_ |
| Data Type: |
xbrli:monetaryItemType |
| Balance Type: |
debit |
| Period Type: |
instant |
|
| X |
- Definition
+ References
+ Details
| Name: |
HUSA_DeferredTaxAssetsPassthroughInvestment |
| Namespace Prefix: |
HUSA_ |
| Data Type: |
xbrli:monetaryItemType |
| Balance Type: |
debit |
| Period Type: |
instant |
|
| X |
- DefinitionAmount before allocation of valuation allowances of deferred tax asset attributable to deductible temporary differences and carryforwards. Reference 1: http://www.xbrl.org/2003/role/disclosureRef
-Topic 740
-SubTopic 10
-Name Accounting Standards Codification
-Section 50
-Paragraph 2
-Subparagraph (b)
-Publisher FASB
-URI https://asc.fasb.org/1943274/2147482685/740-10-50-2
| Name: |
us-gaap_DeferredTaxAssetsGross |
| Namespace Prefix: |
us-gaap_ |
| Data Type: |
xbrli:monetaryItemType |
| Balance Type: |
debit |
| Period Type: |
instant |
|
| X |
- DefinitionAmount after allocation of valuation allowances of deferred tax asset attributable to deductible temporary differences and carryforwards. Reference 1: http://www.xbrl.org/2009/role/commonPracticeRef
-Topic 740
-SubTopic 10
-Name Accounting Standards Codification
-Section 50
-Paragraph 2
-Publisher FASB
-URI https://asc.fasb.org/1943274/2147482685/740-10-50-2
| Name: |
us-gaap_DeferredTaxAssetsNet |
| Namespace Prefix: |
us-gaap_ |
| Data Type: |
xbrli:monetaryItemType |
| Balance Type: |
debit |
| Period Type: |
instant |
|
| X |
- DefinitionAmount before allocation of valuation allowances of deferred tax asset attributable to deductible operating loss carryforwards. Reference 1: http://www.xbrl.org/2009/role/commonPracticeRef
-Topic 740
-SubTopic 10
-Name Accounting Standards Codification
-Section 50
-Paragraph 6
-Publisher FASB
-URI https://asc.fasb.org/1943274/2147482685/740-10-50-6
| Name: |
us-gaap_DeferredTaxAssetsOperatingLossCarryforwards |
| Namespace Prefix: |
us-gaap_ |
| Data Type: |
xbrli:monetaryItemType |
| Balance Type: |
debit |
| Period Type: |
instant |
|
| X |
- DefinitionAmount, before allocation of valuation allowance, of deferred tax asset attributable to deductible temporary differences, classified as other. Reference 1: http://www.xbrl.org/2009/role/commonPracticeRef
-Topic 740
-SubTopic 10
-Name Accounting Standards Codification
-Section 50
-Paragraph 6
-Publisher FASB
-URI https://asc.fasb.org/1943274/2147482685/740-10-50-6
| Name: |
us-gaap_DeferredTaxAssetsOther |
| Namespace Prefix: |
us-gaap_ |
| Data Type: |
xbrli:monetaryItemType |
| Balance Type: |
debit |
| Period Type: |
instant |
|
| X |
- DefinitionAmount before allocation of valuation allowances of deferred tax asset attributable to deductible temporary differences from state taxes. Reference 1: http://www.xbrl.org/2009/role/commonPracticeRef
-Topic 740
-SubTopic 10
-Name Accounting Standards Codification
-Section 50
-Paragraph 6
-Publisher FASB
-URI https://asc.fasb.org/1943274/2147482685/740-10-50-6
| Name: |
us-gaap_DeferredTaxAssetsStateTaxes |
| Namespace Prefix: |
us-gaap_ |
| Data Type: |
xbrli:monetaryItemType |
| Balance Type: |
debit |
| Period Type: |
instant |
|
| X |
- DefinitionAmount before allocation of valuation allowances of deferred tax asset attributable to deductible foreign tax credit carryforwards. Reference 1: http://www.xbrl.org/2009/role/commonPracticeRef
-Topic 740
-SubTopic 10
-Name Accounting Standards Codification
-Section 50
-Paragraph 6
-Publisher FASB
-URI https://asc.fasb.org/1943274/2147482685/740-10-50-6
| Name: |
us-gaap_DeferredTaxAssetsTaxCreditCarryforwardsForeign |
| Namespace Prefix: |
us-gaap_ |
| Data Type: |
xbrli:monetaryItemType |
| Balance Type: |
debit |
| Period Type: |
instant |
|
| X |
- DefinitionAmount before allocation of valuation allowances of deferred tax asset attributable to deductible temporary differences from share-based compensation. Reference 1: http://www.xbrl.org/2009/role/commonPracticeRef
-Topic 740
-SubTopic 10
-Name Accounting Standards Codification
-Section 50
-Paragraph 6
-Publisher FASB
-URI https://asc.fasb.org/1943274/2147482685/740-10-50-6
| Name: |
us-gaap_DeferredTaxAssetsTaxDeferredExpenseCompensationAndBenefitsShareBasedCompensationCost |
| Namespace Prefix: |
us-gaap_ |
| Data Type: |
xbrli:monetaryItemType |
| Balance Type: |
debit |
| Period Type: |
instant |
|
| X |
- DefinitionAmount of deferred tax assets for which it is more likely than not that a tax benefit will not be realized. Reference 1: http://www.xbrl.org/2003/role/disclosureRef
-Topic 740
-SubTopic 10
-Name Accounting Standards Codification
-Section 50
-Paragraph 2
-Subparagraph (c)
-Publisher FASB
-URI https://asc.fasb.org/1943274/2147482685/740-10-50-2
| Name: |
us-gaap_DeferredTaxAssetsValuationAllowance |
| Namespace Prefix: |
us-gaap_ |
| Data Type: |
xbrli:monetaryItemType |
| Balance Type: |
credit |
| Period Type: |
instant |
|
v3.25.0.1
TAXES (Details Narrative) - USD ($)
|
12 Months Ended |
|
Dec. 31, 2024 |
Dec. 31, 2023 |
| Significant Change in Unrecognized Tax Benefits is Reasonably Possible [Line Items] |
|
|
| Federal tax loss carry forward |
$ 12,741,145
|
|
| Foreign tax credit carry forward |
$ 18,865
|
$ 18,865
|
| Description of net operating loss expiration year |
Under
the Tax Cuts and Jobs Act of 2017, net operating losses incurred for tax years beginning after December 31, 2017 will have no expiration
date but utilization will be limited to 80% of taxable income. For losses generated prior to January 1, 2018, there will be no limitation
on the utilization, but there is an expiration on the carryforward of 20 years for federal tax purposes.
|
|
| Minimum [Member] |
|
|
| Significant Change in Unrecognized Tax Benefits is Reasonably Possible [Line Items] |
|
|
| Federal statutory income tax rate |
80.00%
|
|
| Maximum [Member] |
|
|
| Significant Change in Unrecognized Tax Benefits is Reasonably Possible [Line Items] |
|
|
| Federal statutory income tax rate |
100.00%
|
|
| X |
- DefinitionDescription of net operating loss expiration year.
| Name: |
HUSA_DescriptionOfNetOperatingLossExpirationYear |
| Namespace Prefix: |
HUSA_ |
| Data Type: |
xbrli:stringItemType |
| Balance Type: |
na |
| Period Type: |
duration |
|
| X |
- DefinitionAmount before allocation of valuation allowances of deferred tax asset attributable to deductible domestic operating loss carryforwards. Excludes state and local operating loss carryforwards. Reference 1: http://www.xbrl.org/2009/role/commonPracticeRef
-Topic 740
-SubTopic 10
-Name Accounting Standards Codification
-Section 50
-Paragraph 6
-Publisher FASB
-URI https://asc.fasb.org/1943274/2147482685/740-10-50-6
| Name: |
us-gaap_DeferredTaxAssetsOperatingLossCarryforwardsDomestic |
| Namespace Prefix: |
us-gaap_ |
| Data Type: |
xbrli:monetaryItemType |
| Balance Type: |
debit |
| Period Type: |
instant |
|
| X |
- DefinitionAmount before allocation of valuation allowances of deferred tax asset attributable to deductible foreign tax credit carryforwards. Reference 1: http://www.xbrl.org/2009/role/commonPracticeRef
-Topic 740
-SubTopic 10
-Name Accounting Standards Codification
-Section 50
-Paragraph 6
-Publisher FASB
-URI https://asc.fasb.org/1943274/2147482685/740-10-50-6
| Name: |
us-gaap_DeferredTaxAssetsTaxCreditCarryforwardsForeign |
| Namespace Prefix: |
us-gaap_ |
| Data Type: |
xbrli:monetaryItemType |
| Balance Type: |
debit |
| Period Type: |
instant |
|
| X |
- DefinitionLine items represent financial concepts included in a table. These concepts are used to disclose reportable information associated with domain members defined in one or many axes to the table. Reference 1: http://fasb.org/us-gaap/role/ref/otherTransitionRef
-Topic 740
-SubTopic 10
-Name Accounting Standards Codification
-Section 50
-Paragraph 15
-Subparagraph (d)(3)
-Publisher FASB
-URI https://asc.fasb.org/1943274/2147482685/740-10-50-15
| Name: |
us-gaap_SignificantChangeInUnrecognizedTaxBenefitsIsReasonablyPossibleLineItems |
| Namespace Prefix: |
us-gaap_ |
| Data Type: |
xbrli:stringItemType |
| Balance Type: |
na |
| Period Type: |
duration |
|
| X |
- Details
| Name: |
srt_RangeAxis=srt_MinimumMember |
| Namespace Prefix: |
|
| Data Type: |
na |
| Balance Type: |
|
| Period Type: |
|
|
| X |
- Details
| Name: |
srt_RangeAxis=srt_MaximumMember |
| Namespace Prefix: |
|
| Data Type: |
na |
| Balance Type: |
|
| Period Type: |
|
|
v3.25.0.1
| X |
- DefinitionLessee, Operating Lease, Liability, to be Paid, after Year Two.
| Name: |
HUSA_LesseeOperatingLeaseLiabilityPaymentsDueAfterYearTwo |
| Namespace Prefix: |
HUSA_ |
| Data Type: |
xbrli:monetaryItemType |
| Balance Type: |
credit |
| Period Type: |
instant |
|
| X |
- References
+ Details
| Name: |
us-gaap_CommitmentsAndContingenciesDisclosureAbstract |
| Namespace Prefix: |
us-gaap_ |
| Data Type: |
xbrli:stringItemType |
| Balance Type: |
na |
| Period Type: |
duration |
|
| X |
- DefinitionAmount of lessee's undiscounted obligation for lease payment for operating lease. Reference 1: http://www.xbrl.org/2003/role/disclosureRef
-Topic 842
-SubTopic 20
-Name Accounting Standards Codification
-Section 50
-Paragraph 6
-Publisher FASB
-URI https://asc.fasb.org/1943274/2147478964/842-20-50-6
| Name: |
us-gaap_LesseeOperatingLeaseLiabilityPaymentsDue |
| Namespace Prefix: |
us-gaap_ |
| Data Type: |
xbrli:monetaryItemType |
| Balance Type: |
credit |
| Period Type: |
instant |
|
| X |
- DefinitionAmount of lessee's undiscounted obligation for lease payment for operating lease to be paid in next fiscal year following current fiscal year. Excludes interim and annual periods when interim periods are reported from current statement of financial position date (rolling approach). Reference 1: http://www.xbrl.org/2003/role/disclosureRef
-Topic 842
-SubTopic 20
-Name Accounting Standards Codification
-Section 50
-Paragraph 6
-Publisher FASB
-URI https://asc.fasb.org/1943274/2147478964/842-20-50-6
| Name: |
us-gaap_LesseeOperatingLeaseLiabilityPaymentsDueNextTwelveMonths |
| Namespace Prefix: |
us-gaap_ |
| Data Type: |
xbrli:monetaryItemType |
| Balance Type: |
credit |
| Period Type: |
instant |
|
| X |
- DefinitionAmount of lessee's undiscounted obligation for lease payments in excess of discounted obligation for lease payments for operating lease. Reference 1: http://www.xbrl.org/2003/role/disclosureRef
-Topic 842
-SubTopic 20
-Name Accounting Standards Codification
-Section 50
-Paragraph 6
-Publisher FASB
-URI https://asc.fasb.org/1943274/2147478964/842-20-50-6
| Name: |
us-gaap_LesseeOperatingLeaseLiabilityUndiscountedExcessAmount |
| Namespace Prefix: |
us-gaap_ |
| Data Type: |
xbrli:monetaryItemType |
| Balance Type: |
credit |
| Period Type: |
instant |
|
| X |
- DefinitionPresent value of lessee's discounted obligation for lease payments from operating lease. Reference 1: http://www.xbrl.org/2003/role/disclosureRef
-Topic 842
-SubTopic 20
-Name Accounting Standards Codification
-Section 45
-Paragraph 1
-Subparagraph (b)
-Publisher FASB
-URI https://asc.fasb.org/1943274/2147479041/842-20-45-1
| Name: |
us-gaap_OperatingLeaseLiability |
| Namespace Prefix: |
us-gaap_ |
| Data Type: |
xbrli:monetaryItemType |
| Balance Type: |
credit |
| Period Type: |
instant |
|
| X |
- DefinitionPresent value of lessee's discounted obligation for lease payments from operating lease, classified as current. Reference 1: http://www.xbrl.org/2003/role/disclosureRef
-Topic 842
-SubTopic 20
-Name Accounting Standards Codification
-Section 45
-Paragraph 1
-Subparagraph (b)
-Publisher FASB
-URI https://asc.fasb.org/1943274/2147479041/842-20-45-1
| Name: |
us-gaap_OperatingLeaseLiabilityCurrent |
| Namespace Prefix: |
us-gaap_ |
| Data Type: |
xbrli:monetaryItemType |
| Balance Type: |
credit |
| Period Type: |
instant |
|
| X |
- DefinitionPresent value of lessee's discounted obligation for lease payments from operating lease, classified as noncurrent. Reference 1: http://www.xbrl.org/2003/role/disclosureRef
-Topic 842
-SubTopic 20
-Name Accounting Standards Codification
-Section 45
-Paragraph 1
-Subparagraph (b)
-Publisher FASB
-URI https://asc.fasb.org/1943274/2147479041/842-20-45-1
| Name: |
us-gaap_OperatingLeaseLiabilityNoncurrent |
| Namespace Prefix: |
us-gaap_ |
| Data Type: |
xbrli:monetaryItemType |
| Balance Type: |
credit |
| Period Type: |
instant |
|
v3.25.0.1
COMMITMENTS AND CONTINGENCIES (Details Narrative) - USD ($)
|
1 Months Ended |
12 Months Ended |
Aug. 31, 2013 |
Dec. 31, 2024 |
Dec. 31, 2023 |
| Loss Contingencies [Line Items] |
|
|
|
| Amortization of right of use asset |
|
$ 75,120
|
$ 67,181
|
| Rental expense |
|
747,559
|
473,925
|
| Description of production incentive compensation plan |
The maximum percentage
of the Company’s share of revenues from a well that may be designated to fund a Pool is 2% (the “Pool Cap”); provided,
however, that with respect to wells with a net revenue interest to the 8/8 of less than 73%, the Pool Cap with respect to such wells
shall be reduced on a 1-for-1 basis such that no portion of the Company’s revenues from a well may be designated to fund a Pool
if the NRI is 71% or less.
|
|
|
| Maximum percentage of revenue to fund a pool from a well |
2.00%
|
|
|
| Maximum percentage of revenue from a well considered for pool cap |
73.00%
|
|
|
| Maximum percentage of revenue from a well considered for pool nri |
71.00%
|
|
|
| Payment of overriding royalty interests |
|
42,450
|
47,724
|
| Accounts payable |
|
$ 0
|
0
|
| COLOMBIA | Current Director [Member] |
|
|
|
| Loss Contingencies [Line Items] |
|
|
|
| Percentage of royalty interest |
|
1.50%
|
|
| General and Administrative Expense [Member] |
|
|
|
| Loss Contingencies [Line Items] |
|
|
|
| Rental expense |
|
$ 88,644
|
$ 88,644
|
| Operating Lease Agreement [Member] |
|
|
|
| Loss Contingencies [Line Items] |
|
|
|
| Operating lease agreement expire date |
|
Oct. 31, 2025
|
|
| Operating cash outflows related to operating lease liabilities |
|
$ 87,288
|
|
| Amortization of right of use asset |
|
$ 66,741
|
|
| Operating lease, weighted average remaining lease term |
|
9 months 29 days
|
|
| Weighted average discount rate |
|
12.00%
|
|
| X |
- DefinitionDescription of production incentive compensation plan.
| Name: |
HUSA_DescriptionOfProductionIncentiveCompensationPlan |
| Namespace Prefix: |
HUSA_ |
| Data Type: |
xbrli:stringItemType |
| Balance Type: |
na |
| Period Type: |
duration |
|
| X |
- DefinitionRefers to maximum percentage of revenue from a well considered for pool cap.
| Name: |
HUSA_MaximumPercentageOfRevenueFromWellConsideredForPoolCapOne |
| Namespace Prefix: |
HUSA_ |
| Data Type: |
dtr-types:percentItemType |
| Balance Type: |
na |
| Period Type: |
duration |
|
| X |
- DefinitionRefers to maximum percentage of revenue from a well considered for pool cap NRI.
| Name: |
HUSA_MaximumPercentageOfRevenueFromWellConsideredForPoolCapTwo |
| Namespace Prefix: |
HUSA_ |
| Data Type: |
dtr-types:percentItemType |
| Balance Type: |
na |
| Period Type: |
duration |
|
| X |
- DefinitionRefers to maximum percentage of revenue to fund a pool from a well.
| Name: |
HUSA_MaximumPercentageOfRevenueToFundPoolFromWell |
| Namespace Prefix: |
HUSA_ |
| Data Type: |
dtr-types:percentItemType |
| Balance Type: |
na |
| Period Type: |
duration |
|
| X |
- DefinitionPercentage of royalty interest.
| Name: |
HUSA_PercentageOfRoyaltyInterest |
| Namespace Prefix: |
HUSA_ |
| Data Type: |
dtr-types:percentItemType |
| Balance Type: |
na |
| Period Type: |
duration |
|
| X |
- DefinitionCarrying value as of the balance sheet date of liabilities incurred (and for which invoices have typically been received) and payable to vendors for goods and services received that are used in an entity's business. Reference 1: http://fasb.org/us-gaap/role/ref/legacyRef
-Topic 942
-SubTopic 210
-Name Accounting Standards Codification
-Section S99
-Paragraph 1
-Subparagraph (SX 210.9-03(15)(5))
-Publisher FASB
-URI https://asc.fasb.org/1943274/2147478546/942-210-S99-1
Reference 2: http://www.xbrl.org/2009/role/commonPracticeRef
-Topic 944
-SubTopic 210
-Name Accounting Standards Codification
-Section S99
-Paragraph 1
-Subparagraph (SX 210.7-03(a)(15)(a))
-Publisher FASB
-URI https://asc.fasb.org/1943274/2147478777/944-210-S99-1
| Name: |
us-gaap_AccountsPayableCurrentAndNoncurrent |
| Namespace Prefix: |
us-gaap_ |
| Data Type: |
xbrli:monetaryItemType |
| Balance Type: |
credit |
| Period Type: |
instant |
|
| X |
- DefinitionDate which lease or group of leases is set to expire, in YYYY-MM-DD format.
| Name: |
us-gaap_LeaseExpirationDate1 |
| Namespace Prefix: |
us-gaap_ |
| Data Type: |
xbrli:dateItemType |
| Balance Type: |
na |
| Period Type: |
duration |
|
| X |
- DefinitionLine items represent financial concepts included in a table. These concepts are used to disclose reportable information associated with domain members defined in one or many axes to the table. Reference 1: http://www.xbrl.org/2009/role/commonPracticeRef
-Topic 450
-SubTopic 20
-Name Accounting Standards Codification
-Section 50
-Paragraph 4
-Subparagraph (a)
-Publisher FASB
-URI https://asc.fasb.org/1943274/2147483076/450-20-50-4
Reference 2: http://www.xbrl.org/2009/role/commonPracticeRef
-Topic 450
-SubTopic 20
-Name Accounting Standards Codification
-Section 50
-Paragraph 9
-Subparagraph (a)
-Publisher FASB
-URI https://asc.fasb.org/1943274/2147483076/450-20-50-9
Reference 3: http://www.xbrl.org/2003/role/disclosureRef
-Topic 720
-SubTopic 20
-Name Accounting Standards Codification
-Section 50
-Paragraph 1
-Publisher FASB
-URI https://asc.fasb.org/1943274/2147483359/720-20-50-1
Reference 4: http://www.xbrl.org/2003/role/exampleRef
-Topic 460
-SubTopic 10
-Name Accounting Standards Codification
-Section 55
-Paragraph 27
-Publisher FASB
-URI https://asc.fasb.org/1943274/2147482395/460-10-55-27
Reference 5: http://www.xbrl.org/2003/role/disclosureRef
-Topic 450
-SubTopic 20
-Name Accounting Standards Codification
-Section 50
-Paragraph 9
-Subparagraph (b)
-Publisher FASB
-URI https://asc.fasb.org/1943274/2147483076/450-20-50-9
Reference 6: http://www.xbrl.org/2003/role/disclosureRef
-Topic 450
-SubTopic 20
-Name Accounting Standards Codification
-Section 50
-Paragraph 4
-Subparagraph (b)
-Publisher FASB
-URI https://asc.fasb.org/1943274/2147483076/450-20-50-4
Reference 7: http://www.xbrl.org/2003/role/disclosureRef
-Topic 460
-SubTopic 10
-Name Accounting Standards Codification
-Section 50
-Paragraph 3
-Publisher FASB
-URI https://asc.fasb.org/1943274/2147482425/460-10-50-3
Reference 8: http://www.xbrl.org/2003/role/disclosureRef
-Topic 450
-SubTopic 20
-Name Accounting Standards Codification
-Section 50
-Paragraph 1
-Publisher FASB
-URI https://asc.fasb.org/1943274/2147483076/450-20-50-1
| Name: |
us-gaap_LossContingenciesLineItems |
| Namespace Prefix: |
us-gaap_ |
| Data Type: |
xbrli:stringItemType |
| Balance Type: |
na |
| Period Type: |
duration |
|
| X |
- DefinitionAmount of operating lease expense. Excludes sublease income. Reference 1: http://www.xbrl.org/2009/role/commonPracticeRef
-Topic 842
-SubTopic 20
-Name Accounting Standards Codification
-Section 45
-Paragraph 4
-Subparagraph (b)
-Publisher FASB
-URI https://asc.fasb.org/1943274/2147479041/842-20-45-4
| Name: |
us-gaap_OperatingLeaseExpense |
| Namespace Prefix: |
us-gaap_ |
| Data Type: |
xbrli:monetaryItemType |
| Balance Type: |
debit |
| Period Type: |
duration |
|
| X |
- DefinitionAmount of cash outflow from operating lease, excluding payments to bring another asset to condition and location necessary for its intended use. Reference 1: http://www.xbrl.org/2003/role/disclosureRef
-Topic 842
-SubTopic 20
-Name Accounting Standards Codification
-Section 45
-Paragraph 5
-Subparagraph (c)
-Publisher FASB
-URI https://asc.fasb.org/1943274/2147479041/842-20-45-5
Reference 2: http://www.xbrl.org/2003/role/disclosureRef
-Topic 842
-SubTopic 20
-Name Accounting Standards Codification
-Section 50
-Paragraph 4
-Subparagraph (g)(1)
-Publisher FASB
-URI https://asc.fasb.org/1943274/2147478964/842-20-50-4
| Name: |
us-gaap_OperatingLeasePayments |
| Namespace Prefix: |
us-gaap_ |
| Data Type: |
xbrli:monetaryItemType |
| Balance Type: |
credit |
| Period Type: |
duration |
|
| X |
- DefinitionAmount of periodic reduction over lease term of carrying amount of right-of-use asset from operating lease. Reference 1: http://www.xbrl.org/2009/role/commonPracticeRef
-Topic 230
-SubTopic 10
-Name Accounting Standards Codification
-Section 45
-Paragraph 28
-Subparagraph (b)
-Publisher FASB
-URI https://asc.fasb.org/1943274/2147482740/230-10-45-28
| Name: |
us-gaap_OperatingLeaseRightOfUseAssetAmortizationExpense |
| Namespace Prefix: |
us-gaap_ |
| Data Type: |
xbrli:monetaryItemType |
| Balance Type: |
debit |
| Period Type: |
duration |
|
| X |
- DefinitionWeighted average discount rate for operating lease calculated at point in time. Reference 1: http://www.xbrl.org/2003/role/exampleRef
-Topic 842
-SubTopic 20
-Name Accounting Standards Codification
-Section 55
-Paragraph 53
-Publisher FASB
-URI https://asc.fasb.org/1943274/2147479589/842-20-55-53
Reference 2: http://www.xbrl.org/2003/role/disclosureRef
-Topic 842
-SubTopic 20
-Name Accounting Standards Codification
-Section 50
-Paragraph 4
-Subparagraph (g)(4)
-Publisher FASB
-URI https://asc.fasb.org/1943274/2147478964/842-20-50-4
| Name: |
us-gaap_OperatingLeaseWeightedAverageDiscountRatePercent |
| Namespace Prefix: |
us-gaap_ |
| Data Type: |
dtr-types:percentItemType |
| Balance Type: |
na |
| Period Type: |
instant |
|
| X |
- DefinitionWeighted average remaining lease term for operating lease, in 'PnYnMnDTnHnMnS' format, for example, 'P1Y5M13D' represents reported fact of one year, five months, and thirteen days. Reference 1: http://www.xbrl.org/2003/role/exampleRef
-Topic 842
-SubTopic 20
-Name Accounting Standards Codification
-Section 55
-Paragraph 53
-Publisher FASB
-URI https://asc.fasb.org/1943274/2147479589/842-20-55-53
Reference 2: http://www.xbrl.org/2003/role/disclosureRef
-Topic 842
-SubTopic 20
-Name Accounting Standards Codification
-Section 50
-Paragraph 4
-Subparagraph (g)(3)
-Publisher FASB
-URI https://asc.fasb.org/1943274/2147478964/842-20-50-4
| Name: |
us-gaap_OperatingLeaseWeightedAverageRemainingLeaseTerm1 |
| Namespace Prefix: |
us-gaap_ |
| Data Type: |
xbrli:durationItemType |
| Balance Type: |
na |
| Period Type: |
instant |
|
| X |
- DefinitionThe cash outflow from the purchase of royalty interests in mining properties is the amount of cash the mineral producer pays the owner of the mine or mineral resource. Reference 1: http://fasb.org/us-gaap/role/ref/legacyRef
-Name Accounting Standards Codification
-Topic 230
-SubTopic 10
-Section 45
-Paragraph 13
-Subparagraph (b)
-Publisher FASB
-URI https://asc.fasb.org/1943274/2147482740/230-10-45-13
| Name: |
us-gaap_PaymentsToAcquireRoyaltyInterestsInMiningProperties |
| Namespace Prefix: |
us-gaap_ |
| Data Type: |
xbrli:monetaryItemType |
| Balance Type: |
credit |
| Period Type: |
duration |
|
| X |
- Details
| Name: |
srt_StatementGeographicalAxis=country_CO |
| Namespace Prefix: |
|
| Data Type: |
na |
| Balance Type: |
|
| Period Type: |
|
|
| X |
- Details
| Name: |
srt_TitleOfIndividualAxis=HUSA_CurrentDirectorMember |
| Namespace Prefix: |
|
| Data Type: |
na |
| Balance Type: |
|
| Period Type: |
|
|
| X |
- Details
| Name: |
us-gaap_IncomeStatementLocationAxis=us-gaap_GeneralAndAdministrativeExpenseMember |
| Namespace Prefix: |
|
| Data Type: |
na |
| Balance Type: |
|
| Period Type: |
|
|
| X |
- Details
| Name: |
us-gaap_TypeOfArrangementAxis=HUSA_OperatingLeaseAgreementMember |
| Namespace Prefix: |
|
| Data Type: |
na |
| Balance Type: |
|
| Period Type: |
|
|
v3.25.0.1
SCHEDULE OF REVENUES AND LONG LIVED ASSETS ATTRIBUTABLE TO GEOGRAPHICAL AREA (Details) - USD ($)
|
12 Months Ended |
Dec. 31, 2024 |
Dec. 31, 2023 |
| Revenues from External Customers and Long-Lived Assets [Line Items] |
|
|
| Revenues |
$ 560,180
|
$ 794,027
|
| Long Lived Assets, Net |
1,117,636
|
1,559,301
|
| North America [Member] |
|
|
| Revenues from External Customers and Long-Lived Assets [Line Items] |
|
|
| Revenues |
560,180
|
794,027
|
| North America [Member] | Reportable Geographical Components [Member] |
|
|
| Revenues from External Customers and Long-Lived Assets [Line Items] |
|
|
| Revenues |
560,180
|
794,027
|
| Long Lived Assets, Net |
1,117,636
|
1,559,301
|
| South America [Member] |
|
|
| Revenues from External Customers and Long-Lived Assets [Line Items] |
|
|
| Revenues |
|
|
| South America [Member] | Reportable Geographical Components [Member] |
|
|
| Revenues from External Customers and Long-Lived Assets [Line Items] |
|
|
| Revenues |
|
|
| Long Lived Assets, Net |
|
|
| X |
- DefinitionLong-lived assets other than financial instruments, long-term customer relationships of a financial institution, mortgage and other servicing rights, deferred policy acquisition costs, and deferred tax assets. Reference 1: http://www.xbrl.org/2003/role/disclosureRef
-Topic 280
-SubTopic 10
-Name Accounting Standards Codification
-Section 50
-Paragraph 41
-Subparagraph (b)
-Publisher FASB
-URI https://asc.fasb.org/1943274/2147482810/280-10-50-41
| Name: |
us-gaap_NoncurrentAssets |
| Namespace Prefix: |
us-gaap_ |
| Data Type: |
xbrli:monetaryItemType |
| Balance Type: |
debit |
| Period Type: |
instant |
|
| X |
- DefinitionAmount, excluding tax collected from customer, of revenue from satisfaction of performance obligation by transferring promised good or service to customer. Tax collected from customer is tax assessed by governmental authority that is both imposed on and concurrent with specific revenue-producing transaction, including, but not limited to, sales, use, value added and excise. Reference 1: http://www.xbrl.org/2003/role/disclosureRef
-Topic 280
-SubTopic 10
-Name Accounting Standards Codification
-Section 50
-Paragraph 41
-Subparagraph (a)
-Publisher FASB
-URI https://asc.fasb.org/1943274/2147482810/280-10-50-41
Reference 2: http://www.xbrl.org/2003/role/disclosureRef
-Topic 270
-SubTopic 10
-Name Accounting Standards Codification
-Section 50
-Paragraph 1
-Subparagraph (i)
-Publisher FASB
-URI https://asc.fasb.org/1943274/2147482964/270-10-50-1
Reference 3: http://www.xbrl.org/2003/role/disclosureRef
-Topic 280
-SubTopic 10
-Name Accounting Standards Codification
-Section 50
-Paragraph 32
-Subparagraph (ee)
-Publisher FASB
-URI https://asc.fasb.org/1943274/2147482810/280-10-50-32
Reference 4: http://fasb.org/us-gaap/role/ref/otherTransitionRef
-Topic 280
-SubTopic 10
-Name Accounting Standards Codification
-Section 50
-Paragraph 32
-Subparagraph (b)
-Publisher FASB
-URI https://asc.fasb.org/1943274/2147482810/280-10-50-32
Reference 5: http://fasb.org/us-gaap/role/ref/otherTransitionRef
-Topic 280
-SubTopic 10
-Name Accounting Standards Codification
-Section 50
-Paragraph 32
-Subparagraph (a)
-Publisher FASB
-URI https://asc.fasb.org/1943274/2147482810/280-10-50-32
Reference 6: http://www.xbrl.org/2003/role/disclosureRef
-Topic 924
-SubTopic 10
-Name Accounting Standards Codification
-Section S99
-Paragraph 1
-Subparagraph (SAB Topic 11.L)
-Publisher FASB
-URI https://asc.fasb.org/1943274/2147479941/924-10-S99-1
Reference 7: http://www.xbrl.org/2003/role/disclosureRef
-Topic 606
-SubTopic 10
-Name Accounting Standards Codification
-Section 50
-Paragraph 5
-Publisher FASB
-URI https://asc.fasb.org/1943274/2147479806/606-10-50-5
Reference 8: http://www.xbrl.org/2003/role/disclosureRef
-Topic 280
-SubTopic 10
-Name Accounting Standards Codification
-Section 50
-Paragraph 30
-Subparagraph (a)
-Publisher FASB
-URI https://asc.fasb.org/1943274/2147482810/280-10-50-30
Reference 9: http://www.xbrl.org/2003/role/disclosureRef
-Topic 280
-SubTopic 10
-Name Accounting Standards Codification
-Section 50
-Paragraph 42
-Publisher FASB
-URI https://asc.fasb.org/1943274/2147482810/280-10-50-42
Reference 10: http://www.xbrl.org/2003/role/disclosureRef
-Topic 280
-SubTopic 10
-Name Accounting Standards Codification
-Section 50
-Paragraph 22
-Subparagraph (b)
-Publisher FASB
-URI https://asc.fasb.org/1943274/2147482810/280-10-50-22
Reference 11: http://www.xbrl.org/2003/role/disclosureRef
-Topic 280
-SubTopic 10
-Name Accounting Standards Codification
-Section 50
-Paragraph 40
-Publisher FASB
-URI https://asc.fasb.org/1943274/2147482810/280-10-50-40
Reference 12: http://www.xbrl.org/2003/role/disclosureRef
-Topic 280
-SubTopic 10
-Name Accounting Standards Codification
-Section 50
-Paragraph 22
-Subparagraph (a)
-Publisher FASB
-URI https://asc.fasb.org/1943274/2147482810/280-10-50-22
Reference 13: http://www.xbrl.org/2003/role/disclosureRef
-Topic 606
-SubTopic 10
-Name Accounting Standards Codification
-Section 50
-Paragraph 4
-Subparagraph (a)
-Publisher FASB
-URI https://asc.fasb.org/1943274/2147479806/606-10-50-4
| Name: |
us-gaap_RevenueFromContractWithCustomerExcludingAssessedTax |
| Namespace Prefix: |
us-gaap_ |
| Data Type: |
xbrli:monetaryItemType |
| Balance Type: |
credit |
| Period Type: |
duration |
|
| X |
- DefinitionLine items represent financial concepts included in a table. These concepts are used to disclose reportable information associated with domain members defined in one or many axes to the table.
| Name: |
us-gaap_RevenuesFromExternalCustomersAndLongLivedAssetsLineItems |
| Namespace Prefix: |
us-gaap_ |
| Data Type: |
xbrli:stringItemType |
| Balance Type: |
na |
| Period Type: |
duration |
|
| X |
- Details
| Name: |
srt_StatementGeographicalAxis=srt_NorthAmericaMember |
| Namespace Prefix: |
|
| Data Type: |
na |
| Balance Type: |
|
| Period Type: |
|
|
| X |
- Details
| Name: |
srt_ConsolidationItemsAxis=srt_ReportableGeographicalComponentsMember |
| Namespace Prefix: |
|
| Data Type: |
na |
| Balance Type: |
|
| Period Type: |
|
|
| X |
- Details
| Name: |
srt_StatementGeographicalAxis=srt_SouthAmericaMember |
| Namespace Prefix: |
|
| Data Type: |
na |
| Balance Type: |
|
| Period Type: |
|
|
v3.25.0.1
SUBSEQUENT EVENTS (Details Narrative) - USD ($)
|
|
1 Months Ended |
12 Months Ended |
Feb. 20, 2025 |
Feb. 28, 2025 |
Jan. 31, 2025 |
Dec. 31, 2024 |
Dec. 31, 2023 |
| Subsequent Event [Line Items] |
|
|
|
|
|
| Common stock, shares authorized |
|
|
|
20,000,000
|
20,000,000
|
| Common stock, shares issued |
|
|
|
13,086,533
|
10,906,353
|
| Options issued |
|
|
|
82,320
|
60,000
|
| Subsequent Event [Member] |
|
|
|
|
|
| Subsequent Event [Line Items] |
|
|
|
|
|
| Sale of stock number of shares issued in transaction |
|
|
2,600,000
|
|
|
| Sale of stock consideration received on transaction |
|
|
$ 3,897,000
|
|
|
| Subsequent Event [Member] | Chief Executive Officer [Member] |
|
|
|
|
|
| Subsequent Event [Line Items] |
|
|
|
|
|
| Options issued |
|
10,638
|
24,202
|
|
|
| Subsequent Event [Member] | Board [Member] |
|
|
|
|
|
| Subsequent Event [Line Items] |
|
|
|
|
|
| Options issued |
|
|
24,202
|
|
|
| Subsequent Event [Member] | Share Exchange Agreement [Member] |
|
|
|
|
|
| Subsequent Event [Line Items] |
|
|
|
|
|
| Description of share exchange agreement |
Company
entered into a Share Exchange Agreement with the members of Abundia Global Impact Group, LLC (“AGIG”). In the Share
Exchange Agreement, the Company has agreed to issue to the members of AGIG a number of shares of our common stock equal to 94% of
the Company’s issued and outstanding shares (after taking into account such issuance). As a result of entering into the Share
Exchange Agreement, we will acquire all of the issued and outstanding units of AGIG, and AGIG will become a wholly-owned subsidiary
of the Company. Under the Share Exchange Agreement, the Company is obligated to obtain shareholder approval for the amendment of our
Certificate of Incorporation to increase the number of authorized shares of common stock to 300,000,000
and for the issuance of approximately 246,000,000
shares to the members of AGIG. The acquisition is subject to shareholder approval and standard closing conditions.
|
|
|
|
|
| Common stock, shares authorized |
300,000,000
|
|
|
|
|
| Common stock, shares issued |
246,000,000
|
|
|
|
|
| X |
- DefinitionDescription of share exchange agreement.
| Name: |
HUSA_DescriptionOfShareExchangeAgreement |
| Namespace Prefix: |
HUSA_ |
| Data Type: |
xbrli:stringItemType |
| Balance Type: |
na |
| Period Type: |
duration |
|
| X |
- DefinitionThe maximum number of common shares permitted to be issued by an entity's charter and bylaws. Reference 1: http://fasb.org/us-gaap/role/ref/legacyRef
-Topic 210
-SubTopic 10
-Name Accounting Standards Codification
-Section S99
-Paragraph 1
-Subparagraph (SX 210.5-02(29))
-Publisher FASB
-URI https://asc.fasb.org/1943274/2147480566/210-10-S99-1
Reference 2: http://www.xbrl.org/2003/role/disclosureRef
-Topic 946
-SubTopic 210
-Name Accounting Standards Codification
-Section S99
-Paragraph 1
-Subparagraph (SX 210.6-04(16)(a))
-Publisher FASB
-URI https://asc.fasb.org/1943274/2147479170/946-210-S99-1
| Name: |
us-gaap_CommonStockSharesAuthorized |
| Namespace Prefix: |
us-gaap_ |
| Data Type: |
xbrli:sharesItemType |
| Balance Type: |
na |
| Period Type: |
instant |
|
| X |
- DefinitionTotal number of common shares of an entity that have been sold or granted to shareholders (includes common shares that were issued, repurchased and remain in the treasury). These shares represent capital invested by the firm's shareholders and owners, and may be all or only a portion of the number of shares authorized. Shares issued include shares outstanding and shares held in the treasury. Reference 1: http://fasb.org/us-gaap/role/ref/legacyRef
-Topic 210
-SubTopic 10
-Name Accounting Standards Codification
-Section S99
-Paragraph 1
-Subparagraph (SX 210.5-02(29))
-Publisher FASB
-URI https://asc.fasb.org/1943274/2147480566/210-10-S99-1
| Name: |
us-gaap_CommonStockSharesIssued |
| Namespace Prefix: |
us-gaap_ |
| Data Type: |
xbrli:sharesItemType |
| Balance Type: |
na |
| Period Type: |
instant |
|
| X |
- DefinitionCash received on stock transaction after deduction of issuance costs.
| Name: |
us-gaap_SaleOfStockConsiderationReceivedOnTransaction |
| Namespace Prefix: |
us-gaap_ |
| Data Type: |
xbrli:monetaryItemType |
| Balance Type: |
debit |
| Period Type: |
duration |
|
| X |
- DefinitionThe number of shares issued or sold by the subsidiary or equity method investee per stock transaction.
| Name: |
us-gaap_SaleOfStockNumberOfSharesIssuedInTransaction |
| Namespace Prefix: |
us-gaap_ |
| Data Type: |
xbrli:sharesItemType |
| Balance Type: |
na |
| Period Type: |
duration |
|
| X |
- DefinitionGross number of share options (or share units) granted during the period. Reference 1: http://www.xbrl.org/2003/role/disclosureRef
-Topic 718
-SubTopic 10
-Name Accounting Standards Codification
-Section 50
-Paragraph 2
-Subparagraph (c)(1)(iv)(01)
-Publisher FASB
-URI https://asc.fasb.org/1943274/2147480429/718-10-50-2
| Name: |
us-gaap_ShareBasedCompensationArrangementByShareBasedPaymentAwardOptionsGrantsInPeriodGross |
| Namespace Prefix: |
us-gaap_ |
| Data Type: |
xbrli:sharesItemType |
| Balance Type: |
na |
| Period Type: |
duration |
|
| X |
- DefinitionDetail information of subsequent event by type. User is expected to use existing line items from elsewhere in the taxonomy as the primary line items for this disclosure, which is further associated with dimension and member elements pertaining to a subsequent event. Reference 1: http://www.xbrl.org/2003/role/disclosureRef
-Topic 830
-SubTopic 30
-Name Accounting Standards Codification
-Section 50
-Paragraph 2
-Publisher FASB
-URI https://asc.fasb.org/1943274/2147481674/830-30-50-2
Reference 2: http://www.xbrl.org/2003/role/disclosureRef
-Topic 855
-SubTopic 10
-Name Accounting Standards Codification
-Section 50
-Paragraph 2
-Publisher FASB
-URI https://asc.fasb.org/1943274/2147483399/855-10-50-2
| Name: |
us-gaap_SubsequentEventLineItems |
| Namespace Prefix: |
us-gaap_ |
| Data Type: |
xbrli:stringItemType |
| Balance Type: |
na |
| Period Type: |
duration |
|
| X |
- Details
| Name: |
us-gaap_SubsequentEventTypeAxis=us-gaap_SubsequentEventMember |
| Namespace Prefix: |
|
| Data Type: |
na |
| Balance Type: |
|
| Period Type: |
|
|
| X |
- Details
| Name: |
srt_TitleOfIndividualAxis=srt_ChiefExecutiveOfficerMember |
| Namespace Prefix: |
|
| Data Type: |
na |
| Balance Type: |
|
| Period Type: |
|
|
| X |
- Details
| Name: |
srt_TitleOfIndividualAxis=HUSA_BoardMember |
| Namespace Prefix: |
|
| Data Type: |
na |
| Balance Type: |
|
| Period Type: |
|
|
| X |
- Details
| Name: |
us-gaap_TypeOfArrangementAxis=HUSA_ShareExchangeAgreementMember |
| Namespace Prefix: |
|
| Data Type: |
na |
| Balance Type: |
|
| Period Type: |
|
|
v3.25.0.1
SCHEDULE OF OIL AND GAS REVENUES AND LEASE OPERATING EXPENSES (Details) - USD ($)
|
12 Months Ended |
Dec. 31, 2024 |
Dec. 31, 2023 |
| Oil and Gas, Full Cost Method, Amortization Expense [Line Items] |
|
|
| Revenues |
$ 560,180
|
$ 794,027
|
| Production Cost |
747,559
|
473,925
|
| North America [Member] |
|
|
| Oil and Gas, Full Cost Method, Amortization Expense [Line Items] |
|
|
| Revenues |
560,180
|
794,027
|
| Production Cost |
747,559
|
473,925
|
| South America [Member] |
|
|
| Oil and Gas, Full Cost Method, Amortization Expense [Line Items] |
|
|
| Revenues |
|
|
| Production Cost |
|
|
| X |
- DefinitionLine items represent financial concepts included in a table. These concepts are used to disclose reportable information associated with domain members defined in one or many axes to the table. Reference 1: http://www.xbrl.org/2003/role/disclosureRef
-Topic 932
-SubTopic 360
-Name Accounting Standards Codification
-Section S50
-Paragraph 5
-Publisher FASB
-URI https://asc.fasb.org/1943274/2147477385/932-360-S50-5
Reference 2: http://www.xbrl.org/2003/role/disclosureRef
-Topic 932
-SubTopic 10
-Name Accounting Standards Codification
-Section S99
-Paragraph 1
-Subparagraph (SX 210.4-10(c)(7)(i))
-Publisher FASB
-URI https://asc.fasb.org/1943274/2147479664/932-10-S99-1
| Name: |
us-gaap_AmortizationExpensePerEquivalentUnitOfProductionOrPerDollarOfGrossRevenueLineItems |
| Namespace Prefix: |
us-gaap_ |
| Data Type: |
xbrli:stringItemType |
| Balance Type: |
na |
| Period Type: |
duration |
|
| X |
- DefinitionAmount of operating lease expense. Excludes sublease income. Reference 1: http://www.xbrl.org/2009/role/commonPracticeRef
-Topic 842
-SubTopic 20
-Name Accounting Standards Codification
-Section 45
-Paragraph 4
-Subparagraph (b)
-Publisher FASB
-URI https://asc.fasb.org/1943274/2147479041/842-20-45-4
| Name: |
us-gaap_OperatingLeaseExpense |
| Namespace Prefix: |
us-gaap_ |
| Data Type: |
xbrli:monetaryItemType |
| Balance Type: |
debit |
| Period Type: |
duration |
|
| X |
- DefinitionAmount, excluding tax collected from customer, of revenue from satisfaction of performance obligation by transferring promised good or service to customer. Tax collected from customer is tax assessed by governmental authority that is both imposed on and concurrent with specific revenue-producing transaction, including, but not limited to, sales, use, value added and excise. Reference 1: http://www.xbrl.org/2003/role/disclosureRef
-Topic 280
-SubTopic 10
-Name Accounting Standards Codification
-Section 50
-Paragraph 41
-Subparagraph (a)
-Publisher FASB
-URI https://asc.fasb.org/1943274/2147482810/280-10-50-41
Reference 2: http://www.xbrl.org/2003/role/disclosureRef
-Topic 270
-SubTopic 10
-Name Accounting Standards Codification
-Section 50
-Paragraph 1
-Subparagraph (i)
-Publisher FASB
-URI https://asc.fasb.org/1943274/2147482964/270-10-50-1
Reference 3: http://www.xbrl.org/2003/role/disclosureRef
-Topic 280
-SubTopic 10
-Name Accounting Standards Codification
-Section 50
-Paragraph 32
-Subparagraph (ee)
-Publisher FASB
-URI https://asc.fasb.org/1943274/2147482810/280-10-50-32
Reference 4: http://fasb.org/us-gaap/role/ref/otherTransitionRef
-Topic 280
-SubTopic 10
-Name Accounting Standards Codification
-Section 50
-Paragraph 32
-Subparagraph (b)
-Publisher FASB
-URI https://asc.fasb.org/1943274/2147482810/280-10-50-32
Reference 5: http://fasb.org/us-gaap/role/ref/otherTransitionRef
-Topic 280
-SubTopic 10
-Name Accounting Standards Codification
-Section 50
-Paragraph 32
-Subparagraph (a)
-Publisher FASB
-URI https://asc.fasb.org/1943274/2147482810/280-10-50-32
Reference 6: http://www.xbrl.org/2003/role/disclosureRef
-Topic 924
-SubTopic 10
-Name Accounting Standards Codification
-Section S99
-Paragraph 1
-Subparagraph (SAB Topic 11.L)
-Publisher FASB
-URI https://asc.fasb.org/1943274/2147479941/924-10-S99-1
Reference 7: http://www.xbrl.org/2003/role/disclosureRef
-Topic 606
-SubTopic 10
-Name Accounting Standards Codification
-Section 50
-Paragraph 5
-Publisher FASB
-URI https://asc.fasb.org/1943274/2147479806/606-10-50-5
Reference 8: http://www.xbrl.org/2003/role/disclosureRef
-Topic 280
-SubTopic 10
-Name Accounting Standards Codification
-Section 50
-Paragraph 30
-Subparagraph (a)
-Publisher FASB
-URI https://asc.fasb.org/1943274/2147482810/280-10-50-30
Reference 9: http://www.xbrl.org/2003/role/disclosureRef
-Topic 280
-SubTopic 10
-Name Accounting Standards Codification
-Section 50
-Paragraph 42
-Publisher FASB
-URI https://asc.fasb.org/1943274/2147482810/280-10-50-42
Reference 10: http://www.xbrl.org/2003/role/disclosureRef
-Topic 280
-SubTopic 10
-Name Accounting Standards Codification
-Section 50
-Paragraph 22
-Subparagraph (b)
-Publisher FASB
-URI https://asc.fasb.org/1943274/2147482810/280-10-50-22
Reference 11: http://www.xbrl.org/2003/role/disclosureRef
-Topic 280
-SubTopic 10
-Name Accounting Standards Codification
-Section 50
-Paragraph 40
-Publisher FASB
-URI https://asc.fasb.org/1943274/2147482810/280-10-50-40
Reference 12: http://www.xbrl.org/2003/role/disclosureRef
-Topic 280
-SubTopic 10
-Name Accounting Standards Codification
-Section 50
-Paragraph 22
-Subparagraph (a)
-Publisher FASB
-URI https://asc.fasb.org/1943274/2147482810/280-10-50-22
Reference 13: http://www.xbrl.org/2003/role/disclosureRef
-Topic 606
-SubTopic 10
-Name Accounting Standards Codification
-Section 50
-Paragraph 4
-Subparagraph (a)
-Publisher FASB
-URI https://asc.fasb.org/1943274/2147479806/606-10-50-4
| Name: |
us-gaap_RevenueFromContractWithCustomerExcludingAssessedTax |
| Namespace Prefix: |
us-gaap_ |
| Data Type: |
xbrli:monetaryItemType |
| Balance Type: |
credit |
| Period Type: |
duration |
|
| X |
- Details
| Name: |
srt_StatementGeographicalAxis=srt_NorthAmericaMember |
| Namespace Prefix: |
|
| Data Type: |
na |
| Balance Type: |
|
| Period Type: |
|
|
| X |
- Details
| Name: |
srt_StatementGeographicalAxis=srt_SouthAmericaMember |
| Namespace Prefix: |
|
| Data Type: |
na |
| Balance Type: |
|
| Period Type: |
|
|
v3.25.0.1
CAPITALIZED COSTS AND ACCUMULATED DEPLETION RELATING TO OIL AND GAS PRODUCTION ACTIVITIES (Details) - USD ($)
|
Dec. 31, 2024 |
Dec. 31, 2023 |
| Oil and Gas, Full Cost Method, Amortization Expense [Line Items] |
|
|
| Unproved properties not being amortized |
|
|
| Proved properties being amortized |
62,770,657
|
|
| Accumulated depreciation, depletion, amortization and impairment |
(61,653,021)
|
$ (61,206,942)
|
| Net capitalized costs |
1,117,636
|
|
| UNITED STATES |
|
|
| Oil and Gas, Full Cost Method, Amortization Expense [Line Items] |
|
|
| Unproved properties not being amortized |
|
|
| Proved properties being amortized |
13,326,003
|
|
| Accumulated depreciation, depletion, amortization and impairment |
(12,208,367)
|
(11,762,288)
|
| Net capitalized costs |
1,117,636
|
|
| South America [Member] |
|
|
| Oil and Gas, Full Cost Method, Amortization Expense [Line Items] |
|
|
| Unproved properties not being amortized |
|
|
| Proved properties being amortized |
49,444,654
|
|
| Accumulated depreciation, depletion, amortization and impairment |
(49,444,654)
|
$ (49,444,654)
|
| Net capitalized costs |
|
|
| X |
- DefinitionLine items represent financial concepts included in a table. These concepts are used to disclose reportable information associated with domain members defined in one or many axes to the table. Reference 1: http://www.xbrl.org/2003/role/disclosureRef
-Topic 932
-SubTopic 360
-Name Accounting Standards Codification
-Section S50
-Paragraph 5
-Publisher FASB
-URI https://asc.fasb.org/1943274/2147477385/932-360-S50-5
Reference 2: http://www.xbrl.org/2003/role/disclosureRef
-Topic 932
-SubTopic 10
-Name Accounting Standards Codification
-Section S99
-Paragraph 1
-Subparagraph (SX 210.4-10(c)(7)(i))
-Publisher FASB
-URI https://asc.fasb.org/1943274/2147479664/932-10-S99-1
| Name: |
us-gaap_AmortizationExpensePerEquivalentUnitOfProductionOrPerDollarOfGrossRevenueLineItems |
| Namespace Prefix: |
us-gaap_ |
| Data Type: |
xbrli:stringItemType |
| Balance Type: |
na |
| Period Type: |
duration |
|
| X |
- DefinitionAmount of accumulated depreciation, depletion, amortization, and valuation allowance for capitalized cost in oil- and gas-producing activities. Reference 1: http://www.xbrl.org/2003/role/exampleRef
-Topic 932
-SubTopic 235
-Name Accounting Standards Codification
-Section 55
-Paragraph 3
-Publisher FASB
-URI https://asc.fasb.org/1943274/2147477916/932-235-55-3
Reference 2: http://www.xbrl.org/2003/role/disclosureRef
-Topic 932
-SubTopic 235
-Name Accounting Standards Codification
-Section 50
-Paragraph 15
-Subparagraph (b)
-Publisher FASB
-URI https://asc.fasb.org/1943274/2147477215/932-235-50-15
Reference 3: http://www.xbrl.org/2003/role/disclosureRef
-Topic 932
-SubTopic 235
-Name Accounting Standards Codification
-Section 50
-Paragraph 15
-Subparagraph (a)
-Publisher FASB
-URI https://asc.fasb.org/1943274/2147477215/932-235-50-15
Reference 4: http://www.xbrl.org/2003/role/disclosureRef
-Topic 932
-SubTopic 235
-Name Accounting Standards Codification
-Section 50
-Paragraph 13
-Publisher FASB
-URI https://asc.fasb.org/1943274/2147477215/932-235-50-13
Reference 5: http://www.xbrl.org/2003/role/exampleRef
-Topic 932
-SubTopic 235
-Name Accounting Standards Codification
-Section 50
-Paragraph 12
-Publisher FASB
-URI https://asc.fasb.org/1943274/2147477215/932-235-50-12
| Name: |
us-gaap_CapitalizedCostsAccumulatedDepreciationDepletionAmortizationAndValuationAllowanceForRelatingToOilAndGasProducingActivities |
| Namespace Prefix: |
us-gaap_ |
| Data Type: |
xbrli:monetaryItemType |
| Balance Type: |
credit |
| Period Type: |
instant |
|
| X |
- DefinitionAmount of capitalized cost excluded from amortization for investment in unproved property and development project for oil- and gas-producing activities accounted for under full cost method. Includes, but is not limited to, acquisition, exploration, and development costs for development project and capitalized interest. Reference 1: http://www.xbrl.org/2003/role/disclosureRef
-Topic 932
-SubTopic 360
-Name Accounting Standards Codification
-Section S50
-Paragraph 1
-Publisher FASB
-URI https://asc.fasb.org/1943274/2147477385/932-360-S50-1
Reference 2: http://www.xbrl.org/2003/role/disclosureRef
-Topic 932
-SubTopic 10
-Name Accounting Standards Codification
-Section S99
-Paragraph 1
-Subparagraph (SX 210.4-10(c)(7)(ii))
-Publisher FASB
-URI https://asc.fasb.org/1943274/2147479664/932-10-S99-1
| Name: |
us-gaap_CapitalizedCostsOfUnprovedPropertiesExcludedFromAmortizationCumulative |
| Namespace Prefix: |
us-gaap_ |
| Data Type: |
xbrli:monetaryItemType |
| Balance Type: |
debit |
| Period Type: |
instant |
|
| X |
- DefinitionAmount, after accumulated depreciation, depletion, amortization, and valuation allowance, of capitalized cost in oil- and gas-producing activities. Reference 1: http://www.xbrl.org/2003/role/exampleRef
-Topic 932
-SubTopic 235
-Name Accounting Standards Codification
-Section 55
-Paragraph 3
-Publisher FASB
-URI https://asc.fasb.org/1943274/2147477916/932-235-55-3
Reference 2: http://www.xbrl.org/2003/role/exampleRef
-Topic 932
-SubTopic 235
-Name Accounting Standards Codification
-Section 50
-Paragraph 12
-Publisher FASB
-URI https://asc.fasb.org/1943274/2147477215/932-235-50-12
Reference 3: http://www.xbrl.org/2009/role/commonPracticeRef
-Topic 932
-SubTopic 235
-Name Accounting Standards Codification
-Section 50
-Paragraph 15
-Subparagraph (b)
-Publisher FASB
-URI https://asc.fasb.org/1943274/2147477215/932-235-50-15
Reference 4: http://www.xbrl.org/2009/role/commonPracticeRef
-Topic 932
-SubTopic 235
-Name Accounting Standards Codification
-Section 50
-Paragraph 15
-Subparagraph (a)
-Publisher FASB
-URI https://asc.fasb.org/1943274/2147477215/932-235-50-15
Reference 5: http://www.xbrl.org/2009/role/commonPracticeRef
-Topic 932
-SubTopic 235
-Name Accounting Standards Codification
-Section 50
-Paragraph 13
-Publisher FASB
-URI https://asc.fasb.org/1943274/2147477215/932-235-50-13
| Name: |
us-gaap_CapitalizedCostsOilAndGasProducingActivitiesNet |
| Namespace Prefix: |
us-gaap_ |
| Data Type: |
xbrli:monetaryItemType |
| Balance Type: |
debit |
| Period Type: |
instant |
|
| X |
- Details
| Name: |
srt_StatementGeographicalAxis=country_US |
| Namespace Prefix: |
|
| Data Type: |
na |
| Balance Type: |
|
| Period Type: |
|
|
| X |
- Details
| Name: |
srt_StatementGeographicalAxis=srt_SouthAmericaMember |
| Namespace Prefix: |
|
| Data Type: |
na |
| Balance Type: |
|
| Period Type: |
|
|
v3.25.0.1
SCHEDULE OF PROVED DEVELOPED AND UNDEVELOPED RESERVES BY PRODUCT TYPE (Details) - UNITED STATES
|
12 Months Ended |
|
Dec. 31, 2024
bbl
Mcf
gal
|
Dec. 31, 2024
bbl
Mcf
gal
|
Dec. 31, 2024
bbl
Mcf
gal
|
Dec. 31, 2023
bbl
Mcf
gal
|
| Natural Gas [Member] |
|
|
|
|
| Oil and Gas, Full Cost Method, Amortization Expense [Line Items] |
|
|
|
|
| Oil and Gas, Proved Reserve, Quantity, Volume, Beginning Balance | Mcf |
|
607,646
|
|
1,030,420
|
| Oil and Gas, Proved Reserve, Quantity, Volume, Revision of Previous Estimate | Mcf |
|
(214,960)
|
|
(365,414)
|
| Oil and Gas, Proved Reserve, Quantity, Volume, Production | Mcf |
|
|
|
(57,360)
|
| [custom:ProvedDevelopedAndUndevelopedReservesRevisionsOfExtensionsAndDiscoveries] | Mcf |
|
78,980
|
|
|
| Oil and Gas, Proved Reserve, Quantity, Volume, Ending Balance | Mcf |
|
418,190
|
|
607,646
|
| Oil and Gas, Proved Developed Reserve, Quantity, Volume | Mcf |
418,190
|
418,190
|
418,190
|
607,646
|
| Oil and Gas, Proved Undeveloped Reserve, Quantity, Volume | Mcf |
|
|
|
|
| Oil [Member] |
|
|
|
|
| Oil and Gas, Full Cost Method, Amortization Expense [Line Items] |
|
|
|
|
| Oil and Gas, Proved Reserve, Quantity, Volume, Beginning Balance | bbl |
58,599
|
|
|
83,517
|
| Oil and Gas, Proved Reserve, Quantity, Volume, Revision of Previous Estimate | bbl |
(23,217)
|
|
|
(16,947)
|
| Oil and Gas, Proved Reserve, Quantity, Volume, Production |
(5,992)
|
(53,476)
|
|
(7,719)
|
| [custom:ProvedDevelopedAndUndevelopedReservesRevisionsOfExtensionsAndDiscoveries] | bbl |
17,000
|
|
|
|
| Oil and Gas, Proved Reserve, Quantity, Volume, Ending Balance | bbl |
46,390
|
|
|
58,599
|
| Oil and Gas, Proved Developed Reserve, Quantity, Volume | bbl |
46,390
|
46,390
|
46,390
|
58,599
|
| Oil and Gas, Proved Undeveloped Reserve, Quantity, Volume | bbl |
|
|
|
|
| Natural Gas Liquids (NGL) [Member] |
|
|
|
|
| Oil and Gas, Full Cost Method, Amortization Expense [Line Items] |
|
|
|
|
| Oil and Gas, Proved Reserve, Quantity, Volume, Beginning Balance | gal |
|
|
|
|
| Oil and Gas, Proved Reserve, Quantity, Volume, Revision of Previous Estimate | gal |
|
|
1,119,316
|
|
| Oil and Gas, Proved Reserve, Quantity, Volume, Production | gal |
|
|
(159,680)
|
|
| [custom:ProvedDevelopedAndUndevelopedReservesRevisionsOfExtensionsAndDiscoveries] | gal |
|
|
502,614
|
|
| Oil and Gas, Proved Reserve, Quantity, Volume, Ending Balance | gal |
|
|
1,462,250
|
|
| Oil and Gas, Proved Developed Reserve, Quantity, Volume | gal |
1,462,250
|
1,462,250
|
1,462,250
|
1,621,930
|
| Oil and Gas, Proved Undeveloped Reserve, Quantity, Volume | gal |
|
|
|
|
| X |
- References
+ Details
| Name: |
HUSA_ProvedDevelopedAndUndevelopedReservesRevisionsOfExtensionsAndDiscoveries |
| Namespace Prefix: |
HUSA_ |
| Data Type: |
dtr-types:volumeItemType |
| Balance Type: |
na |
| Period Type: |
duration |
|
| X |
- DefinitionThe net quantity of proved reserves as of the balance sheet date. Proved oil reserves are the estimated quantities of crude oil and natural gas liquids which geological and engineering data demonstrate with reasonable certainty to be recoverable. Reference 1: http://www.xbrl.org/2003/role/disclosureRef
-Name Form 20-F
-Number Part II
-Section Item 18
-Subparagraph (Instruction 2)
-Publisher SEC
Reference 2: http://www.xbrl.org/2003/role/exampleRef
-Topic 932
-SubTopic 235
-Name Accounting Standards Codification
-Section 55
-Paragraph 2
-Publisher FASB
-URI https://asc.fasb.org/1943274/2147477916/932-235-55-2
Reference 3: http://www.xbrl.org/2003/role/disclosureRef
-Topic 932
-SubTopic 235
-Name Accounting Standards Codification
-Section 50
-Paragraph 8
-Subparagraph (c)(2)
-Publisher FASB
-URI https://asc.fasb.org/1943274/2147477215/932-235-50-8
Reference 4: http://www.xbrl.org/2003/role/exampleRef
-Topic 932
-SubTopic 235
-Name Accounting Standards Codification
-Section 50
-Paragraph 3
-Publisher FASB
-URI https://asc.fasb.org/1943274/2147477215/932-235-50-3
Reference 5: http://www.xbrl.org/2003/role/disclosureRef
-Topic 932
-SubTopic 235
-Name Accounting Standards Codification
-Section 50
-Paragraph 8
-Subparagraph (c)(1)
-Publisher FASB
-URI https://asc.fasb.org/1943274/2147477215/932-235-50-8
Reference 6: http://www.xbrl.org/2003/role/disclosureRef
-Topic 932
-SubTopic 235
-Name Accounting Standards Codification
-Section 50
-Paragraph 4
-Publisher FASB
-URI https://asc.fasb.org/1943274/2147477215/932-235-50-4
| Name: |
srt_ProvedDevelopedAndUndevelopedReservesNet |
| Namespace Prefix: |
srt_ |
| Data Type: |
dtr-types:volumeItemType |
| Balance Type: |
na |
| Period Type: |
instant |
|
| X |
- DefinitionProduction of proved reserves. Reference 1: http://www.xbrl.org/2003/role/disclosureRef
-Name Form 20-F
-Number Part II
-Section Item 18
-Subparagraph (Instruction 2)
-Publisher SEC
Reference 2: http://www.xbrl.org/2003/role/exampleRef
-Topic 932
-SubTopic 235
-Name Accounting Standards Codification
-Section 55
-Paragraph 2
-Publisher FASB
-URI https://asc.fasb.org/1943274/2147477916/932-235-55-2
Reference 3: http://www.xbrl.org/2003/role/disclosureRef
-Topic 932
-SubTopic 235
-Name Accounting Standards Codification
-Section 50
-Paragraph 8
-Subparagraph (c)(2)
-Publisher FASB
-URI https://asc.fasb.org/1943274/2147477215/932-235-50-8
Reference 4: http://www.xbrl.org/2003/role/exampleRef
-Topic 932
-SubTopic 235
-Name Accounting Standards Codification
-Section 50
-Paragraph 3
-Publisher FASB
-URI https://asc.fasb.org/1943274/2147477215/932-235-50-3
Reference 5: http://www.xbrl.org/2003/role/disclosureRef
-Topic 932
-SubTopic 235
-Name Accounting Standards Codification
-Section 50
-Paragraph 8
-Subparagraph (c)(1)
-Publisher FASB
-URI https://asc.fasb.org/1943274/2147477215/932-235-50-8
Reference 6: http://www.xbrl.org/2003/role/disclosureRef
-Topic 932
-SubTopic 235
-Name Accounting Standards Codification
-Section 50
-Paragraph 5
-Subparagraph (e)
-Publisher FASB
-URI https://asc.fasb.org/1943274/2147477215/932-235-50-5
| Name: |
srt_ProvedDevelopedAndUndevelopedReservesProduction |
| Namespace Prefix: |
srt_ |
| Data Type: |
dtr-types:volumeItemType |
| Balance Type: |
na |
| Period Type: |
duration |
|
| X |
- DefinitionRevisions represent changes in previous estimates of proved reserves, either upward or downward, resulting from new information (except for an increase in proved acreage) normally obtained from development drilling and production history or resulting from change in economic factors. Reference 1: http://www.xbrl.org/2003/role/disclosureRef
-Name Form 20-F
-Number Part II
-Section Item 18
-Subparagraph (Instruction 2)
-Publisher SEC
Reference 2: http://www.xbrl.org/2003/role/exampleRef
-Topic 932
-SubTopic 235
-Name Accounting Standards Codification
-Section 55
-Paragraph 2
-Publisher FASB
-URI https://asc.fasb.org/1943274/2147477916/932-235-55-2
Reference 3: http://www.xbrl.org/2003/role/disclosureRef
-Topic 932
-SubTopic 235
-Name Accounting Standards Codification
-Section 50
-Paragraph 8
-Subparagraph (c)(2)
-Publisher FASB
-URI https://asc.fasb.org/1943274/2147477215/932-235-50-8
Reference 4: http://www.xbrl.org/2003/role/exampleRef
-Topic 932
-SubTopic 235
-Name Accounting Standards Codification
-Section 50
-Paragraph 3
-Publisher FASB
-URI https://asc.fasb.org/1943274/2147477215/932-235-50-3
Reference 5: http://www.xbrl.org/2003/role/disclosureRef
-Topic 932
-SubTopic 235
-Name Accounting Standards Codification
-Section 50
-Paragraph 8
-Subparagraph (c)(1)
-Publisher FASB
-URI https://asc.fasb.org/1943274/2147477215/932-235-50-8
Reference 6: http://www.xbrl.org/2003/role/disclosureRef
-Topic 932
-SubTopic 235
-Name Accounting Standards Codification
-Section 50
-Paragraph 5
-Subparagraph (a)
-Publisher FASB
-URI https://asc.fasb.org/1943274/2147477215/932-235-50-5
| Name: |
srt_ProvedDevelopedAndUndevelopedReservesRevisionsOfPreviousEstimatesIncreaseDecrease |
| Namespace Prefix: |
srt_ |
| Data Type: |
dtr-types:volumeItemType |
| Balance Type: |
na |
| Period Type: |
duration |
|
| X |
- DefinitionNet quantities of an enterprise's interests in proved developed reserves of either crude oil (including condensate and natural gas liquids), natural gas, synthetic oil and gas, or other nonrenewable natural resource that is intended to be upgraded into synthetic oil and gas as of the beginning and the end of the year. "Net" quantities of reserves include those relating to the enterprise's operating and nonoperating interests in properties. Quantities of reserves relating to royalty interests owned are included in "net" quantities if the necessary information is available to the enterprise. "Net" quantities does not include reserves relating to interests of others in properties owned by the enterprise. The unit of measure for reserve quantities is defined as "barrels" for oil and synthetic oil reserves or "cubic feet" or "cubic meters" for natural gas and synthetic gas reserves. Reference 1: http://www.xbrl.org/2003/role/disclosureRef
-Name Form 20-F
-Number Part II
-Section Item 18
-Subparagraph (Instruction 2)
-Publisher SEC
Reference 2: http://www.xbrl.org/2003/role/exampleRef
-Topic 932
-SubTopic 235
-Name Accounting Standards Codification
-Section 55
-Paragraph 2
-Publisher FASB
-URI https://asc.fasb.org/1943274/2147477916/932-235-55-2
Reference 3: http://www.xbrl.org/2003/role/disclosureRef
-Topic 932
-SubTopic 235
-Name Accounting Standards Codification
-Section 50
-Paragraph 8
-Subparagraph (c)(2)
-Publisher FASB
-URI https://asc.fasb.org/1943274/2147477215/932-235-50-8
Reference 4: http://www.xbrl.org/2003/role/exampleRef
-Topic 932
-SubTopic 235
-Name Accounting Standards Codification
-Section 50
-Paragraph 3
-Publisher FASB
-URI https://asc.fasb.org/1943274/2147477215/932-235-50-3
Reference 5: http://www.xbrl.org/2003/role/disclosureRef
-Topic 932
-SubTopic 235
-Name Accounting Standards Codification
-Section 50
-Paragraph 8
-Subparagraph (c)(1)
-Publisher FASB
-URI https://asc.fasb.org/1943274/2147477215/932-235-50-8
Reference 6: http://www.xbrl.org/2003/role/disclosureRef
-Topic 932
-SubTopic 235
-Name Accounting Standards Codification
-Section 50
-Paragraph 4
-Publisher FASB
-URI https://asc.fasb.org/1943274/2147477215/932-235-50-4
| Name: |
srt_ProvedDevelopedReservesVolume |
| Namespace Prefix: |
srt_ |
| Data Type: |
dtr-types:volumeItemType |
| Balance Type: |
na |
| Period Type: |
instant |
|
| X |
- DefinitionNet quantities of an enterprise's interests in proved undeveloped reserves of either crude oil (including condensate and natural gas liquids), natural gas, synthetic oil and gas, or other renewable natural resource that is intended to be upgraded into synthetic oil and gas as of the beginning and the end of the year. "Net" quantities of reserves include those relating to the enterprise's operating and nonoperating interests in properties. Quantities of reserves relating to royalty interests owned are included in "net" quantities if the necessary information is available to the enterprise. "Net" quantities does not include reserves relating to interests of others in properties owned by the enterprise. The unit of measure for reserve quantities is defined as "barrels" for oil and synthetic oil reserves or "cubic feet" or "cubic meters" for natural gas and synthetic gas reserves. Reference 1: http://www.xbrl.org/2003/role/disclosureRef
-Name Form 20-F
-Number Part II
-Section Item 18
-Subparagraph (Instruction 2)
-Publisher SEC
Reference 2: http://www.xbrl.org/2003/role/exampleRef
-Topic 932
-SubTopic 235
-Name Accounting Standards Codification
-Section 55
-Paragraph 2
-Publisher FASB
-URI https://asc.fasb.org/1943274/2147477916/932-235-55-2
Reference 3: http://www.xbrl.org/2003/role/disclosureRef
-Topic 932
-SubTopic 235
-Name Accounting Standards Codification
-Section 50
-Paragraph 8
-Subparagraph (c)(2)
-Publisher FASB
-URI https://asc.fasb.org/1943274/2147477215/932-235-50-8
Reference 4: http://www.xbrl.org/2003/role/exampleRef
-Topic 932
-SubTopic 235
-Name Accounting Standards Codification
-Section 50
-Paragraph 3
-Publisher FASB
-URI https://asc.fasb.org/1943274/2147477215/932-235-50-3
Reference 5: http://www.xbrl.org/2003/role/disclosureRef
-Topic 932
-SubTopic 235
-Name Accounting Standards Codification
-Section 50
-Paragraph 8
-Subparagraph (c)(1)
-Publisher FASB
-URI https://asc.fasb.org/1943274/2147477215/932-235-50-8
Reference 6: http://www.xbrl.org/2003/role/disclosureRef
-Topic 932
-SubTopic 235
-Name Accounting Standards Codification
-Section 50
-Paragraph 4
-Publisher FASB
-URI https://asc.fasb.org/1943274/2147477215/932-235-50-4
| Name: |
srt_ProvedUndevelopedReserveVolume |
| Namespace Prefix: |
srt_ |
| Data Type: |
dtr-types:volumeItemType |
| Balance Type: |
na |
| Period Type: |
instant |
|
| X |
- DefinitionLine items represent financial concepts included in a table. These concepts are used to disclose reportable information associated with domain members defined in one or many axes to the table. Reference 1: http://www.xbrl.org/2003/role/disclosureRef
-Topic 932
-SubTopic 360
-Name Accounting Standards Codification
-Section S50
-Paragraph 5
-Publisher FASB
-URI https://asc.fasb.org/1943274/2147477385/932-360-S50-5
Reference 2: http://www.xbrl.org/2003/role/disclosureRef
-Topic 932
-SubTopic 10
-Name Accounting Standards Codification
-Section S99
-Paragraph 1
-Subparagraph (SX 210.4-10(c)(7)(i))
-Publisher FASB
-URI https://asc.fasb.org/1943274/2147479664/932-10-S99-1
| Name: |
us-gaap_AmortizationExpensePerEquivalentUnitOfProductionOrPerDollarOfGrossRevenueLineItems |
| Namespace Prefix: |
us-gaap_ |
| Data Type: |
xbrli:stringItemType |
| Balance Type: |
na |
| Period Type: |
duration |
|
| X |
- Details
| Name: |
srt_StatementGeographicalAxis=country_US |
| Namespace Prefix: |
|
| Data Type: |
na |
| Balance Type: |
|
| Period Type: |
|
|
| X |
- Details
| Name: |
srt_ReserveQuantitiesByTypeOfReserveAxis=srt_NaturalGasReservesMember |
| Namespace Prefix: |
|
| Data Type: |
na |
| Balance Type: |
|
| Period Type: |
|
|
| X |
- Details
| Name: |
srt_ReserveQuantitiesByTypeOfReserveAxis=srt_OilReservesMember |
| Namespace Prefix: |
|
| Data Type: |
na |
| Balance Type: |
|
| Period Type: |
|
|
| X |
- Details
| Name: |
srt_ReserveQuantitiesByTypeOfReserveAxis=srt_NaturalGasLiquidsReservesMember |
| Namespace Prefix: |
|
| Data Type: |
na |
| Balance Type: |
|
| Period Type: |
|
|
v3.25.0.1
STANDARDIZED MEASURE OF DISCOUNTED FUTURE NET CASH FLOWS (Details) - USD ($)
|
12 Months Ended |
|
Dec. 31, 2024 |
Dec. 31, 2023 |
Dec. 31, 2022 |
| Oil and Gas, Full Cost Method, Amortization Expense [Line Items] |
|
|
|
| Future cash flows from sales of oil and gas |
$ 4,427,982
|
$ 6,509,498
|
|
| Future cash flows from sales of oil and gas |
(2,400,990)
|
(3,804,439)
|
|
| Future cash flows from sales of oil and gas |
(155,628)
|
|
|
| Future cash flows from sales of oil and gas |
155,628
|
|
|
| Future cash flows from sales of oil and gas |
1,871,364
|
2,705,059
|
|
| Future cash flows from sales of oil and gas |
(748,094)
|
(1,140,335)
|
|
| Future cash flows from sales of oil and gas |
1,123,270
|
1,564,724
|
$ 5,163,159
|
| Sales, net of production costs |
39,359
|
(196,003)
|
|
| Accretion of discount |
156,472
|
516,316
|
|
| Net change in sales and transfer price, net of production costs |
(1,433,013)
|
(3,117,105)
|
|
| Net change in future development cost |
|
|
|
| Discoveries |
585,420
|
|
|
| Revision and others |
(33,056)
|
(645,668)
|
|
| Changes in production rates and other |
243,364
|
(155,975)
|
|
| Net |
(441,454)
|
(3,598,435)
|
|
| Beginning of year |
1,564,724
|
5,163,159
|
|
| End of year |
1,123,270
|
1,564,724
|
|
| UNITED STATES |
|
|
|
| Oil and Gas, Full Cost Method, Amortization Expense [Line Items] |
|
|
|
| Future cash flows from sales of oil and gas |
4,427,982
|
6,509,498
|
|
| Future cash flows from sales of oil and gas |
(2,400,990)
|
(3,804,439)
|
|
| Future cash flows from sales of oil and gas |
(155,628)
|
|
|
| Future cash flows from sales of oil and gas |
155,628
|
|
|
| Future cash flows from sales of oil and gas |
1,871,364
|
2,705,059
|
|
| Future cash flows from sales of oil and gas |
(748,094)
|
(1,140,335)
|
|
| Future cash flows from sales of oil and gas |
1,123,270
|
1,564,724
|
5,163,159
|
| Sales, net of production costs |
39,359
|
(196,003)
|
|
| Accretion of discount |
156,472
|
516,316
|
|
| Net change in sales and transfer price, net of production costs |
(1,433,013)
|
(3,117,105)
|
|
| Net change in future development cost |
|
|
|
| Discoveries |
585,420
|
|
|
| Revision and others |
(33,056)
|
(645,668)
|
|
| Changes in production rates and other |
243,364
|
(155,975)
|
|
| Net |
(441,454)
|
(3,598,435)
|
|
| Beginning of year |
1,564,724
|
5,163,159
|
|
| End of year |
1,123,270
|
1,564,724
|
|
| South America [Member] |
|
|
|
| Oil and Gas, Full Cost Method, Amortization Expense [Line Items] |
|
|
|
| Future cash flows from sales of oil and gas |
|
|
|
| Future cash flows from sales of oil and gas |
|
|
|
| Future cash flows from sales of oil and gas |
|
|
|
| Future cash flows from sales of oil and gas |
|
|
|
| Future cash flows from sales of oil and gas |
|
|
|
| Future cash flows from sales of oil and gas |
|
|
|
| Future cash flows from sales of oil and gas |
|
|
|
| Sales, net of production costs |
|
|
|
| Accretion of discount |
|
|
|
| Net change in sales and transfer price, net of production costs |
|
|
|
| Net change in future development cost |
|
|
|
| Discoveries |
|
|
|
| Revision and others |
|
|
|
| Changes in production rates and other |
|
|
|
| Net |
|
|
|
| Beginning of year |
|
|
|
| End of year |
|
|
|
| X |
- DefinitionThe change in the discounted value of the proved oil and gas reserves due to changes in production rates and other.
| Name: |
HUSA_ChangesInProductionRatesAndOther |
| Namespace Prefix: |
HUSA_ |
| Data Type: |
xbrli:monetaryItemType |
| Balance Type: |
debit |
| Period Type: |
duration |
|
| X |
- DefinitionAmount of estimated future accumulated cash inflow from the sale of proved oil and gas reserves. Reference 1: http://www.xbrl.org/2003/role/disclosureRef
-Name Form 20-F
-Number Part II
-Section Item 18
-Subparagraph (Instruction 2)
-Publisher SEC
Reference 2: http://www.xbrl.org/2003/role/exampleRef
-Topic 932
-SubTopic 235
-Name Accounting Standards Codification
-Section 55
-Paragraph 6
-Publisher FASB
-URI https://asc.fasb.org/1943274/2147477916/932-235-55-6
Reference 3: http://www.xbrl.org/2003/role/disclosureRef
-Topic 932
-SubTopic 235
-Name Accounting Standards Codification
-Section 50
-Paragraph 33
-Subparagraph (b)
-Publisher FASB
-URI https://asc.fasb.org/1943274/2147477215/932-235-50-33
Reference 4: http://www.xbrl.org/2003/role/exampleRef
-Topic 932
-SubTopic 235
-Name Accounting Standards Codification
-Section 50
-Paragraph 29
-Publisher FASB
-URI https://asc.fasb.org/1943274/2147477215/932-235-50-29
Reference 5: http://www.xbrl.org/2003/role/disclosureRef
-Topic 932
-SubTopic 235
-Name Accounting Standards Codification
-Section 50
-Paragraph 31
-Subparagraph (a)
-Publisher FASB
-URI https://asc.fasb.org/1943274/2147477215/932-235-50-31
Reference 6: http://www.xbrl.org/2003/role/disclosureRef
-Topic 932
-SubTopic 235
-Name Accounting Standards Codification
-Section 50
-Paragraph 33
-Subparagraph (a)
-Publisher FASB
-URI https://asc.fasb.org/1943274/2147477215/932-235-50-33
Reference 7: http://www.xbrl.org/2003/role/disclosureRef
-Name Accounting Standards Codification
-Section 50
-Paragraph 33
-SubTopic 235
-Topic 932
-Publisher FASB
-URI https://asc.fasb.org/1943274/2147477215/932-235-50-33
| Name: |
srt_FutureNetCashFlowsRelatingToProvedOilAndGasReservesCashInflows |
| Namespace Prefix: |
srt_ |
| Data Type: |
xbrli:monetaryItemType |
| Balance Type: |
debit |
| Period Type: |
instant |
|
| X |
- DefinitionAmount of estimated future accumulated cash outflow for costs to be incurred in developing proved oil and gas reserves. Reference 1: http://www.xbrl.org/2003/role/disclosureRef
-Name Form 20-F
-Number Part II
-Section Item 18
-Subparagraph (Instruction 2)
-Publisher SEC
Reference 2: http://www.xbrl.org/2003/role/disclosureRef
-Topic 932
-SubTopic 235
-Name Accounting Standards Codification
-Section 50
-Paragraph 33
-Subparagraph (b)
-Publisher FASB
-URI https://asc.fasb.org/1943274/2147477215/932-235-50-33
Reference 3: http://www.xbrl.org/2003/role/disclosureRef
-Topic 932
-SubTopic 235
-Name Accounting Standards Codification
-Section 50
-Paragraph 31
-Subparagraph (b)
-Publisher FASB
-URI https://asc.fasb.org/1943274/2147477215/932-235-50-31
Reference 4: http://www.xbrl.org/2003/role/disclosureRef
-Topic 932
-SubTopic 235
-Name Accounting Standards Codification
-Section 50
-Paragraph 33
-Subparagraph (a)
-Publisher FASB
-URI https://asc.fasb.org/1943274/2147477215/932-235-50-33
Reference 5: http://www.xbrl.org/2003/role/disclosureRef
-Name Accounting Standards Codification
-Section 50
-Paragraph 33
-SubTopic 235
-Topic 932
-Publisher FASB
-URI https://asc.fasb.org/1943274/2147477215/932-235-50-33
| Name: |
srt_FutureNetCashFlowsRelatingToProvedOilAndGasReservesDevelopmentCosts |
| Namespace Prefix: |
srt_ |
| Data Type: |
xbrli:monetaryItemType |
| Balance Type: |
credit |
| Period Type: |
instant |
|
| X |
- DefinitionAmount, after future accumulated cash outflow for development and production costs and future income tax, of estimated future accumulated cash inflow from the sale of proved oil and gas reserves. Reference 1: http://www.xbrl.org/2003/role/disclosureRef
-Name Form 20-F
-Number Part II
-Section Item 18
-Subparagraph (Instruction 2)
-Publisher SEC
Reference 2: http://www.xbrl.org/2003/role/exampleRef
-Topic 932
-SubTopic 235
-Name Accounting Standards Codification
-Section 55
-Paragraph 6
-Publisher FASB
-URI https://asc.fasb.org/1943274/2147477916/932-235-55-6
Reference 3: http://www.xbrl.org/2003/role/disclosureRef
-Topic 932
-SubTopic 235
-Name Accounting Standards Codification
-Section 50
-Paragraph 33
-Subparagraph (b)
-Publisher FASB
-URI https://asc.fasb.org/1943274/2147477215/932-235-50-33
Reference 4: http://www.xbrl.org/2003/role/exampleRef
-Topic 932
-SubTopic 235
-Name Accounting Standards Codification
-Section 50
-Paragraph 29
-Publisher FASB
-URI https://asc.fasb.org/1943274/2147477215/932-235-50-29
Reference 5: http://www.xbrl.org/2003/role/disclosureRef
-Topic 932
-SubTopic 235
-Name Accounting Standards Codification
-Section 50
-Paragraph 31
-Subparagraph (d)
-Publisher FASB
-URI https://asc.fasb.org/1943274/2147477215/932-235-50-31
Reference 6: http://www.xbrl.org/2003/role/disclosureRef
-Topic 932
-SubTopic 235
-Name Accounting Standards Codification
-Section 50
-Paragraph 33
-Subparagraph (a)
-Publisher FASB
-URI https://asc.fasb.org/1943274/2147477215/932-235-50-33
Reference 7: http://www.xbrl.org/2003/role/disclosureRef
-Name Accounting Standards Codification
-Section 50
-Paragraph 33
-SubTopic 235
-Topic 932
-Publisher FASB
-URI https://asc.fasb.org/1943274/2147477215/932-235-50-33
| Name: |
srt_FutureNetCashFlowsRelatingToProvedOilAndGasReservesNetCashFlows |
| Namespace Prefix: |
srt_ |
| Data Type: |
xbrli:monetaryItemType |
| Balance Type: |
debit |
| Period Type: |
instant |
|
| X |
- DefinitionAmount of estimated future accumulated cash outflow for costs to be incurred in producing proved oil and gas reserves. Reference 1: http://www.xbrl.org/2003/role/disclosureRef
-Name Form 20-F
-Number Part II
-Section Item 18
-Subparagraph (Instruction 2)
-Publisher SEC
Reference 2: http://www.xbrl.org/2003/role/disclosureRef
-Topic 932
-SubTopic 235
-Name Accounting Standards Codification
-Section 50
-Paragraph 33
-Subparagraph (b)
-Publisher FASB
-URI https://asc.fasb.org/1943274/2147477215/932-235-50-33
Reference 3: http://www.xbrl.org/2003/role/disclosureRef
-Topic 932
-SubTopic 235
-Name Accounting Standards Codification
-Section 50
-Paragraph 31
-Subparagraph (b)
-Publisher FASB
-URI https://asc.fasb.org/1943274/2147477215/932-235-50-31
Reference 4: http://www.xbrl.org/2003/role/disclosureRef
-Topic 932
-SubTopic 235
-Name Accounting Standards Codification
-Section 50
-Paragraph 33
-Subparagraph (a)
-Publisher FASB
-URI https://asc.fasb.org/1943274/2147477215/932-235-50-33
Reference 5: http://www.xbrl.org/2003/role/disclosureRef
-Name Accounting Standards Codification
-Section 50
-Paragraph 33
-SubTopic 235
-Topic 932
-Publisher FASB
-URI https://asc.fasb.org/1943274/2147477215/932-235-50-33
| Name: |
srt_FutureNetCashFlowsRelatingToProvedOilAndGasReservesProductionCosts |
| Namespace Prefix: |
srt_ |
| Data Type: |
xbrli:monetaryItemType |
| Balance Type: |
credit |
| Period Type: |
instant |
|
| X |
- DefinitionAmount of discount on future accumulated cash inflow, after deducting future accumulated cash outflow for development and production costs and future income tax, from sale of proved oil and gas reserves, using a discount rate of 10 percent a year. Reference 1: http://www.xbrl.org/2003/role/disclosureRef
-Name Form 20-F
-Number Part II
-Section Item 18
-Subparagraph (Instruction 2)
-Publisher SEC
Reference 2: http://www.xbrl.org/2003/role/exampleRef
-Topic 932
-SubTopic 235
-Name Accounting Standards Codification
-Section 55
-Paragraph 6
-Publisher FASB
-URI https://asc.fasb.org/1943274/2147477916/932-235-55-6
Reference 3: http://www.xbrl.org/2003/role/disclosureRef
-Topic 932
-SubTopic 235
-Name Accounting Standards Codification
-Section 50
-Paragraph 33
-Subparagraph (b)
-Publisher FASB
-URI https://asc.fasb.org/1943274/2147477215/932-235-50-33
Reference 4: http://www.xbrl.org/2003/role/exampleRef
-Topic 932
-SubTopic 235
-Name Accounting Standards Codification
-Section 50
-Paragraph 29
-Publisher FASB
-URI https://asc.fasb.org/1943274/2147477215/932-235-50-29
Reference 5: http://www.xbrl.org/2003/role/disclosureRef
-Topic 932
-SubTopic 235
-Name Accounting Standards Codification
-Section 50
-Paragraph 31
-Subparagraph (e)
-Publisher FASB
-URI https://asc.fasb.org/1943274/2147477215/932-235-50-31
Reference 6: http://www.xbrl.org/2003/role/disclosureRef
-Topic 932
-SubTopic 235
-Name Accounting Standards Codification
-Section 50
-Paragraph 33
-Subparagraph (a)
-Publisher FASB
-URI https://asc.fasb.org/1943274/2147477215/932-235-50-33
Reference 7: http://www.xbrl.org/2003/role/disclosureRef
-Name Accounting Standards Codification
-Section 50
-Paragraph 33
-SubTopic 235
-Topic 932
-Publisher FASB
-URI https://asc.fasb.org/1943274/2147477215/932-235-50-33
| Name: |
srt_FutureNetCashFlowsRelatingToProvedOilAndGasReservesTenPercentAnnualDiscountForEstimatedTimingOfCashFlows |
| Namespace Prefix: |
srt_ |
| Data Type: |
xbrli:monetaryItemType |
| Balance Type: |
credit |
| Period Type: |
instant |
|
| X |
- DefinitionAmount of increase (decrease) in standardized measure of discounted future net cash flow as a result of change in estimated future development costs. Reference 1: http://www.xbrl.org/2003/role/disclosureRef
-Name Form 20-F
-Number Part II
-Section Item 18
-Subparagraph (Instruction 2)
-Publisher SEC
Reference 2: http://www.xbrl.org/2003/role/exampleRef
-Topic 932
-SubTopic 235
-Name Accounting Standards Codification
-Section 55
-Paragraph 7
-Publisher FASB
-URI https://asc.fasb.org/1943274/2147477916/932-235-55-7
Reference 3: http://www.xbrl.org/2003/role/disclosureRef
-Topic 932
-SubTopic 235
-Name Accounting Standards Codification
-Section 50
-Paragraph 35A
-Subparagraph (b)
-Publisher FASB
-URI https://asc.fasb.org/1943274/2147477215/932-235-50-35A
Reference 4: http://www.xbrl.org/2003/role/exampleRef
-Topic 932
-SubTopic 235
-Name Accounting Standards Codification
-Section 50
-Paragraph 34
-Publisher FASB
-URI https://asc.fasb.org/1943274/2147477215/932-235-50-34
Reference 5: http://www.xbrl.org/2003/role/disclosureRef
-Topic 932
-SubTopic 235
-Name Accounting Standards Codification
-Section 50
-Paragraph 35A
-Subparagraph (a)
-Publisher FASB
-URI https://asc.fasb.org/1943274/2147477215/932-235-50-35A
Reference 6: http://www.xbrl.org/2003/role/disclosureRef
-Name Accounting Standards Codification
-Section 50
-Paragraph 35A
-SubTopic 235
-Topic 932
-Publisher FASB
-URI https://asc.fasb.org/1943274/2147477215/932-235-50-35A
Reference 7: http://www.xbrl.org/2003/role/disclosureRef
-Name Accounting Standards Codification
-Section 50
-Paragraph 35
-Subparagraph (b)
-SubTopic 235
-Topic 932
-Publisher FASB
-URI https://asc.fasb.org/1943274/2147477215/932-235-50-35
| Name: |
srt_IncreaseDecreaseInEstimatedFutureDevelopmentCosts |
| Namespace Prefix: |
srt_ |
| Data Type: |
xbrli:monetaryItemType |
| Balance Type: |
debit |
| Period Type: |
duration |
|
| X |
- DefinitionAmount of increase (decrease) in standardized measure of discounted future net cash flow as a result of change in sales and transfer prices and in production (lifting) costs related to future production. Reference 1: http://www.xbrl.org/2003/role/disclosureRef
-Name Form 20-F
-Number Part II
-Section Item 18
-Subparagraph (Instruction 2)
-Publisher SEC
Reference 2: http://www.xbrl.org/2003/role/exampleRef
-Topic 932
-SubTopic 235
-Name Accounting Standards Codification
-Section 55
-Paragraph 7
-Publisher FASB
-URI https://asc.fasb.org/1943274/2147477916/932-235-55-7
Reference 3: http://www.xbrl.org/2003/role/disclosureRef
-Topic 932
-SubTopic 235
-Name Accounting Standards Codification
-Section 50
-Paragraph 35A
-Subparagraph (b)
-Publisher FASB
-URI https://asc.fasb.org/1943274/2147477215/932-235-50-35A
Reference 4: http://www.xbrl.org/2003/role/exampleRef
-Topic 932
-SubTopic 235
-Name Accounting Standards Codification
-Section 50
-Paragraph 34
-Publisher FASB
-URI https://asc.fasb.org/1943274/2147477215/932-235-50-34
Reference 5: http://www.xbrl.org/2003/role/disclosureRef
-Topic 932
-SubTopic 235
-Name Accounting Standards Codification
-Section 50
-Paragraph 35A
-Subparagraph (a)
-Publisher FASB
-URI https://asc.fasb.org/1943274/2147477215/932-235-50-35A
Reference 6: http://www.xbrl.org/2003/role/disclosureRef
-Name Accounting Standards Codification
-Section 50
-Paragraph 35A
-SubTopic 235
-Topic 932
-Publisher FASB
-URI https://asc.fasb.org/1943274/2147477215/932-235-50-35A
Reference 7: http://www.xbrl.org/2003/role/disclosureRef
-Name Accounting Standards Codification
-Section 50
-Paragraph 35
-Subparagraph (a)
-SubTopic 235
-Topic 932
-Publisher FASB
-URI https://asc.fasb.org/1943274/2147477215/932-235-50-35
| Name: |
srt_NetIncreaseDecreaseInSalesAndTransferPricesAndProductionCosts |
| Namespace Prefix: |
srt_ |
| Data Type: |
xbrli:monetaryItemType |
| Balance Type: |
debit |
| Period Type: |
duration |
|
| X |
- DefinitionAmount of increase (decrease) in standardized measure of discounted future net cash flow as a result of revisions of estimated quantity of oil and gas in proved reserves. Reference 1: http://www.xbrl.org/2003/role/disclosureRef
-Name Form 20-F
-Number Part II
-Section Item 18
-Subparagraph (Instruction 2)
-Publisher SEC
Reference 2: http://www.xbrl.org/2003/role/exampleRef
-Topic 932
-SubTopic 235
-Name Accounting Standards Codification
-Section 55
-Paragraph 7
-Publisher FASB
-URI https://asc.fasb.org/1943274/2147477916/932-235-55-7
Reference 3: http://www.xbrl.org/2003/role/disclosureRef
-Topic 932
-SubTopic 235
-Name Accounting Standards Codification
-Section 50
-Paragraph 35A
-Subparagraph (b)
-Publisher FASB
-URI https://asc.fasb.org/1943274/2147477215/932-235-50-35A
Reference 4: http://www.xbrl.org/2003/role/exampleRef
-Topic 932
-SubTopic 235
-Name Accounting Standards Codification
-Section 50
-Paragraph 34
-Publisher FASB
-URI https://asc.fasb.org/1943274/2147477215/932-235-50-34
Reference 5: http://www.xbrl.org/2003/role/disclosureRef
-Topic 932
-SubTopic 235
-Name Accounting Standards Codification
-Section 50
-Paragraph 35A
-Subparagraph (a)
-Publisher FASB
-URI https://asc.fasb.org/1943274/2147477215/932-235-50-35A
Reference 6: http://www.xbrl.org/2003/role/disclosureRef
-Name Accounting Standards Codification
-Section 50
-Paragraph 35A
-SubTopic 235
-Topic 932
-Publisher FASB
-URI https://asc.fasb.org/1943274/2147477215/932-235-50-35A
Reference 7: http://www.xbrl.org/2003/role/disclosureRef
-Name Accounting Standards Codification
-Section 50
-Paragraph 35
-Subparagraph (f)
-SubTopic 235
-Topic 932
-Publisher FASB
-URI https://asc.fasb.org/1943274/2147477215/932-235-50-35
| Name: |
srt_RevisionsOfPreviousQuantityEstimates |
| Namespace Prefix: |
srt_ |
| Data Type: |
xbrli:monetaryItemType |
| Balance Type: |
debit |
| Period Type: |
duration |
|
| X |
- DefinitionAmount of (increase) decrease in standardized measure of discounted future net cash flow as a result of sales and transfers of oil and gas produced. Reference 1: http://www.xbrl.org/2003/role/disclosureRef
-Name Form 20-F
-Number Part II
-Section Item 18
-Subparagraph (Instruction 2)
-Publisher SEC
Reference 2: http://www.xbrl.org/2003/role/exampleRef
-Topic 932
-SubTopic 235
-Name Accounting Standards Codification
-Section 55
-Paragraph 7
-Publisher FASB
-URI https://asc.fasb.org/1943274/2147477916/932-235-55-7
Reference 3: http://www.xbrl.org/2003/role/disclosureRef
-Topic 932
-SubTopic 235
-Name Accounting Standards Codification
-Section 50
-Paragraph 35A
-Subparagraph (b)
-Publisher FASB
-URI https://asc.fasb.org/1943274/2147477215/932-235-50-35A
Reference 4: http://www.xbrl.org/2003/role/exampleRef
-Topic 932
-SubTopic 235
-Name Accounting Standards Codification
-Section 50
-Paragraph 34
-Publisher FASB
-URI https://asc.fasb.org/1943274/2147477215/932-235-50-34
Reference 5: http://www.xbrl.org/2003/role/disclosureRef
-Topic 932
-SubTopic 235
-Name Accounting Standards Codification
-Section 50
-Paragraph 35A
-Subparagraph (a)
-Publisher FASB
-URI https://asc.fasb.org/1943274/2147477215/932-235-50-35A
Reference 6: http://www.xbrl.org/2003/role/disclosureRef
-Name Accounting Standards Codification
-Section 50
-Paragraph 35A
-SubTopic 235
-Topic 932
-Publisher FASB
-URI https://asc.fasb.org/1943274/2147477215/932-235-50-35A
Reference 7: http://www.xbrl.org/2003/role/disclosureRef
-Name Accounting Standards Codification
-Section 50
-Paragraph 35
-Subparagraph (c)
-SubTopic 235
-Topic 932
-Publisher FASB
-URI https://asc.fasb.org/1943274/2147477215/932-235-50-35
| Name: |
srt_SalesAndTransfersOfOilAndGasProducedNetOfProductionCosts |
| Namespace Prefix: |
srt_ |
| Data Type: |
xbrli:monetaryItemType |
| Balance Type: |
credit |
| Period Type: |
duration |
|
| X |
- DefinitionAmount of increase (decrease) in standardized measure of discounted future net cash flow relating to proved oil and gas reserves. Reference 1: http://www.xbrl.org/2003/role/disclosureRef
-Name Form 20-F
-Number Part II
-Section Item 18
-Subparagraph (Instruction 2)
-Publisher SEC
Reference 2: http://www.xbrl.org/2003/role/exampleRef
-Topic 932
-SubTopic 235
-Name Accounting Standards Codification
-Section 55
-Paragraph 7
-Publisher FASB
-URI https://asc.fasb.org/1943274/2147477916/932-235-55-7
Reference 3: http://www.xbrl.org/2003/role/exampleRef
-Topic 932
-SubTopic 235
-Name Accounting Standards Codification
-Section 50
-Paragraph 34
-Publisher FASB
-URI https://asc.fasb.org/1943274/2147477215/932-235-50-34
Reference 4: http://www.xbrl.org/2009/role/commonPracticeRef
-Topic 932
-SubTopic 235
-Name Accounting Standards Codification
-Section 50
-Paragraph 35A
-Publisher FASB
-URI https://asc.fasb.org/1943274/2147477215/932-235-50-35A
Reference 5: http://www.xbrl.org/2009/role/commonPracticeRef
-Topic 932
-SubTopic 235
-Name Accounting Standards Codification
-Section 50
-Paragraph 35
-Publisher FASB
-URI https://asc.fasb.org/1943274/2147477215/932-235-50-35
Reference 6: http://www.xbrl.org/2009/role/commonPracticeRef
-Topic 932
-SubTopic 235
-Name Accounting Standards Codification
-Section 50
-Paragraph 35A
-Subparagraph (b)
-Publisher FASB
-URI https://asc.fasb.org/1943274/2147477215/932-235-50-35A
Reference 7: http://www.xbrl.org/2009/role/commonPracticeRef
-Topic 932
-SubTopic 235
-Name Accounting Standards Codification
-Section 50
-Paragraph 35A
-Subparagraph (a)
-Publisher FASB
-URI https://asc.fasb.org/1943274/2147477215/932-235-50-35A
| Name: |
srt_StandardizedMeasureOfDiscountedFutureNetCashFlowOfProvedOilAndGasReservesPeriodIncreaseDecrease |
| Namespace Prefix: |
srt_ |
| Data Type: |
xbrli:monetaryItemType |
| Balance Type: |
na |
| Period Type: |
duration |
|
| X |
- DefinitionAmount of accretion of discount for the standardized measure of discounted future net cash flow related to proved oil and gas reserves. Reference 1: http://www.xbrl.org/2003/role/disclosureRef
-Name Form 20-F
-Number Part II
-Section Item 18
-Subparagraph (Instruction 2)
-Publisher SEC
Reference 2: http://www.xbrl.org/2003/role/exampleRef
-Topic 932
-SubTopic 235
-Name Accounting Standards Codification
-Section 55
-Paragraph 7
-Publisher FASB
-URI https://asc.fasb.org/1943274/2147477916/932-235-55-7
Reference 3: http://www.xbrl.org/2003/role/disclosureRef
-Topic 932
-SubTopic 235
-Name Accounting Standards Codification
-Section 50
-Paragraph 35A
-Subparagraph (b)
-Publisher FASB
-URI https://asc.fasb.org/1943274/2147477215/932-235-50-35A
Reference 4: http://www.xbrl.org/2003/role/exampleRef
-Topic 932
-SubTopic 235
-Name Accounting Standards Codification
-Section 50
-Paragraph 34
-Publisher FASB
-URI https://asc.fasb.org/1943274/2147477215/932-235-50-34
Reference 5: http://www.xbrl.org/2003/role/disclosureRef
-Topic 932
-SubTopic 235
-Name Accounting Standards Codification
-Section 50
-Paragraph 35A
-Subparagraph (a)
-Publisher FASB
-URI https://asc.fasb.org/1943274/2147477215/932-235-50-35A
Reference 6: http://www.xbrl.org/2003/role/disclosureRef
-Name Accounting Standards Codification
-Section 50
-Paragraph 35A
-SubTopic 235
-Topic 932
-Publisher FASB
-URI https://asc.fasb.org/1943274/2147477215/932-235-50-35A
Reference 7: http://www.xbrl.org/2003/role/disclosureRef
-Name Accounting Standards Codification
-Section 50
-Paragraph 35
-Subparagraph (h)
-SubTopic 235
-Topic 932
-Publisher FASB
-URI https://asc.fasb.org/1943274/2147477215/932-235-50-35
| Name: |
srt_StandardizedMeasureOfDiscountedFutureNetCashFlowRelatingToProvedOilAndGasReservesAccretionOfDiscount |
| Namespace Prefix: |
srt_ |
| Data Type: |
xbrli:monetaryItemType |
| Balance Type: |
credit |
| Period Type: |
duration |
|
| X |
- DefinitionAmount of discounted future accumulated cash inflow relating to proved oil and gas reserves. Reference 1: http://www.xbrl.org/2003/role/disclosureRef
-Name Form 20-F
-Number Part II
-Section Item 18
-Subparagraph (Instruction 2)
-Publisher SEC
Reference 2: http://www.xbrl.org/2003/role/exampleRef
-Topic 932
-SubTopic 235
-Name Accounting Standards Codification
-Section 55
-Paragraph 6
-Publisher FASB
-URI https://asc.fasb.org/1943274/2147477916/932-235-55-6
Reference 3: http://www.xbrl.org/2003/role/disclosureRef
-Topic 932
-SubTopic 235
-Name Accounting Standards Codification
-Section 50
-Paragraph 35A
-Subparagraph (b)
-Publisher FASB
-URI https://asc.fasb.org/1943274/2147477215/932-235-50-35A
Reference 4: http://www.xbrl.org/2003/role/disclosureRef
-Topic 932
-SubTopic 235
-Name Accounting Standards Codification
-Section 50
-Paragraph 33
-Subparagraph (b)
-Publisher FASB
-URI https://asc.fasb.org/1943274/2147477215/932-235-50-33
Reference 5: http://www.xbrl.org/2003/role/exampleRef
-Topic 932
-SubTopic 235
-Name Accounting Standards Codification
-Section 50
-Paragraph 29
-Publisher FASB
-URI https://asc.fasb.org/1943274/2147477215/932-235-50-29
Reference 6: http://www.xbrl.org/2003/role/disclosureRef
-Topic 932
-SubTopic 235
-Name Accounting Standards Codification
-Section 50
-Paragraph 35A
-Subparagraph (a)
-Publisher FASB
-URI https://asc.fasb.org/1943274/2147477215/932-235-50-35A
Reference 7: http://www.xbrl.org/2003/role/disclosureRef
-Topic 932
-SubTopic 235
-Name Accounting Standards Codification
-Section 50
-Paragraph 31
-Subparagraph (f)
-Publisher FASB
-URI https://asc.fasb.org/1943274/2147477215/932-235-50-31
Reference 8: http://www.xbrl.org/2003/role/disclosureRef
-Topic 932
-SubTopic 235
-Name Accounting Standards Codification
-Section 50
-Paragraph 33
-Subparagraph (a)
-Publisher FASB
-URI https://asc.fasb.org/1943274/2147477215/932-235-50-33
Reference 9: http://www.xbrl.org/2009/role/commonPracticeRef
-Topic 932
-SubTopic 235
-Name Accounting Standards Codification
-Section 50
-Paragraph 35A
-Publisher FASB
-URI https://asc.fasb.org/1943274/2147477215/932-235-50-35A
Reference 10: http://www.xbrl.org/2003/role/disclosureRef
-Name Accounting Standards Codification
-Section 50
-Paragraph 35
-SubTopic 235
-Topic 932
-Publisher FASB
-URI https://asc.fasb.org/1943274/2147477215/932-235-50-35
Reference 11: http://www.xbrl.org/2003/role/disclosureRef
-Name Accounting Standards Codification
-Section 50
-Paragraph 30
-SubTopic 235
-Topic 932
-Publisher FASB
-URI https://asc.fasb.org/1943274/2147477215/932-235-50-30
Reference 12: http://www.xbrl.org/2003/role/disclosureRef
-Name Accounting Standards Codification
-Section 50
-Paragraph 33
-SubTopic 235
-Topic 932
-Publisher FASB
-URI https://asc.fasb.org/1943274/2147477215/932-235-50-33
| Name: |
srt_StandardizedMeasureOfDiscountedFutureNetCashFlowsRelatingToProvedOilAndGasReserves |
| Namespace Prefix: |
srt_ |
| Data Type: |
xbrli:monetaryItemType |
| Balance Type: |
debit |
| Period Type: |
instant |
|
| X |
- DefinitionLine items represent financial concepts included in a table. These concepts are used to disclose reportable information associated with domain members defined in one or many axes to the table. Reference 1: http://www.xbrl.org/2003/role/disclosureRef
-Topic 932
-SubTopic 360
-Name Accounting Standards Codification
-Section S50
-Paragraph 5
-Publisher FASB
-URI https://asc.fasb.org/1943274/2147477385/932-360-S50-5
Reference 2: http://www.xbrl.org/2003/role/disclosureRef
-Topic 932
-SubTopic 10
-Name Accounting Standards Codification
-Section S99
-Paragraph 1
-Subparagraph (SX 210.4-10(c)(7)(i))
-Publisher FASB
-URI https://asc.fasb.org/1943274/2147479664/932-10-S99-1
| Name: |
us-gaap_AmortizationExpensePerEquivalentUnitOfProductionOrPerDollarOfGrossRevenueLineItems |
| Namespace Prefix: |
us-gaap_ |
| Data Type: |
xbrli:stringItemType |
| Balance Type: |
na |
| Period Type: |
duration |
|
| X |
- Details
| Name: |
srt_StatementGeographicalAxis=country_US |
| Namespace Prefix: |
|
| Data Type: |
na |
| Balance Type: |
|
| Period Type: |
|
|
| X |
- Details
| Name: |
srt_StatementGeographicalAxis=srt_SouthAmericaMember |
| Namespace Prefix: |
|
| Data Type: |
na |
| Balance Type: |
|
| Period Type: |
|
|
v3.25.0.1
| X |
- DefinitionAmortization rate per unit.
| Name: |
HUSA_AmortizationRatePerShare |
| Namespace Prefix: |
HUSA_ |
| Data Type: |
dtr-types:perShareItemType |
| Balance Type: |
na |
| Period Type: |
instant |
|
| X |
- DefinitionRefers to minimum experience of Vice President of independent professional engineering firm in production engineering, reservoir engineering, acquisitions and divestments, field operations and management, in 'PnYnMnDTnHnMnS' format, for example, 'P1Y5M13D' represents the reported fact of one year, five months, and thirteen days.
| Name: |
HUSA_MinimumExperienceOfVicePresidentOfIndependentProfessionalEngineeringFirm |
| Namespace Prefix: |
HUSA_ |
| Data Type: |
xbrli:durationItemType |
| Balance Type: |
na |
| Period Type: |
duration |
|
| X |
- DefinitionRefers to period of average prices used in calculating proved oil and gas reserves, in 'PnYnMnDTnHnMnS' format, for example, 'P1Y5M13D' represents the reported fact of one year, five months, and thirteen days.
| Name: |
HUSA_PeriodOfAveragePricesUsedInCalculatingProvedOilAndGasReserves |
| Namespace Prefix: |
HUSA_ |
| Data Type: |
xbrli:durationItemType |
| Balance Type: |
na |
| Period Type: |
duration |
|
| X |
- DefinitionLine items represent financial concepts included in a table. These concepts are used to disclose reportable information associated with domain members defined in one or many axes to the table. Reference 1: http://www.xbrl.org/2003/role/disclosureRef
-Topic 932
-SubTopic 360
-Name Accounting Standards Codification
-Section S50
-Paragraph 5
-Publisher FASB
-URI https://asc.fasb.org/1943274/2147477385/932-360-S50-5
Reference 2: http://www.xbrl.org/2003/role/disclosureRef
-Topic 932
-SubTopic 10
-Name Accounting Standards Codification
-Section S99
-Paragraph 1
-Subparagraph (SX 210.4-10(c)(7)(i))
-Publisher FASB
-URI https://asc.fasb.org/1943274/2147479664/932-10-S99-1
| Name: |
us-gaap_AmortizationExpensePerEquivalentUnitOfProductionOrPerDollarOfGrossRevenueLineItems |
| Namespace Prefix: |
us-gaap_ |
| Data Type: |
xbrli:stringItemType |
| Balance Type: |
na |
| Period Type: |
duration |
|
| X |
- Details
| Name: |
srt_StatementGeographicalAxis=country_US |
| Namespace Prefix: |
|
| Data Type: |
na |
| Balance Type: |
|
| Period Type: |
|
|
Houston American Energy (AMEX:HUSA)
Gráfico Histórico do Ativo
De Jan 2025 até Fev 2025

Houston American Energy (AMEX:HUSA)
Gráfico Histórico do Ativo
De Fev 2024 até Fev 2025

