United-Guardian Reports Increased Second Quarter Sales & Earnings
09 Agosto 2024 - 10:00AM

United-Guardian, Inc. (NASDAQ:UG) announced today the financial
results for the second quarter and first half of 2024. Sales for
the six-month period ended June 30th increased from $5,220,623 in
2023 to $6,645,149 in 2024 and net income increased from $1,217,175
($0.26 per share) to $1,881,667 ($0.41 per share) for the same
period. Second quarter sales increased from $2,650,299 in 2023 to
$3,390,205 in 2024, with net income increasing from $461,094 ($0.10
per share) to $956,225 ($0.21 per share).
Donna Vigilante, President of United-Guardian,
stated, “We are pleased to announce that sales increased for both
the second quarter and the first six months of 2024 compared with
the same periods in 2023. Cosmetic ingredient sales increased by
84% in the second quarter and 115% for the first six months of
2024. This increase was primarily attributable to purchases from
our largest cosmetic distributor. Sales of medical lubricants
increased as well for both the second quarter and first six months
of 2024 by 15% and 9% respectively. Pharmaceutical product sales
increased in the second quarter by 3% but decreased 13% for the
first six months of 2024. The decrease for the six-month period was
attributable to a shutdown we experienced with our contract
manufacturer for Renacidin® late last year. Renacidin production
resumed in late March, and sales are in the process of
recovering.”
United-Guardian is a manufacturer of cosmetic
ingredients, pharmaceuticals, medical lubricants, and sexual
wellness ingredients.
|
Contact: |
Donna
Vigilante |
| |
(631) 273-0900 |
| |
dvigilante@u-g.com |
NOTE: This press release contains both
historical and "forward-looking statements” within the meaning of
the Private Securities Litigation Reform Act of 1995. These
statements about the company’s expectations or beliefs concerning
future events, such as financial performance, business prospects,
and similar matters, are being made in reliance upon the “safe
harbor” provisions of that Act. Such statements are subject to a
variety of factors that could cause our actual results or
performance to differ materially from the anticipated results or
performance expressed or implied by such forward-looking
statements. For further information about the risks and
uncertainties that may affect the company’s business please refer
to the company's reports and filings with the Securities and
Exchange Commission.
|
|
|
|
Financial Results for theThree and Six
Months EndedJune 30, 2024 and
2023STATEMENTS OF INCOME(unaudited) |
|
|
|
|
| |
|
THREE MONTHS ENDED JUNE 30, |
|
|
SIX MONTHS ENDED JUNE 30, |
|
| |
|
2024 |
|
|
2023 |
|
|
2024 |
|
|
2023 |
|
|
|
|
|
|
|
|
|
|
|
|
|
|
|
|
|
|
|
| Net
sales |
|
$ |
3,390,205 |
|
|
$ |
2,650,299 |
|
|
$ |
6,645,149 |
|
|
$ |
5,220,623 |
|
| |
|
|
|
|
|
|
|
|
|
|
|
|
|
|
|
|
| Costs and
expenses: |
|
|
|
|
|
|
|
|
|
|
|
|
|
|
|
|
|
Cost of sales |
|
|
1,561,090 |
|
|
|
1,429,407 |
|
|
|
3,117,580 |
|
|
|
2,523,002 |
|
|
Operating expenses |
|
|
602,777 |
|
|
|
574,093 |
|
|
|
1,171,642 |
|
|
|
1,092,039 |
|
|
Research and development expense |
|
|
111,660 |
|
|
|
128,729 |
|
|
|
214,642 |
|
|
|
255,688 |
|
|
Total costs and expenses |
|
|
2,275,527 |
|
|
|
2,132,229 |
|
|
|
4,503,864 |
|
|
|
3,870,729 |
|
|
Income from operations |
|
|
1,114,678 |
|
|
|
518,070 |
|
|
|
2,141,285 |
|
|
|
1,349,894 |
|
| |
|
|
|
|
|
|
|
|
|
|
|
|
|
|
|
|
| Other income
(expense): |
|
|
|
|
|
|
|
|
|
|
|
|
|
|
|
|
|
Investment income |
|
|
100,007 |
|
|
|
54,950 |
|
|
|
198,080 |
|
|
|
102,582 |
|
|
Net (loss) gain on marketable securities |
|
|
(9,501 |
) |
|
|
7,479 |
|
|
|
31,995 |
|
|
|
80,180 |
|
|
Total other income |
|
|
90,506 |
|
|
|
62,429 |
|
|
|
230,075 |
|
|
|
182,762 |
|
|
Income before provision for income taxes |
|
|
1,205,184 |
|
|
|
580,499 |
|
|
|
2,371,360 |
|
|
|
1,532,656 |
|
| |
|
|
|
|
|
|
|
|
|
|
|
|
|
|
|
|
| Provision for income
taxes |
|
|
248,959 |
|
|
|
119,405 |
|
|
|
489,693 |
|
|
|
315,481 |
|
|
Net income |
|
$ |
956,225 |
|
|
$ |
461,094 |
|
|
$ |
1,881,667 |
|
|
$ |
1,217,175 |
|
| |
|
|
|
|
|
|
|
|
|
|
|
|
|
|
|
|
| Earnings per common
share (basic and diluted) |
|
$ |
0.21 |
|
|
$ |
0.10 |
|
|
$ |
0.41 |
|
|
$ |
0.26 |
|
| |
|
|
|
|
|
|
|
|
|
|
|
|
|
|
|
|
| Weighted average
shares (basic and diluted) |
|
|
4,594,319 |
|
|
|
4,594,319 |
|
|
|
4,594,319 |
|
|
|
4,594,319 |
|
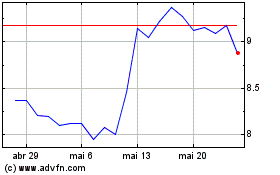
United Guardian (NASDAQ:UG)
Gráfico Histórico do Ativo
De Fev 2025 até Mar 2025

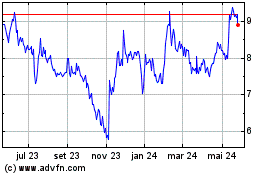
United Guardian (NASDAQ:UG)
Gráfico Histórico do Ativo
De Mar 2024 até Mar 2025
