Solana Targets $209 Mark With A Recovery Above The 4-hour SMA
16 Janeiro 2025 - 11:00AM
NEWSBTC
Solana price action has taken a bullish turn, with the
cryptocurrency reclaiming the critical 4-hour Simple Moving Average
(SMA) and setting its sights on the $209 resistance level. This
recovery reflects renewed buying interest and growing optimism
among traders as SOL bounces back from recent consolidation.
Drawing closer to $209, SOL is seeing increased trading activity,
underscoring heightened confidence in the asset’s potential for
further upside. However, the journey to $209 presents challenges as
resistance levels and possible profit-taking could temper the pace
of the rally. Maintaining this upward trajectory will require
sustained buying pressure and strong market support. With Bulls
leading the charge, Solana’s performance at the $209 level might be
a defining moment. A successful breakout would confirm the recovery
and open the door for more gains, reinforcing bullish sentiment
surrounding the cryptocurrency. Technical Indicators Signal Renewed
Buying Pressure Several technical indicators are pointing to
renewed buying pressure for Solana, suggesting that bulls are
regaining control of the market. A key signal comes from the
altcoin’s recent move above the 4-hour SMA, a widely regarded
indicator of short-term momentum. Related Reading: Solana (SOL)
Back Above $200: Will It Hold or Fade? This breakout often reflects
a shift in sentiment, with buyers gaining strength and setting the
stage for possible upside. The 4-hour SMA now serves as a critical
support level, reinforcing confidence in the bullish trend as long
as the price remains above it. Adding to this optimism is the
Relative Strength Index (RSI), which has surged above the 50%
neutral mark and is steadily climbing. The RSI’s position in
bullish territory indicates that buying activity is outpacing
selling pressure as traders are increasingly confident in SOL’s
ability to sustain upward movement. If the RSI continues to rise
but remains below overbought levels, it could create room for
further growth without immediate risk of a reversal. With the
4-hour SMA and RSI painting a positive technical picture for
Solana, its rally might extend toward higher resistance levels.
However, keeping a close eye on these indicators for signs of
exhaustion is important since any dips below the 4-hour SMA or an
RSI overextension may hint at a potential pullback. For now, the
market remains optimistic as technical signals align in favor of
the bulls. Resistance At $209: A Make-Or-Break Moment For Solana
The $209 resistance level is a decisive point, marking a key moment
in SOL’s upward journey. A breakout above this level would validate
the uptrend and pave the way for additional gains. Surpassing $209
may cause Solana’s upward momentum to extend to test higher
resistance levels such as $240 and $260. Related Reading: Solana
Reclaims Key Levels Amid Market Volatility – Reclaim $210 And New
Highs Are Next However, if Solana fails to break through the $209
level, it could result in a pullback, with the price potentially
testing lower support levels like $194 and $164. This might lead to
a phase of consolidation, where the market re-evaluates its next
move before attempting another rally. Featured image from Adobe
Stock, chart from Tradingview.com
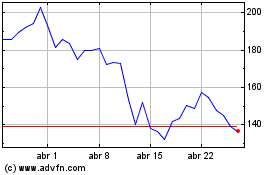
Solana (COIN:SOLUSD)
Gráfico Histórico do Ativo
De Dez 2024 até Jan 2025

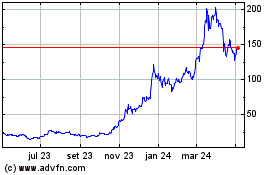
Solana (COIN:SOLUSD)
Gráfico Histórico do Ativo
De Jan 2024 até Jan 2025
