Amazon.com’s (AMZN) third quarter loss of 60
cents came in 52 cents higher than the Zacks Consensus Estimate.
Around 37 cents related to its share of losses in LivingSocial.
Similar to the technology companies Intel
(INTC), Microsoft (MSFT), Advanced Micro
Devices (AMD), Yahoo (YHOO),
Texas Instruments (TXN) and
Corning (GLW), Amazon shares started sliding prior
to the earnings release, as investors remain bearish on the
sector.
While Amazon’s miss was huge, weak results were expected because
of its investment focus. Therefore, shares were down just 1.0% in
after-hours trading.
Revenue
Amazon reported revenue of $13.81 billion, up 7.6% sequentially
and 26.9% from the year-ago quarter. This was better than the
guidance for the quarter of $12.9-14.3 billion billion (up 6.0%
sequentially, or up 25.0% year over year at the mid-point) and more
or less in-line with consensus expectations. Year-over-year revenue
growth was 30% excluding unfavorable currency impact.
Around 57% of sales were generated in North America,
representing a sequential increase of 7.6% and a year-over-year
increase of 32.9%. The balance came from the International segment,
which grew 7.5% sequentially and 19.8% year over year (27%
excluding unfavorable currency impact).
Active customer accounts increased by 8 million to more than 188
million. Active seller accounts stayed above 2 million. Paid
(third-party) units were 41% of total units in the third quarter,
compared to 40% in the second quarter.
Key strategies for driving revenue growth remain a vast
selection, competitive pricing, free shipping, user experience on
Amazon properties and the Amazon Prime program. Fulfillment centers
are also important, since they are essential for providing the
level of customer service that Amazon customers have come to expect
of the company. Over the past year, Amazon has been investing
heavily in fulfillment and technology & content.
Segment Details
Amazon’s North America Media business was up 18.2% sequentially
and 14.9% from last year. The consumption of digital content across
categories is helping the business. While selling and lending books
on the Kindle platform continues, Amazon has is also developing its
direct publishing business.
In addition to Kindle ebooks, Amazon is going great guns with
its video content. Prime Instant Video has the broadest reach,
across Kindles, Microsoft’s Xbox 360, Sony’s (SNE)
Playstation 3, Apple’s (AAPL) Mac or other PCs, as
well as on TV. At the same time, titles were expanded to 30,000
movies and TV episodes in the last quarter. Amazon’s reach and
value proposition are making it a key player in the video
distribution business, providing stiff competition to the likes of
Netflix (NFLX). The category saw strong
double-digit growth in four of the last five quarters.
The Electronics and General Merchandise (EGM) business in North
America was up 2.5% sequentially and 39.2% from last year. EGM is a
more seasonal business with holiday-driven spending having a
significant impact.
This seasonality has increased manifold since Amazon launched
the Kindle platform. Therefore, year-over-year comparisons are more
meaningful. We see very strong double-digit growth in each quarter
since December 2009, which is indicative of the expansion in the
market and Amazon’s growing position within it.
Amazon’s International media business (17% of total revenue) was
up 6.2% sequentially and 7.1% year over year. EGM, which was around
25% of total revenue, grew 8.5% sequentially and 30.4% from last
year. This seems to indicate a greater preference for purchasing
electronics rather than content in international locations.
Once the electronics business gains momentum and Amazon has
enough fulfillment centers set up, we expect further investment in
content. In the last quarter, the company launched the Japanese
Kindle Store amazon.co.jp, through which it will sell a collection
of over a million books, including 50,000 books in the Japanese
language.
At the same time, Cloud Player was launched in the U.K.,
Germany, France, Italy and Spain. Therefore, new product
categories, better selection within categories, competitive prices
and free shipping remain drivers.
The Other segment, while still small (not a significant
percentage of total revenue) includes Amazon Web Services (AWS).
Revenues from the segment followed similar patterns as the other
two, declining sequentially and increasing year over year.
Gross Margin
The gross margin shrunk 81 bps sequentially and expanded 180 bps
year over year to 25.3%. Sequential variations in gross margins are
usually largely mix-related, although pricing is growing into an
important factor given the increase in product categories all over
the world.
The fact that new product launches come hand in hand with extra
launch costs, is also a negative for the gross margin. Third party
sites are also doing well, which has a positive impact.
Gross profit dollars were up 4.2% sequentially and 36.7% from
last year, due to volume changes. The increase from last year is
very encouraging, indicating that despite its market position,
Amazon continues to grow without sacrificing margin. It also
indicates that Amazon brings a value proposition for customers that
make them stick with it.
Operating Metrics
Amazon’s operating expenses of $3.52 billion were up 8.5%
sequentially and 42.2% from the year-ago quarter. Amazon’s heavy
investing activities (headcount, fulfillment centers, content, etc)
over the past few quarters have been driving up its costs.
Specifically, fulfillment, marketing, technology and content,
and general and administrative expenses as a percentage of sales
were up 63 bps, 51 bps, 156 bps and 6 bps, respectively from a year
ago. Fulfillment and technology & content costs remain focus
areas, so were also up on a sequential basis.
As a result, the operating margin of -0.2% was down 104 bps and
93 bps, respectively from the previous and year-ago quarters. The
operating loss of $28 million was down significantly from profits
of $107 million and $79 million in the previous and year-ago
quarters, respectively.
The North America segment operating margin was down 100 bps
sequentially and up 126 bps from the year-ago quarter. The
International segment operating margin was down 129 bps
sequentially and 334 bps from the year-ago quarter (a lot of the
investment over the past year was in this segment).
EBITDA was $743 million, down 8.6% sequentially and up 48.3%
from last year. The cash margin of 5.4% was down from 6.3% in the
previous quarter and up from 4.6% in the year-ago quarter.
Net Income
Amazon generated third quarter net loss of $105 million, or a
-0.8% net income margin, compared to profit of $7 million, or 0.1%
in the previous quarter and of $63 million, or 0.6% net income
margin in the same quarter last year. There were no one-time items
in the last quarter. Therefore, the GAAP EPS was same as the pro
forma EPS of -$0.23 compared to 2 cents and 14 cents in the
previous and year-ago quarters, respectively.
Balance Sheet and Cash Flow
Amazon ended with a cash and investments balance of $5.25
billion, up $278 million during the quarter. The company generated
$943 million of cash from operations, spending $716 million on
fixed assets (including internal-use software and website
development costs), $37 million on acquisitions net of cash
acquired and $144 million to pay down debt and long term
obligations. There were no share repurchases in the last
quarter.
Amazon saw inventories increase 15.6% sequentially, with turns
declining from 8.7X to 8.1X. Receivables increased in the quarter,
with DSOs increasing to nearly 16 days.
Guidance
Management provided guidance for the fourth quarter of 2012.
Accordingly, revenue is expected to come in at around $20.25-22.75
billion (up 55.7% sequentially, or up 23.3% year over year at the
mid-point), below consensus expectations of $22.79 billion.
Operating income/loss (including $290 million for stock based
compensation and amortization of intangible assets) is expected to
come in at approximately -$490 to $310 million.
Our Take
There was nothing new in Amazon’s third quarter, so our thesis
remains unchanged.
We continue to believe in Amazon’s prospects, especially its
platform approach (Kindle, Prime and the still small but growing
AWS). We think that Amazon is performing true to form, continuing
to grow revenue and generate very strong cash flow quarter upon
quarter (discounting seasonal variations).
As such Amazon remains one of the leading players in the
fast-growing ecommerce market. The increase in users, units and
partners overall indicates that it is outgrowing the ecommerce
market. We think that this has been possible in the past because of
the broad selection, free shipping and user experience that Amazon
has consistently provided. This has enabled the company to gain
from the shift in offline to online consumption.
The Kindle platform will remain a major growth platform for
Amazon. Despite the Mini from Apple, we think Amazon devices come
with their own value proposition, so there will be many takers.
Amazon has the huge task of maintaining its U.S. market share
and expanding globally. We expect share losses, but think that the
market will expand fast enough for Amazon to maintain a solid
growth rate. However, this is dependent on its own capacity to
serve customers, especially in international markets, where growth
rates are likely to be higher and its own facilities fewer.
As a result, both fulfillment and technology & content
investments will likely continue to grow. We do not consider this
negative, since differentiation among online retailers is very
difficult and better experience and support are the things that can
drive traffic.
While the increase in operating expenses is hurting the bottom
line, we believe this is necessary. We expect the operating
leverage to translate into accelerated growth in future quarters.
However, the uncertainty regarding the timeline remains, which is
the reason we remain Neutral on the shares.
Amazon shares currently carry a Zacks Rank of #3, which
translates to a Hold recommendation in the short term (1-3
months).
ADV MICRO DEV (AMD): Free Stock Analysis Report
AMAZON.COM INC (AMZN): Free Stock Analysis Report
CORNING INC (GLW): Free Stock Analysis Report
INTEL CORP (INTC): Free Stock Analysis Report
MICROSOFT CORP (MSFT): Free Stock Analysis Report
NETFLIX INC (NFLX): Free Stock Analysis Report
SONY CORP ADR (SNE): Free Stock Analysis Report
TEXAS INSTRS (TXN): Free Stock Analysis Report
YAHOO! INC (YHOO): Free Stock Analysis Report
To read this article on Zacks.com click here.
Zacks Investment Research
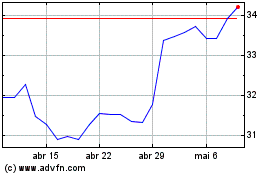
Corning (NYSE:GLW)
Gráfico Histórico do Ativo
De Jun 2024 até Jul 2024

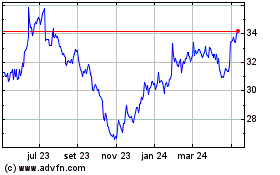
Corning (NYSE:GLW)
Gráfico Histórico do Ativo
De Jul 2023 até Jul 2024
