UNITED STATES
SECURITIES AND EXCHANGE
COMMISSION
Washington, D.C. 20549
FORM 6-K
Report of Foreign Private
Issuer
Pursuant to Rule 13a-16 or 15d-16 of the
Securities Exchange Act of
1934
For the month of February
2024
Commission File Number
1-14732
COMPANHIA SIDERÚRGICA
NACIONAL
(Exact name of registrant
as specified in its charter)
National Steel Company
(Translation of registrant’s
name into English)
Av. Brigadeiro Faria Lima
3400, 20th Floor
São Paulo, SP, Brazil
04538-132
(Address of principal executive
office)
Indicate by check mark whether
the registrant files or will file annual reports
under cover Form 20-F or Form 40-F.
Form 20-F ___X___ Form 40-F
_______
Indicate by
check mark whether the registrant by furnishing the information contained in this Form is also thereby furnishing the information to the
Commission pursuant to Rule 12g3-2(b) under the Securities Exchange Act of 1934.
Yes _______ No ___X____

CERTAIN UPDATES TO 2022 ANNUAL REPORT
This report on Form 6-K presents certain updates to Companhia Siderúrgica
Nacional’s (“CSN,” “we,” “us” or “our”) Annual Report
on Form 20-F for its fiscal year ended December 31, 2022 (“2022 Annual Report”), as filed with the U.S. Securities
and Exchange Commission on April 27, 2023.
Exhibit A: Certain Recent Developments
and Updates to 2022 Annual Report.
São Paulo, February
8, 2024
COMPANHIA SIDERÚRGICA
NACIONAL
Marcelo Cunha Ribeiro
Chief Financial and Investor
Relations Officer
Exhibit A
RECENT DEVELOPMENTS
The
following discussion of our financial condition, results of operations and certain legal developments should be read in conjunction with
our unaudited interim consolidated financial information, the information presented under the sections entitled “Presentation of
Financial and Other Data” and “Item 3. Key Information—Selected Financial Data,” “Item 5. Operating and
Financial Review and Prospects” and “Item 11. Quantitative and Qualitative Disclosures About Market Risk” in our 2022
Annual Report, which includes our audited consolidated financial statements.
Consolidated Results
of Operations
The following table presents certain financial
information with respect to our results of operations for the nine months ended September 30, 2022 and 2023:
| |
Nine months ended
September 30, |
| |
2022 |
2023 |
2023(1) |
| |
(in millions of R$, except per share data) |
(in millions of US$, except per share data) |
| Net operating revenues |
33,232.8 |
33,432.8 |
6,676.4 |
| Cost of products sold |
(23,206.7) |
(25,138.9) |
(5,020.1) |
| Gross profit |
10,026.2 |
8,294.0 |
1,656.3 |
| Operating expenses |
|
|
|
| Selling |
(1,595.9) |
(2,725.1) |
(544.2) |
| General and administrative |
(440.7) |
(552.2) |
(110.3) |
| Equity in results of affiliated companies |
167.0 |
259.6 |
51.8 |
| Other expenses |
(1,926.0) |
(2,049.9) |
(409.4) |
| Other income |
222.9 |
142.7 |
28.5 |
| Total |
(3,572.6) |
(4,925.0) |
(983.5) |
| Operating income |
6,453.5 |
3,369.0 |
672.8 |
| Financial income (expenses), net |
|
|
|
| Financial income |
(259.2) |
799.3 |
159.6 |
| Financial expenses |
(2,074.5) |
(4,398.3) |
(878.3) |
| Income (loss) before taxes |
4,119.8 |
(230.0) |
(45.9) |
| Income tax |
(2,148.9) |
(218.4) |
(43.6) |
| Net income (loss) for the period |
1,970.9 |
(448.5) |
(89.6) |
| |
Nine months ended
September 30, |
| |
2022 |
2023 |
2023(1) |
| |
(in millions of R$, except per share data) |
(in millions of US$, except per share data) |
| Net income (loss) attributable to noncontrolling interest |
433.8 |
448.8 |
89.6 |
| Net income (loss) attributable to Companhia Siderúrgica Nacional shareholders |
1,537.1 |
(897.3) |
(179.2) |
| (1) | Translated solely for the convenience of the reader at the rate of R$5.0076 to US$1.00, which was the U.S. dollar selling rate as
reported by the Central Bank as of September 30, 2023. As of February 7, 2024, the U.S. dollar selling rate as reported by the Central
Bank was R$4.9608 to US$1.00. |
Nine Months Ended September 30, 2022 Compared
to Nine Months Ended September 30, 2023
We maintain integrated operations in five business
segments: steel, mining, logistics, cement and energy. We manage and control the performance of our various business segments considering
our proportional interest in our jointly controlled entity, MRS, reflected in the figures presented below.
Our consolidated results for the nine months ended
September 30, 2022 and 2023 by business segment are presented below:
| |
Nine
months ended September 30, 2022 |
| |
Steel |
Mining |
Port |
Railway(1) |
Energy |
Cement |
Eliminations |
Consolidated |
| |
(in millions of R$) |
| Net operating revenues |
|
|
|
|
|
|
|
|
| Domestic market |
16,087.4 |
1,364.1 |
221.8 |
1,703.8 |
139.3 |
1,638.5 |
(3,114.1) |
18,040.8 |
| Export market |
7,199.1 |
7,631.9 |
- |
- |
- |
- |
361.1 |
15,192.1 |
| Total net operating revenues |
23,286.5 |
8,996.0 |
221.8 |
1,703.8 |
139.3 |
1,638.5 |
(2,753.0) |
33,232.9 |
| Cost of products sold |
(18,042.0) |
(5,227.0) |
(162.5) |
(1,124.9) |
(148.8) |
(1,074.0) |
2,572.6 |
(23,206.7) |
| Gross profit |
5,244.5 |
3,768.9 |
59.3 |
579.0 |
(9.5) |
564.5 |
(180.5) |
10,026.2 |
| Selling, general and administrative expenses |
(973.8) |
(212.9) |
(24.0) |
(101.7) |
(26.5) |
(237.8) |
(459.8) |
(2,036.6) |
| Depreciation |
909.3 |
736.6 |
25.0 |
356.7 |
11.9 |
192.3 |
(264.5) |
1,967.4 |
| Proportionate EBITDA of joint ventures |
- |
- |
- |
- |
- |
- |
736.8 |
736.8 |
| Adjusted EBITDA(2) |
5,180.0 |
4.292,6 |
60,3 |
834,0 |
(24,1) |
519,0 |
(168,1) |
10,693.7 |
| |
Nine
months ended September 30, 2023 |
| |
Steel |
Mining |
Port |
Railway(1) |
Energy |
Cement |
Eliminations |
Consolidated |
| |
(in millions of R$) |
| Net operating revenues |
|
|
|
|
|
|
|
|
| Domestic market |
12,443.9 |
1,221.1 |
198.7 |
1,917.2 |
420.4 |
3,420.9 |
(3,028.3) |
16,593.9 |
| Export market |
4,619.4 |
10,886.9 |
- |
- |
- |
- |
1,332.6 |
16,839.0 |
| Total net operating revenues |
17,063.3 |
12,108.0 |
198.7 |
1,917.2 |
420.4 |
3,420.9 |
(1,695.7) |
33,432.9 |
| Cost of products sold |
(15,649.2) |
(7,439.8) |
(185.8) |
(1,059.2) |
(328.8) |
(2,826.5) |
2,350.5 |
(25,138.9) |
| Gross profit |
1,414.1 |
4,668.2 |
12.9 |
858.0 |
91.6 |
594.3 |
654.8 |
8,294.0 |
| Selling, general and administrative expenses |
(899.3) |
(344.8) |
(7.8) |
(150.9) |
(43.7) |
(363.9) |
(1,466.9) |
(3,277.4) |
| |
Nine
months ended September 30, 2023 |
| |
Steel |
Mining |
Port |
Railway(1) |
Energy |
Cement |
Eliminations |
Consolidated |
| |
(in millions of R$) |
| Depreciation |
974.6 |
780.5 |
35.2 |
295.6 |
74.0 |
481.8 |
(229.8) |
2,411.8 |
| Proportionate EBITDA of joint ventures |
- |
- |
- |
- |
- |
- |
853.1 |
853.1 |
| Adjusted EBITDA(2) |
1,489.4 |
5,103.9 |
40.2 |
1,002.8 |
121.9 |
712.2 |
(188.8) |
8,281.5 |
_________________
| (1) | Railway logistics in our segment break-down includes our investee MRS, which is not consolidated in our
unaudited interim consolidated financial information or our audited consolidated financial statements and is reflected only in equity
in results of affiliated companies. |
| (2) | We calculate EBITDA as net income (loss) for the period plus net financial income (expenses),
income tax and social contribution, depreciation and amortization and results from discontinued operations. We calculate adjusted EBITDA
as net income (loss) for the period plus net financial income (expenses), income tax and social contribution, depreciation and
amortization and results of discontinued operations, plus other operating income (expenses), equity in results of affiliated companies
and the proportionate EBITDA of joint ventures. EBITDA and adjusted EBITDA are not measures of financial performance recognized under
Brazilian GAAP or IFRS and they should not be considered alternatives to net income (loss) as measures of operating performance, or as
alternatives to operating cash flows, or as measures of liquidity. EBITDA and adjusted EBITDA are not calculated using a standard methodology
and may not be comparable to the definition of EBITDA or adjusted EBITDA, or similarly titled measures, used by other companies. |
Net Operating Revenues
Net operating revenues increased R$200.0 million,
or 0.6%, from R$33,232.9 million in the nine months ended September 30, 2022 to R$33,432.8 million in the nine months ended September
30, 2023, due to higher prices and an increase in sales volume, mainly in our mining segment.
Net domestic
operating revenues decreased R$1,446.9 million, or 8.0%, from R$18,040.8 million in the nine months ended September 30, 2022 to R$16,593.9
million in the nine months ended September 30, 2023, due to the decrease in sales volume and prices in the steel segment.
Net revenues of exports and sales abroad increased
R$1,646.9 million, or 10.8%, from R$15,192.1 million in the nine months ended September 30, 2022 to R$16,839.0 million in the nine months
ended September 30, 2023, due mainly to higher iron ore prices and an increase in sales volume in our mining segment.
Steel
Steel net operating revenues decreased R$6,223.2
million, or 26.7%, from R$23,286.5 million in the nine months ended September 30, 2022 to
R$17,063.3 million in the nine months ended September 30, 2023. Sales volume decreased 8%, from 3,383.4 million tons in the nine
months ended September 30, 2022 to 3,101.4 million tons in the nine months ended September 30, 2023. Steel net domestic operating
revenues decreased R$3,643.5, or 22.6%, from R$16,087.4 million in the nine months ended September 30, 2022 to R$12,443.9 million in the
nine months ended September 30, 2023. Steel net revenues of exports and sales abroad decreased R$2,579.7 million, or 35.8%, from R$7,199.1
million in the nine months ended September 30, 2022 to R$4,619.4 million in the nine months September 30, 2023, due to lower steel prices
and sales volume.
Mining
Mining net operating revenues increased R$3,112,0
million, or 34.6%, from R$8,996.0 million in the nine months ended September 30, 2022 to R$12,108.0 million in the nine months ended September
30, 2023, due to an increase of 34% in sales volume, from 23,600.2 million tons in the nine months ended September 30, 2022 to 31,517.1
million tons in the nine months ended September 30, 2023. In the nine months ended September 30, 2023, our iron ore production was 21,136.0
million tons, which represented a 15% increase over the same period in 2022, mainly due to heavy rain in the first quarter of 2022 and
certain extraordinary maintenance measures, each of which affected our operations.
Logistics
In the nine months ended September 30, 2022, net
operating revenues from railway logistics were R$1,703.8 million and net operating revenues from port logistics were R$221.8 million,
while in the nine months ended September 30, 2023, net operating revenues from railway logistics were R$1,917.2 million and net operating
revenues from port logistics were R$198.7 million. In the nine months
ended September 30, 2023, port logistics handled 815,000 tons of steel products, 30,000 tons of general cargo, 45,000 containers and 493,000
tons of bulk.
Energy
Our net operating revenues from the energy segment
increased R$281.1 million, or 201.8%, from R$139.3 million in the nine months ended September 30, 2022 to R$420.4 million in the nine
months ended September 30, 2023, mainly due to the consolidation of CEEE's
operations in 2023.
Cement
Our net operating revenues from the cement segment
increased R$1,782.4 million, or 108.8%, from R$1,638.5 million in the nine months ended September 30, 2022 to R$3,420.9 million in the
nine months ended September 30, 2023, mainly due to a 122% increase in sales volume. A portion of this increase in sales volume was due
to our consolidation of LafargeHolcim (Brasil)’s operations starting in September 2022.
Cost
of Products Sold
Cost of products sold increased R$1,932.2 million,
or 8.3%, from R$23,206.7 million in the nine months ended September 30, 2022 to R$25,138.9 million in the nine months ended September
30, 2023, mainly due to an increase in the prices of certain raw materials in all of our segments.
Steel
Steel costs
of products sold decreased R$2,392.8 million, or 13.3%, from R$18,042.0 million in the nine months ended September 30, 2022 to R$15,649,2
million in the nine months ended September 30, 2023, mainly due to a decrease in the prices of certain raw materials, mainly coal and
coke, which effects were partially offset by a decrease in iron ore prices.
The following table sets forth a breakdown of
our steel production costs in the periods presented. Except for coal and coke, which we import, and certain metals (such as aluminum,
zinc and tin) with domestic prices linked to international prices, our production costs are mostly denominated in reais.
| |
Nine months ended
September 30, |
Change |
| |
2022 |
2023 |
|
Steel Production Cost
(Parent Company) |
(R$ millions) |
(R$/ ton) |
(R$ millions) |
(R$/ ton) |
(R$ million) |
(R$/ ton) |
| Raw materials |
10,252.4 |
3,690.4 |
7,227.2 |
3,052.0 |
(3,025) |
(638,377) |
| Iron ore |
1,205.9 |
434.1 |
846.3 |
357.0 |
(360) |
(77) |
| Coal |
1,949.9 |
701.9 |
1,293.6 |
546.0 |
(656) |
(156) |
| Coke |
3,396.8 |
1,222.7 |
1,923.6 |
812.0 |
(1,473) |
(410) |
| Metals |
771.0 |
277.5 |
549.7 |
232.0 |
(221) |
(45) |
| Outsourced slabs |
327.5 |
117.9 |
935.8 |
395.0 |
608 |
277 |
| Pellets |
1,688.2 |
607.7 |
1,154.3 |
487.0 |
(534) |
(120) |
| Scrap |
172.5 |
62.1 |
48.1 |
20.0 |
(124) |
(42) |
| Other(1) |
740.6 |
266.6 |
475.9 |
201.0 |
(265) |
(66) |
| Labor |
721.9 |
259.7 |
807.8 |
341.1 |
86 |
81.3 |
| Other production costs |
3,467.2 |
1,248.0 |
3,755.5 |
1,585.9 |
288 |
337.9 |
| Energy/fuel |
1,310.2 |
471.6 |
1,233.8 |
521.0 |
(76) |
49 |
| |
Nine months ended
September 30, |
Change |
| |
2022 |
2023 |
|
Steel Production Cost
(Parent Company) |
(R$ millions) |
(R$/ ton) |
(R$ millions) |
(R$/ ton) |
(R$ million) |
(R$/ ton) |
| Services and maintenance |
691.0 |
248.7 |
819.6 |
346.0 |
129 |
97 |
| Tools and supplies |
458.2 |
164.9 |
502.2 |
212.0 |
44 |
47 |
| Depreciation |
717.7 |
258.3 |
792.8 |
335.0 |
75 |
76 |
| Other |
290.1 |
104.4 |
407.1 |
172.0 |
117 |
67 |
| Total |
14,441.5 |
5,198.3 |
11,790.4 |
4,979.1 |
(2,651) |
(219.2) |
Mining
Our mining
costs of products sold increased R$2,212.8 million, or 42.3%, from R$5,227.0 million in the nine months ended September 30, 2022 to R$7,439.8
million in the nine months ended September 30, 2023, mainly due to an increase of 7,917 tons in sales volume, an increase in costs related
to the impact of taxes on our net revenue (Financial Compensation for Mineral Exploration CEFEM) and the increase in the price of certain
raw materials and port rent.
Logistics
Cost of
services attributable to our logistics segment decreased R$42.4 million, or 3.3%, from R$1,287.4 million in the nine months ended September
30, 2022 to R$1,245.0 million in the nine months ended September 30, 2023, mainly due to adjustments in fuel prices.
Energy
Cost of products sold attributable to our energy
segment increased R$180.0 million in line with the revenue of the segment, representing 121.0%, from R$148.8 million in the nine months
ended September 30, 2022 to R$328.8 million in the nine months ended September 30, 2023, due the update of the energy contracts and the
acquisition of CEEE-G in fourth quarter of 2022.
Cement
Cost of
products sold attributable to our cement segment increased R$1,752.5 million, or 163.2%, from R$1,074.0 million in the nine months ended
September 30, 2022 to R$2,826.5 million in the nine months ended September 30, 2023, mainly due to an increase in raw material costs and
a 122% increase in sales volume as a result of the acquisition of LafargeHolcim.
Gross
Profit
Gross profit decreased R$1,732.2 million, or 17.3%,
from R$10,026.2 million in the nine months ended September 30, 2022 to R$8,294.0 million in the nine months ended September 30, 2023,
due to an increase in our cost of products sold, as discussed above.
Selling,
General and Administrative Expenses
Selling, general and administrative expenses increased
R$1,240.7 million, or 60.9%, from R$2,036.6 million in the nine months ended September 30, 2022 to R$3,277.3 million in the nine months
ended September 30, 2023. Selling expenses increased R$1,129.2 million, or 70.8%, from R$1,595.9 million in the nine months ended September
30, 2022 to R$2,725.1 million in the nine months ended September 30, 2023, mainly due to an increase in volume sold pursuant to cost,
insurance and freight – CIF agreements, which effects were partially offset by a decrease in average freight rates and in 2023 a
port service contract was signed with a third party, which increased selling expenses by R$136.0 million. General and administrative expenses
increased R$111.5 million, or 25.3%, from R$440.7 million in the nine months ended September 30, 2022, to R$552.2 million in the nine
months ended September 30, 2023.
Other
Operating Income (Expenses)
Other operating income (expenses), net increased
from an expense of R$1,703.1 million in the nine months ended September 30, 2022 to R$1,907.2 million in the nine months ended September
30, 2023.
Other operating income decreased R$80.2 million,
or 36.0%, from R$222.9 million in the nine months ended September 30, 2022 to R$142.7 million in the nine months ended September 30, 2023,
mainly due to the gain on the sale of Consortium Machadinho in the aggregate amount of R$114.7 million for CEEE-G.
Other operating expenses increased R$123.9 million,
or 6.4%, from R$1,926.0 million in the nine months ended September 30, 2022 to R$2,049.9 million in the nine months ended September 30,
2023, mainly due to R$174.3 million in idle capacity in our steel segment, R$295.5 million reversal in demurrage of our steel segment,
R$109.6 million reversal in write-offs relating to certain legal proceedings and R$366.7 million in inventory losses.
Equity
in Results of Affiliated Companies
Equity in results of affiliated companies increased
R$92.6 million, or 55.4%, from a gain of R$167.0 million in the nine months ended September 30, 2022 to a gain of R$259.6 million in the
nine months ended September 30, 2023, mainly due to an increase in the net income of our investee MRS.
Operating Income
Operating income decreased R$3,084.5 million,
or 47.8%, from R$6,453.5 million in the nine months ended September 30, 2022 to R$3,369.0 million in the nine months ended September 30,
2023, mainly due to the increase in cost of products sold and in selling expenses as discussed above.
Financial Income (Expenses), Net
Net financial
expenses increased R$1,265.3 million, or 54.2%, from R$2,333.7 million in the nine months ended September 30, 2022 to R$3,599.0 million
in the nine months ended September 30, 2023, mainly due to (i) an increase of R$1,280.1 million in foreign exchange results, (ii)
R$860.5 million in interest expense on borrowings, financing and debentures, and (iii) R$66.9 million in interest expenses on drawn/forfaiting
risk operations, which effects were partially offset by (iv) R$1,015.2 million in profit on our shares in Usiminas.
Income
Taxes
Income tax expense in Brazil refers to federal
income tax (imposto de renda da pessoa jurídica – IRPJ) and social contribution (contribuição social sobre
o lucro – CSLL). The statutory rates for these taxes applicable to the periods presented were 25% for federal income tax and
9% for social contribution. Adjustments are made to income in order to reach the effective tax expense or benefit for each fiscal year.
As a result, our effective tax rate is volatile among fiscal periods.
At statutory rates, we had an income tax and social
contribution expense of R$1,400.7 million in the nine months ended September 30, 2022 and income tax and social contribution benefit of
R$78.2 million in the nine months ended September 30, 2023, which represents, in each period, 34% of our income before taxes. After adjustments
to meet the effective income tax rates, we recorded an expense for income tax and social contribution of R$2,148.9 million in the nine
months ended September 30, 2022 and R$218.4 million in the nine months ended September 30, 2023. Expressed as a percentage of pretax income,
our effective income tax rate was 52.2% in the nine months ended September 30, 2022 and 95.0% in the nine months ended September 30, 2023.
In the nine months ended September 30, 2023, in order to meet the effective income tax rate, we had a negative net adjustment of R$296.7
million, mainly due to a negative impact of R$344.7 million in tax credit reversal and R$127.4 million in tax on the results of subsidiaries
at different rates or not taxed.
It is not possible to predict future adjustments
to federal income tax and social contribution statutory rates, as they depend on interest on shareholders’ equity, tax incentives
and non-taxable factors, including income from offshore operations and tax losses from offshore operations.
Net
Income (Loss) for the Period
In the nine months ended September 30, 2023, we
recorded net loss of R$448.5 million, as compared to net income of R$1,970.9 million in the nine months ended September 30, 2022. The
decrease of R$2,419.4 million was due to the reasons discussed above.
Liquidity and Capital Resources
Cash Flows
Cash and cash equivalents increased by R$3,311.3
million in the nine months ended September 30, 2023, as compared to a decrease of R$2,327.1 million in cash and cash equivalents in the
nine months ended September 30, 2022.
Operating Activities
Cash provided by operating activities increased
R$3,507.0 million, or 164.5%, from R$2,131.5 million in the nine months ended September 30, 2022 to R$5,638.5 million in the nine months
ended September 30, 2023, mainly due to the R$2,419.4 million decrease in our net income, adjusted by R$515.0 million decrease in certain
reconciling items that do not represent cash receipts or disbursements, such as the negative change of R$1,016.6 million in the fair value
of our Usiminas shares, reflected in our net income that did not affect our cash provided by operating activities, as well as depreciation
and amortization expenses, deferred income taxes, foreign exchange variations and minor other changes that, in the aggregate, amount to
R$1,531.7 million.
Additionally, we had net changes in certain
operating assets and liabilities, including an increase of R$865.8 million in trade receivables, a decrease of R$508.1 million in taxes
recoverable, a decrease of R$2,163.4 million in taxes payable, an increase of R$745.2 million in interest payments and an increase of
R$2,611.4 million in suppliers, which effects were partially offset by an increase of R$1,528.0 million in inventories, an decrease of
R$5,111.8 million in advance of customers, a decrease of R$758.5 million as settlement of our Platts iron ore index hedge.
Investing Activities
Cash used in investing activities decreased
R$4,748.1 million, or 62.7%, from R$7,569.0 million in the nine months ended September 30, 2022 to R$2,820.9 million in the nine months
ended September 30, 2023, mainly due to payments of R$4,770.3 million to acquire LafargeHolcim (Brasil) in 2022, R$466.1 million to make
additional acquisitions and R$488.5 million to acquire certain property, plant and equipment and cash received in the merger of LafargeHolcim
in the amount of R$496.4 million and in the acquisition of other companies in the amount of R$6.5 million.
Financing Activities
Cash provided by financing activities decreased
R$2,620.5 million, or 85.1%, from R$3,079.1 million in the nine months ended September 30, 2022 to R$458.6 million in the nine months
ended September 30, 2023, mainly due to: (i) a decrease of R$1,753.3 million in debt amortization payments in the nine months ended
September 30, 2023, as compared to the same period in 2022, and (ii) an increase of R$3,330.3 million in borrowings, financing and debentures.
These effects were partially offset by an increase of R$1,454.0 million in dividends and interest on shareholders’ equity in the
nine months ended September 30, 2023, as compared to the same period in 2022.
Trade Accounts Receivable Turnover Ratio
Our trade accounts receivable turnover ratio,
which is the ratio between our trade accounts receivable and our net operating revenues, measured in days of sales, was 30 days, 17 days,
23 days and 22 days as of December 31, 2020, 2021 and 2022 and as of September 30, 2023, respectively.
Inventory Turnover Ratio
Our inventory turnover ratio, which we measure
by dividing our inventories by our annualized cost of products sold, measured in days of cost of products sold, was 75 days, 143 days,
119 days and 85 days as of December 31, 2020, 2021 and 2022 and as of September 30, 2023, respectively.
Trade Accounts Payable Turnover Ratio
Our trade accounts payable turnover ratio, which
we measure by dividing our trade accounts payable by our cost of products sold, measured in days of cost of products sold, was 112 days,
149 days, 143 days and 119 days as of December 31, 2020, 2021 and 2022 and as of September 30, 2023, respectively. This extension in payment
terms reflects our renegotiation of commercial terms with our suppliers and contractors.
Liquidity Management
Given the capital intensive and cyclical nature
of our industry and the generally volatile Brazilian macroeconomic environment, we retain cash on hand to run our operations and to meet
our short-term financial obligations. As of September 30, 2023, cash and cash equivalents were R$15,302.6 million, as compared to R$11,991
million as of December 31, 2022, R$16,646.5 million as of December 31, 2021 and R$9,944.6 million as of December 31, 2020.
As of September 30, 2023, our short-term and long-term
indebtedness accounted for 13.9% and 86.1%, respectively, of our total debt, and the average life of our existing debt was equivalent
to approximately 54 months.
Capital Expenditures and Investments
In the nine months ended September 30, 2023,
we had capital expenditures and investments of R$2,925.9 million, comprising:
R$1,284.9 million in our steel segment:
productivity and modernization projects to improve performance, including major overhauls of coke batteries, automation and efficiency
improvements, maintenance and spare parts across all of our steel facilities.
R$1,033.5 million in our mining segment:
mining expansion projects, investments in tailings filtering and expansion of the Itaguaí port.
R$421.5 million in our cement segment:
sustaining projects in our Volta Redonda, Arcos, Alhandra, Pedro Leopoldo and Barroso units.
R$185.9 million in our logistics and
energy segments.
Debt and Derivative Instruments
As of September 30, 2023 and December 31, 2022,
our total debt (comprising current and non-current portions of borrowings, financing and debentures) was R$43,574.2 million and R$40,919
million (net of transaction costs), respectively, which represents 216.8% and 187.6% of shareholders’ equity as of September 30,
2023 and December 31, 2022, respectively. As of September 30, 2023, our short-term debt (comprising current borrowings, financing
and debentures, which includes the current portion of long-term debt) was R$6,051.0 million and our long-term debt (comprising non-current
borrowings, financing and debentures) was R$37,523.2 million.
As of September 30, 2023, approximately 40.0%
of our debt was denominated in reais and substantially all of the remaining balance was denominated in U.S. dollars. Our policy
is to protect ourselves against foreign exchange losses and interest rate losses on our debt, which we do through hedge accounting.
The following table sets forth our borrowings,
financing and debentures, which we record at amortized cost as of September 30, 2023:
| |
As of September
30, 2023 |
| |
Current liabilities |
Non-current liabilities |
| |
(in millions of R$) |
| Debt Agreements in the International Market |
|
|
| Variable interest: |
|
|
| US$ |
|
|
| Prepayment |
587.6 |
6,916.7 |
| Fixed interest: |
|
|
| US$ |
|
|
| Bonds, Perpetual Bonds, Facility, CCE and ACC |
2,672.4 |
16,102.3 |
| EUR |
|
|
| Others |
378.1 |
126.1 |
| |
3,638.1 |
23,145.2 |
| |
|
|
| Debt Agreements in Brazil |
|
|
| Variable interest: |
|
|
| R$ |
|
|
| BNDES/FINAME, Debentures, NCE and CCB |
2,502.5 |
14,910.2 |
| Total borrowings, financing and debentures |
6,140.6 |
38,055.4 |
| Transaction costs and issue premiums |
(89.6) |
(532.2) |
| Total borrowings, financing and debentures, net of transaction costs |
6,051.0 |
37,523.2 |
The following table sets forth the average interest
rate of our borrowings, financing and debentures as of September 30, 2023:
| |
|
As of September
30, 2023 |
| |
Average interest
rate(1) |
Total Debt |
| |
|
(in millions of R$) |
| US$ |
6.81% |
26,279.1 |
| EUR |
5.49% |
504.2 |
| R$ |
14.32% |
17,412.7 |
| |
|
44,196.0 |
_________________
| (1) | In order to determine the average interest rates for our borrowings and financing agreements with floating rates, we used rates as
of September 30, 2023. |
Debt Maturity Schedule
In September 2023, CSN Mineração
entered into a loan agreement, in an aggregate principal amount of US$1.4 billion, secured by the Japanese export credit agency –
NEXI and the Japanese Development Bank – JBIC, with a two-year grace period, plus a 10-year maturity schedule. The proceeds
of the loan agreement are used to support the construction of a new pellet feed plant in the Casa de Pedra mine.
In July 2023, we issued debentures, in an aggregate
principal amount of R$700.0 million. The debentures have three maturity tranches: seven years, ten years and 15 years due in 2038. The
net proceeds from this issuance have been used as part of investment projects in our logistics segment, specifically in Ferrovia Transnordestina
– FTL.
The following chart sets forth our debt maturity
profile as of September 30, 2023:
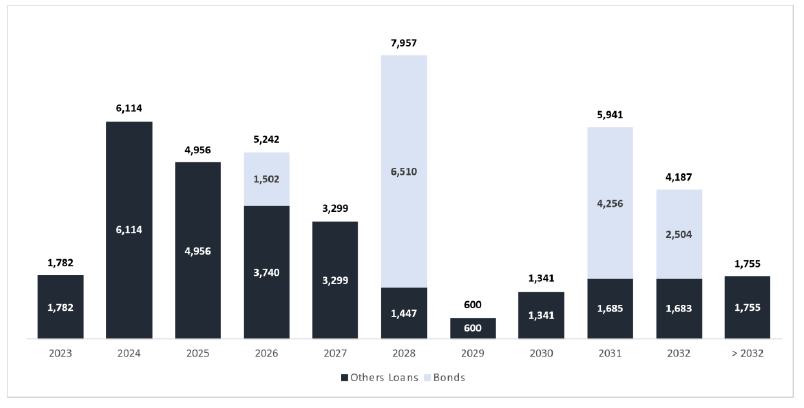
_________________
* Does not consider accrued interest, transaction costs or premiums
on issuance.
The following table sets forth the maturity profile
of our debt as of September 30, 2023, net of transaction costs and premiums on issuance:
|
Maturity |
Principal Amount |
| |
(in millions of R$) |
| 2023 |
2,727.8 |
| 2024 |
6,190.8 |
| 2025 |
4,955.6 |
| 2026 |
5,242.5 |
| 2027 |
3,298.7 |
| 2028 - 2031 |
15,838.1 |
| After 2031 |
5,942.5 |
| Total |
44,196.0 |
Certain Updates to Mining Disclosures
Following are certain updates to the mining disclosures
contained in our 2022 Annual Report.
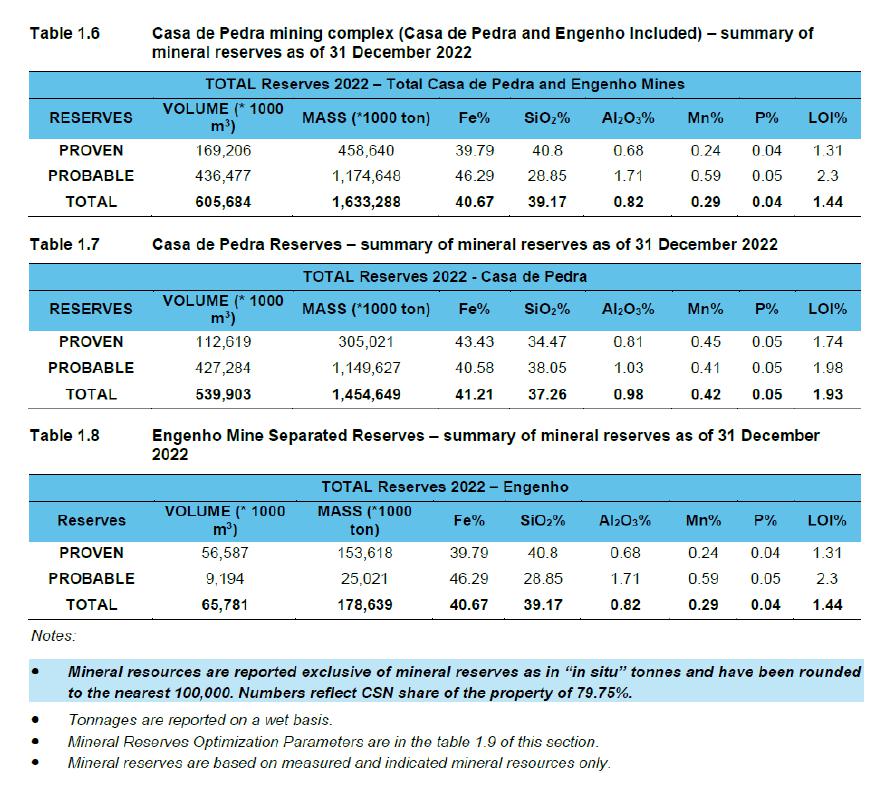
Mineral Resources and Reserves as of December 31, 2022
The following tables set forth the total mineral
resources and reserves that are attributable to our ownership interest (not consolidating CSN Mineração’s mineral
resources and reserves) as of December 31, 2022. The information in the following tables reflects ordinary course depletion as compared
to the mineral resources and reserves information as of December 31, 2021 set forth in our 2022 Annual Report.
The 2021 reserves and resources information for
our iron ore operations in our 2022 Annual Report was reported on 100% basis for CSN Mineração and was not
adjusted to reflect our 79.75% participation in CSN Mineração. In addition, the resources information presented in our 2022
Annual Report was not presented exclusive of reserves on a consistent basis, and therefore may not be comparable with the information
reported herein.
Casa de Pedra – summary of iron exclusive
mineral resources as of December 31, 2022.

| Engenho Mineral Resource Table (As of December 31, 2022) |
| RESOURCES 2022 – CSN 79.75% participation |
| RESOURCE |
VOLUME (* 1000 m3) |
MASS (*1000 ton) |
Fe% |
SiO2% |
Al2O3% |
Mn% |
P% |
LOI% |
| MEASURED |
71.95 |
178.33 |
40.23 |
40.10 |
0.66 |
0.27 |
0.04 |
1.29 |
| INDICATED |
18.40 |
44.22 |
46.88 |
29.14 |
1.17 |
0.55 |
0.04 |
1.62 |
| INFERRED |
6.14 |
10.90 |
43.45 |
30.84 |
2.09 |
1.19 |
0.06 |
2.96 |
| TOTAL |
96.50 |
233.46 |
41.64 |
37.60 |
0.82 |
0.37 |
0.04 |
1.43 |
Production Information
The following tables set forth each individual
property’s production information:
Material Mining Properties
| Name of mining operation |
Location of the mining operation |
Beneficiation plant and other installations |
Aggregate production 2020 (*1000) |
Aggregate production 2021 (*1000) |
Aggregate production 2022 (*1000) |
| Casa de Pedra |
Congonhas, MG |
Mining facilities and Pires |
25,680 |
26,790 |
23,725 |
| Engenho |
Congonhas, MG |
Mining facilities and Pires |
2,200 |
5,566 |
7,024 |
Non-material Mining Properties
| Name of mining operation |
Location of the mining operation |
Beneficiation plant and other installations |
Aggregate production 2020 (tons.) |
Aggregate production 2021 (tons.) |
Aggregate production 2022 (tons.) |
| Bocaina |
Arcos, MG |
Bocaina Mine and Tin (ERSA) |
2,280,760 |
1,823,878 |
2,315,465 |
| Pitimbu |
Alhandra, PB |
Pitimbu Mine |
1,734,110 |
1,762,657 |
1,417,962 |
| Capoeira Grande |
Barroso, MG |
Capoeira Grande Mine |
294,002 |
281,095 |
329,795 |
| Mata do Ribeirão |
Barroso, MG |
Mata do Ribeirão Mine |
1,323,850 |
1,397,347 |
1,772,303 |
| Fazenda Campinho |
Pedro Leopoldo, MG |
Fazenda Campinho Mine |
1,168,741 |
1,518,200 |
1,238,936 |
| Boa Vista |
Montes Claros, MG |
Boa Vista Mine |
864,201 |
906,417 |
1,004,218 |
| Saudade |
Cantagalo, RJ |
Saudade Mine |
934,103 |
1,037,009 |
986,374 |
| Miramar |
Caaporã, PB |
Miramar Mine |
1,376,697 |
1,677,637 |
1,833,328 |
| Fernandinho |
Itabirito, MG |
Fernandinho Mine |
- |
- |
- |
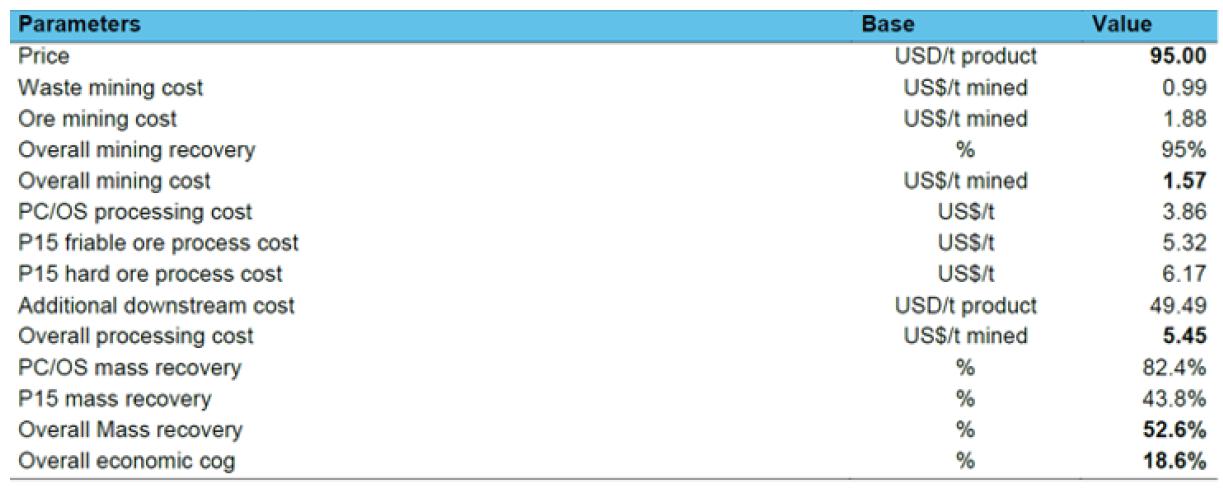
Optimization Parameters
The following table sets forth the reasonable
prospects for eventual economic extraction (RPEEE) pit optimization parameters that we considered in calculating our resources for Casa
de Pedra mining Complex (Casa de Pedra and Engenho):
The following table sets forth the reserves pit
optimization parameters that we considered in calculating our reserves for Casa de Pedra mining complex (Casa de Pedra and Engenho):
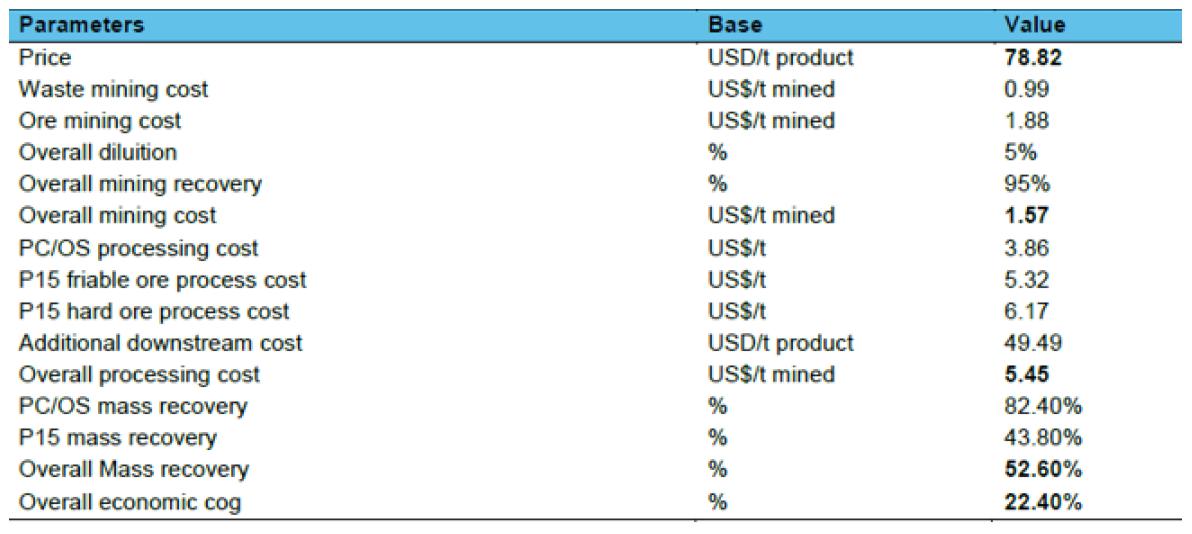
The economic cutoff grade to decide whether a
block should be mined or left in-situ was calculated by the NPVS Software of Datamine. We calculate the reserves economic cutoff at 22.40%.
SIGNATURES
Pursuant to the requirements
of the U.S. Securities Exchange Act of 1934, the registrant has duly caused this report to be signed on its behalf by the undersigned,
thereunto duly authorized.
| |
|
|
| February 8, 2024 |
Companhia Siderúrgica Nacional |
| |
By:
|
/s/ Benjamin Steinbruch
Benjamin Steinbruch |
| |
Title: |
Chief Executive Officer |
| |
| |
By:
|
/s/ Marcelo Cunha Ribeiro
Marcelo Cunha Ribeiro |
| |
Title: |
Chief Financial and Investor Relations Officer |
| |
|
|
Companhia Siderurgica Na... (NYSE:SID)
Gráfico Histórico do Ativo
De Mar 2024 até Abr 2024

Companhia Siderurgica Na... (NYSE:SID)
Gráfico Histórico do Ativo
De Abr 2023 até Abr 2024
