00010580902024FYfalse250350250350P1YP2Y301iso4217:USDxbrli:sharesiso4217:USDxbrli:sharescmg:restaurantcmg:regioncmg:segmentxbrli:pure00010580902024-01-012024-12-3100010580902024-06-3000010580902025-01-3100010580902024-12-3100010580902023-12-310001058090us-gaap:FoodAndBeverageMember2024-01-012024-12-310001058090us-gaap:FoodAndBeverageMember2023-01-012023-12-310001058090us-gaap:FoodAndBeverageMember2022-01-012022-12-310001058090cmg:DeliveryServiceMember2024-01-012024-12-310001058090cmg:DeliveryServiceMember2023-01-012023-12-310001058090cmg:DeliveryServiceMember2022-01-012022-12-3100010580902023-01-012023-12-3100010580902022-01-012022-12-310001058090us-gaap:CommonStockMember2021-12-310001058090us-gaap:AdditionalPaidInCapitalMember2021-12-310001058090us-gaap:TreasuryStockCommonMember2021-12-310001058090us-gaap:RetainedEarningsMember2021-12-310001058090us-gaap:AccumulatedOtherComprehensiveIncomeMember2021-12-3100010580902021-12-310001058090us-gaap:AdditionalPaidInCapitalMember2022-01-012022-12-310001058090us-gaap:CommonStockMember2022-01-012022-12-310001058090us-gaap:TreasuryStockCommonMember2022-01-012022-12-310001058090us-gaap:RetainedEarningsMember2022-01-012022-12-310001058090us-gaap:AccumulatedOtherComprehensiveIncomeMember2022-01-012022-12-310001058090us-gaap:CommonStockMember2022-12-310001058090us-gaap:AdditionalPaidInCapitalMember2022-12-310001058090us-gaap:TreasuryStockCommonMember2022-12-310001058090us-gaap:RetainedEarningsMember2022-12-310001058090us-gaap:AccumulatedOtherComprehensiveIncomeMember2022-12-3100010580902022-12-310001058090us-gaap:AdditionalPaidInCapitalMember2023-01-012023-12-310001058090us-gaap:CommonStockMember2023-01-012023-12-310001058090us-gaap:TreasuryStockCommonMember2023-01-012023-12-310001058090us-gaap:RetainedEarningsMember2023-01-012023-12-310001058090us-gaap:AccumulatedOtherComprehensiveIncomeMember2023-01-012023-12-310001058090us-gaap:CommonStockMember2023-12-310001058090us-gaap:AdditionalPaidInCapitalMember2023-12-310001058090us-gaap:TreasuryStockCommonMember2023-12-310001058090us-gaap:RetainedEarningsMember2023-12-310001058090us-gaap:AccumulatedOtherComprehensiveIncomeMember2023-12-310001058090us-gaap:AdditionalPaidInCapitalMember2024-01-012024-12-310001058090us-gaap:CommonStockMember2024-01-012024-12-310001058090us-gaap:TreasuryStockCommonMember2024-01-012024-12-310001058090us-gaap:RetainedEarningsMember2024-01-012024-12-310001058090us-gaap:AccumulatedOtherComprehensiveIncomeMember2024-01-012024-12-310001058090us-gaap:CommonStockMember2024-12-310001058090us-gaap:AdditionalPaidInCapitalMember2024-12-310001058090us-gaap:TreasuryStockCommonMember2024-12-310001058090us-gaap:RetainedEarningsMember2024-12-310001058090us-gaap:AccumulatedOtherComprehensiveIncomeMember2024-12-310001058090us-gaap:GeographicDistributionDomesticMembercmg:ChipotleMember2024-12-310001058090us-gaap:GeographicDistributionForeignMembercmg:ChipotleMember2024-12-310001058090us-gaap:GeographicDistributionForeignMembercmg:LicensedUnitsMember2024-12-3100010580902024-06-262024-06-260001058090srt:MinimumMembercmg:LeaseholdImprovementsAndBuildingsMember2024-12-310001058090srt:MaximumMembercmg:LeaseholdImprovementsAndBuildingsMember2024-12-310001058090srt:MinimumMemberus-gaap:FurnitureAndFixturesMember2024-12-310001058090srt:MaximumMemberus-gaap:FurnitureAndFixturesMember2024-12-310001058090srt:MinimumMemberus-gaap:EquipmentMember2024-12-310001058090srt:MaximumMemberus-gaap:EquipmentMember2024-12-310001058090srt:MinimumMember2024-12-310001058090srt:MaximumMember2024-12-310001058090srt:MinimumMember2024-01-012024-12-310001058090srt:MaximumMember2024-01-012024-12-310001058090us-gaap:StockAppreciationRightsSARSMember2024-01-012024-12-310001058090us-gaap:PerformanceSharesMember2024-01-012024-12-310001058090us-gaap:RestrictedStockUnitsRSUMemberus-gaap:ShareBasedCompensationAwardTrancheOneMember2024-01-012024-12-310001058090us-gaap:RestrictedStockUnitsRSUMemberus-gaap:ShareBasedCompensationAwardTrancheTwoMember2024-01-012024-12-310001058090us-gaap:StockAppreciationRightsSARSMemberus-gaap:ShareBasedCompensationAwardTrancheOneMember2024-01-012024-12-310001058090us-gaap:StockAppreciationRightsSARSMemberus-gaap:ShareBasedCompensationAwardTrancheTwoMember2024-01-012024-12-310001058090us-gaap:LandMember2024-12-310001058090us-gaap:LandMember2023-12-310001058090cmg:LeaseholdImprovementsAndBuildingsMember2024-12-310001058090cmg:LeaseholdImprovementsAndBuildingsMember2023-12-310001058090us-gaap:FurnitureAndFixturesMember2024-12-310001058090us-gaap:FurnitureAndFixturesMember2023-12-310001058090us-gaap:EquipmentMember2024-12-310001058090us-gaap:EquipmentMember2023-12-310001058090us-gaap:ConstructionInProgressMember2024-12-310001058090us-gaap:ConstructionInProgressMember2023-12-310001058090cmg:GiftCardMember2024-12-310001058090cmg:GiftCardMember2023-12-310001058090cmg:GiftCardMember2024-01-012024-12-310001058090cmg:GiftCardMember2023-01-012023-12-310001058090cmg:GiftCardMember2022-01-012022-12-310001058090cmg:ChipotleRewardsMember2023-12-310001058090cmg:ChipotleRewardsMember2022-12-310001058090cmg:ChipotleRewardsMember2021-12-310001058090cmg:ChipotleRewardsMember2024-01-012024-12-310001058090cmg:ChipotleRewardsMember2023-01-012023-12-310001058090cmg:ChipotleRewardsMember2022-01-012022-12-310001058090cmg:ChipotleRewardsMember2024-12-310001058090us-gaap:CashMember2024-12-310001058090us-gaap:MoneyMarketFundsMemberus-gaap:FairValueInputsLevel1Member2024-12-310001058090us-gaap:BankTimeDepositsMemberus-gaap:FairValueInputsLevel1Member2024-12-310001058090us-gaap:FairValueInputsLevel1Memberus-gaap:USTreasurySecuritiesMember2024-12-310001058090us-gaap:FairValueInputsLevel1Memberus-gaap:CorporateDebtSecuritiesMember2024-12-310001058090us-gaap:FairValueInputsLevel1Member2024-12-310001058090us-gaap:FairValueInputsLevel3Memberus-gaap:CorporateDebtSecuritiesMember2024-12-310001058090us-gaap:FairValueInputsLevel3Membercmg:NoteReceivableMember2024-12-310001058090us-gaap:FairValueInputsLevel3Member2024-12-310001058090us-gaap:CashMember2023-12-310001058090us-gaap:MoneyMarketFundsMemberus-gaap:FairValueInputsLevel1Member2023-12-310001058090us-gaap:BankTimeDepositsMemberus-gaap:FairValueInputsLevel1Member2023-12-310001058090us-gaap:FairValueInputsLevel1Memberus-gaap:USTreasurySecuritiesMember2023-12-310001058090us-gaap:FairValueInputsLevel1Memberus-gaap:CorporateDebtSecuritiesMember2023-12-310001058090us-gaap:FairValueInputsLevel1Member2023-12-310001058090us-gaap:FairValueInputsLevel3Memberus-gaap:CorporateDebtSecuritiesMember2023-12-310001058090us-gaap:FairValueInputsLevel3Membercmg:NoteReceivableMember2023-12-310001058090us-gaap:FairValueInputsLevel3Member2023-12-310001058090cmg:TractorMember2024-12-310001058090cmg:TractorMember2023-12-310001058090cmg:TractorMember2022-01-012022-12-310001058090cmg:TractorMember2024-01-012024-12-310001058090cmg:TractorMember2023-01-012023-12-310001058090cmg:HyphenTechnologiesInc.Member2024-12-310001058090cmg:HyphenTechnologiesInc.Member2024-01-012024-12-310001058090cmg:NuroMember2024-12-310001058090cmg:NuroMember2024-01-012024-12-310001058090cmg:CultivateNextFundMember2024-12-310001058090cmg:CultivateNextFundMember2023-12-310001058090us-gaap:ForeignCountryMember2024-12-310001058090us-gaap:ForeignCountryMember2023-12-310001058090us-gaap:StateAndLocalJurisdictionMember2024-12-310001058090us-gaap:StateAndLocalJurisdictionMember2023-12-3100010580902024-12-170001058090us-gaap:CommonStockMember2024-04-012024-06-300001058090us-gaap:TreasuryStockCommonMember2024-04-012024-06-300001058090us-gaap:RetainedEarningsMember2024-04-012024-06-300001058090cmg:NotPartOfShareRepurchasePlanMember2024-01-012024-12-310001058090cmg:NotPartOfShareRepurchasePlanMember2023-01-012023-12-310001058090cmg:NotPartOfShareRepurchasePlanMember2022-01-012022-12-310001058090cmg:StockIncentivePlan2022Member2024-12-3100010580902024-08-312024-08-310001058090us-gaap:RestrictedStockUnitsRSUMemberus-gaap:ShareBasedCompensationAwardTrancheOneMembersrt:ExecutiveOfficerMember2024-08-312024-08-310001058090us-gaap:RestrictedStockUnitsRSUMemberus-gaap:ShareBasedCompensationAwardTrancheTwoMembersrt:ExecutiveOfficerMember2024-08-312024-08-310001058090us-gaap:RestrictedStockUnitsRSUMemberus-gaap:ShareBasedCompensationAwardTrancheThreeMembersrt:ExecutiveOfficerMember2024-08-312024-08-310001058090us-gaap:RestrictedStockUnitsRSUMembersrt:ExecutiveOfficerMember2024-01-012024-12-310001058090cmg:StockOptionsStockAppreciationRightsSOSARsMember2023-12-310001058090cmg:StockOptionsStockAppreciationRightsSOSARsMember2023-01-012023-12-310001058090cmg:StockOptionsStockAppreciationRightsSOSARsMember2024-01-012024-12-310001058090cmg:StockOptionsStockAppreciationRightsSOSARsMember2024-12-310001058090cmg:StockOptionsStockAppreciationRightsSosarsMember2024-01-012024-12-310001058090cmg:StockOptionsStockAppreciationRightsSosarsMember2023-01-012023-12-310001058090cmg:StockOptionsStockAppreciationRightsSosarsMember2022-01-012022-12-310001058090cmg:StockOptionsStockAppreciationRightsSosarsMember2024-12-310001058090us-gaap:RestrictedStockUnitsRSUMember2023-12-310001058090us-gaap:RestrictedStockUnitsRSUMember2024-01-012024-12-310001058090us-gaap:RestrictedStockUnitsRSUMember2024-12-310001058090us-gaap:RestrictedStockUnitsRSUMember2023-01-012023-12-310001058090us-gaap:RestrictedStockUnitsRSUMember2022-01-012022-12-310001058090us-gaap:PerformanceSharesMember2023-12-310001058090us-gaap:PerformanceSharesMember2024-12-310001058090us-gaap:PerformanceSharesMember2023-01-012023-12-310001058090us-gaap:PerformanceSharesMember2022-01-012022-12-310001058090us-gaap:PerformanceSharesMembercmg:VestingPeriod1Membersrt:MinimumMember2024-01-012024-12-310001058090us-gaap:PerformanceSharesMembercmg:VestingPeriod1Membersrt:MinimumMember2023-01-012023-12-310001058090us-gaap:PerformanceSharesMembercmg:VestingPeriod1Membersrt:MaximumMember2023-01-012023-12-310001058090us-gaap:PerformanceSharesMembercmg:VestingPeriod1Membersrt:MaximumMember2024-01-012024-12-310001058090us-gaap:PerformanceSharesMembercmg:DefinedMinimumTargetsNotMetMembersrt:MaximumMember2024-01-012024-12-310001058090us-gaap:PerformanceSharesMembercmg:DefinedMinimumTargetsNotMetMembersrt:MaximumMember2023-01-012023-12-310001058090us-gaap:PerformanceSharesMembercmg:VestingPeriod1Membersrt:MinimumMember2022-01-012022-12-310001058090us-gaap:PerformanceSharesMembercmg:VestingPeriod1Membersrt:MaximumMember2022-01-012022-12-310001058090us-gaap:PerformanceSharesMembercmg:DefinedMinimumTargetsNotMetMember2022-01-012022-12-310001058090us-gaap:PerformanceSharesMembercmg:DefinedMinimumTargetsNotMetMembersrt:MaximumMember2022-01-012022-12-310001058090us-gaap:EmployeeStockMember2024-01-012024-12-310001058090us-gaap:EmployeeStockMember2024-12-310001058090us-gaap:OtherPostretirementBenefitPlansDefinedBenefitMember2024-01-012024-12-310001058090us-gaap:OtherPostretirementBenefitPlansDefinedBenefitMember2023-01-012023-12-310001058090us-gaap:OtherPostretirementBenefitPlansDefinedBenefitMember2022-01-012022-12-310001058090us-gaap:SupplementalEmployeeRetirementPlanDefinedBenefitMember2024-12-310001058090us-gaap:SupplementalEmployeeRetirementPlanDefinedBenefitMember2023-12-310001058090us-gaap:SupplementalEmployeeRetirementPlanDefinedBenefitMember2024-01-012024-12-310001058090us-gaap:SellingGeneralAndAdministrativeExpensesMember2024-01-012024-12-310001058090us-gaap:SellingGeneralAndAdministrativeExpensesMember2023-01-012023-12-310001058090us-gaap:SellingGeneralAndAdministrativeExpensesMember2022-01-012022-12-310001058090us-gaap:OtherOperatingIncomeExpenseMember2024-01-012024-12-310001058090us-gaap:OtherOperatingIncomeExpenseMember2023-01-012023-12-310001058090us-gaap:OtherOperatingIncomeExpenseMember2022-01-012022-12-310001058090us-gaap:GeneralAndAdministrativeExpenseMember2024-01-012024-12-310001058090us-gaap:GeneralAndAdministrativeExpenseMember2023-01-012023-12-310001058090us-gaap:GeneralAndAdministrativeExpenseMember2022-01-012022-12-310001058090us-gaap:OperatingLeaseLeaseNotYetCommencedMember2024-12-310001058090cmg:JPMorganChaseBankMemberus-gaap:RevolvingCreditFacilityMember2024-12-310001058090cmg:JPMorganChaseBankMemberus-gaap:RevolvingCreditFacilityMember2024-01-012024-12-310001058090cmg:TractorMembercmg:PurchasesFromSupplierMember2024-01-012024-12-310001058090cmg:TractorMembercmg:PurchasesFromSupplierMember2023-01-012023-12-310001058090cmg:TractorMembercmg:PurchasesFromSupplierMember2022-01-012022-12-310001058090cmg:VebuMembercmg:PurchasesFromSupplierMember2024-01-012024-12-310001058090cmg:VebuMembercmg:PurchasesFromSupplierMember2023-01-012023-12-310001058090cmg:VebuMembercmg:PurchasesFromSupplierMember2022-01-012022-12-310001058090us-gaap:OperatingSegmentsMemberus-gaap:FoodAndBeverageMembercmg:U.S.SegmentMember2024-01-012024-12-310001058090us-gaap:OperatingSegmentsMemberus-gaap:FoodAndBeverageMembercmg:U.S.SegmentMember2023-01-012023-12-310001058090us-gaap:OperatingSegmentsMemberus-gaap:FoodAndBeverageMembercmg:U.S.SegmentMember2022-01-012022-12-310001058090us-gaap:OperatingSegmentsMembercmg:DeliveryServiceMembercmg:U.S.SegmentMember2024-01-012024-12-310001058090us-gaap:OperatingSegmentsMembercmg:DeliveryServiceMembercmg:U.S.SegmentMember2023-01-012023-12-310001058090us-gaap:OperatingSegmentsMembercmg:DeliveryServiceMembercmg:U.S.SegmentMember2022-01-012022-12-310001058090us-gaap:OperatingSegmentsMembercmg:U.S.SegmentMember2024-01-012024-12-310001058090us-gaap:OperatingSegmentsMembercmg:U.S.SegmentMember2023-01-012023-12-310001058090us-gaap:OperatingSegmentsMembercmg:U.S.SegmentMember2022-01-012022-12-310001058090us-gaap:MaterialReconcilingItemsMember2024-01-012024-12-310001058090us-gaap:MaterialReconcilingItemsMember2023-01-012023-12-310001058090us-gaap:MaterialReconcilingItemsMember2022-01-012022-12-310001058090us-gaap:CorporateNonSegmentMember2024-01-012024-12-310001058090us-gaap:CorporateNonSegmentMember2023-01-012023-12-310001058090us-gaap:CorporateNonSegmentMember2022-01-012022-12-310001058090country:US2024-12-310001058090country:US2023-12-310001058090us-gaap:NonUsMember2024-12-310001058090us-gaap:NonUsMember2023-12-3100010580902024-10-012024-12-310001058090cmg:ScottBoatwrightMember2024-01-012024-12-310001058090cmg:ScottBoatwrightMember2024-10-012024-12-310001058090cmg:ScottBoatwrightMember2024-12-310001058090cmg:BrianNiccolMember2024-02-090001058090cmg:JackHartungMember2024-02-090001058090cmg:CurtGarnerMember2024-02-090001058090cmg:ScottBoatwrightMember2024-02-090001058090cmg:ChrisBrandtMember2024-02-09
UNITED STATES
SECURITIES AND EXCHANGE COMMISSION
WASHINGTON, D.C. 20549
______________________
FORM 10-K
______________________
x ANNUAL REPORT PURSUANT TO SECTION 13 OR 15(d) OF THE SECURITIES EXCHANGE ACT OF 1934
For the fiscal year ended December 31, 2024
or
o TRANSITION REPORT PURSUANT TO SECTION 13 OR 15(d) OF THE SECURITIES EXCHANGE ACT OF 1934
For the transition period from to
Commission File Number: 1-32731
______________________
CHIPOTLE MEXICAN GRILL, INC.
(Exact name of registrant as specified in its charter)
______________________
| | | | | |
Delaware | 84-1219301 |
(State or other jurisdiction of incorporation or organization) | (IRS Employer Identification No.) |
| |
610 Newport Center Drive, Suite 1100 Newport Beach, CA | 92660 |
| (Address of Principal Executive Offices) | (Zip Code) |
Registrant’s telephone number, including area code: (949) 524-4000
Securities registered pursuant to Section 12(b) of the Act:
| | | | | | | | |
| Title of each class | Trading Symbol(s) | Name of each exchange on which registered |
| Common stock, par value $0.01 per share | CMG | New York Stock Exchange |
Securities registered pursuant to Section 12(g) of the Act: None
______________________
Indicate by check mark if the registrant is a well-known seasoned issuer, as defined in Rule 405 of the Securities Act. Yes x No o
Indicate by check mark if the registrant is not required to file reports pursuant to Section 13 or Section 15(d) of the Act. Yes o No x
Indicate by check mark whether the registrant: (1) has filed all reports required to be filed by Section 13 or 15(d) of the Securities Exchange Act of 1934 during the preceding 12 months (or for such shorter period that the registrant was required to file such reports), and (2) has been subject to such filing requirements for the past 90 days. Yes x No o
Indicate by check mark whether the registrant has submitted electronically every Interactive Data File required to be submitted pursuant to Rule 405 of Regulation S-T (§232.405 of this chapter) during the preceding 12 months (or for such shorter period that the registrant was required to submit such files). Yes x No o.
Indicate by check mark whether the registrant is a large accelerated filer, an accelerated filer, a non-accelerated filer, a smaller reporting company, or an emerging growth company. See the definitions of “large accelerated filer,” “accelerated filer,” “smaller reporting company,” and “emerging growth company” in Rule 12b-2 of the Exchange Act (check one):
| | | | | | | | | | | | | | |
x Large accelerated filer | o Accelerated filer | o Non-accelerated filer | o Smaller reporting company | o Emerging growth company |
If an emerging growth company, indicate by check mark if the registrant has elected not to use the extended transition period for complying with accounting standards provided pursuant to Section 13(a) of the Exchange Act. o
Indicate by check mark whether the registrant has filed a report on and attestation to its management’s assessment of the effectiveness of its internal control over financial reporting under Section 404(b) of the Sarbanes-Oxley Act (15 U.S.C. 7262(b)) by the registered public accounting firm that prepared or issued its audit report. x
If securities are registered pursuant to Section 12(b) of the Act, indicate by check mark whether the financial statements of the registrant included in the filing reflect the correction of an error to previously issued financial statements. o
Indicate by check mark whether any of those error corrections are restatements that required a recovery analysis of incentive-based compensation received by any of the registrant’s executive officers during the relevant recovery period pursuant to §240.10D-1(b). o
Indicate by check mark whether the registrant is a shell company (as defined in Rule 12b-2 of the Exchange Act). Yes o No x
As of June 30, 2024, the aggregate market value of the registrant’s outstanding common equity held by non-affiliates was $72.256 billion, based on the closing price of the registrant’s common stock on June 28, 2024, the last trading day of the registrant’s most recently completed second fiscal quarter. For purposes of this calculation, shares of common stock held by each executive officer and director and by holders of 5% or more of the outstanding common stock have been excluded since those persons may under certain circumstances be deemed to be affiliates. This determination of affiliate status is not necessarily a conclusive determination for other purposes.
As of January 31, 2025, there were 1,355,337 shares of the registrant’s common stock, par value of $0.01 per share outstanding.
DOCUMENTS INCORPORATED BY REFERENCE
Part III incorporates certain information by reference from the registrant’s definitive proxy statement for the 2025 annual meeting of shareholders, which will be filed no later than 120 days after the close of the registrant’s fiscal year ended December 31, 2024.
TABLE OF CONTENTS
PART I
Cautionary Note Regarding Forward-Looking Statements
This report includes “forward-looking” statements within the meaning of the Private Securities Litigation Reform Act of 1995, including statements about the number of new restaurants we expect to open in 2025 and the number that will include a Chipotlane; our expectation to generate positive cash flow and that our cash from operations will be sufficient to meet ongoing capital expenditures, working capital requirements and other cash needs for the foreseeable future; our expected capital expenditures in 2025 for the construction of new restaurants, remodeling existing restaurants, new equipment and hardware, and technology; our ability to manage risks and pricing volatility in our supply chain; our expectations regarding the outcomes of pending legal matters; the effectiveness of our food safety and cybersecurity programs; our plans for continuing stock buybacks; and all other statements that are not historical facts. We use words such as “may,” “will,” “should,” “expect,” “intend,” “plan,” “anticipate,” “believe,”“estimate,” “seek,” “expect,” “predict,” “could,” “project,” “potential”, “goal” and other similar terms and phrases, including references to assumptions, to identify forward-looking statements. These forward-looking statements are based on currently available operating, financial and competitive information and our actual future results and trends may differ materially depending on a variety of factors, including, but not limited to, the risks and uncertainties described in this report under the heading “Risk Factors” and “Management’s Discussion and Analysis of Financial Condition and Results of Operations,” so you should not place undue reliance on forward-looking statements. These forward-looking statements are subject to risks and uncertainties, including: increasing wage inflation including as a result of state or local regulations mandating higher minimum wages, and the competitive labor market, which impacts our ability to attract and retain qualified employees and has resulted in occasional staffing shortages; the impact of any union organizing efforts and our responses to such efforts; increases in ingredient and other operating costs and the inability of our third-party suppliers and business partners to fulfill their commitments due to inflation, global conflicts, climate change, our Food with Integrity philosophy, tariffs or trade restrictions and supply shortages; risks of food safety incidents and food-borne illnesses; risks associated with our reliance on certain information technology systems operated by us or by third parties and potential failures, outages or interruptions; privacy and cybersecurity risks, including risk of breaches, unauthorized access, theft, modification, destruction or ransom of guest or employee personal or confidential information stored on our network or the network of third-party providers; the impact of competition, including from sources outside the restaurant industry; the impact of government regulations relating to our employees, employment practices, restaurant design and construction, and the sale of food or alcoholic beverages; our ability to achieve our planned growth, such as the costs and availability of suitable new restaurant sites and the equipment and technology needed to fully outfit new restaurants, construction materials and contractors and the expected costs to accelerate our international expansion through licensed restaurants in the Middle East; the uncertainty of our ability to achieve expected levels of comparable restaurant sales due to factors such as changes in guests' perceptions of our brand, including as a result of actual or rumored food safety concerns or other negative publicity, decreased overall consumer spending, including as a result of high inflation, mass layoffs, fears of possible recession and higher energy costs, or the inability to increase menu prices or realize the benefits of menu price increases; risks arising from our reliance on third party delivery services; and risks relating to litigation, including possible governmental actions and potential class action litigation related to food safety incidents, cybersecurity incidents, employment or privacy laws, advertising claims, contract disputes or other matters. We are including this Cautionary Note to make applicable and take advantage of the safe harbor provisions of the Private Securities Litigation Reform Act of 1995 for forward-looking statements. We expressly disclaim any obligation to update or revise any forward-looking statements after the date of this report as a result of new information, future events or other developments, except as required by applicable laws and regulations.
ITEM 1. BUSINESS
General
Chipotle Mexican Grill, Inc., a Delaware corporation, together with its subsidiaries (“Chipotle,” “we,” “us,” or “our”) owns and operates Chipotle Mexican Grill restaurants, which feature a relevant menu of burritos, burrito bowls (a burrito without the tortilla), quesadillas, tacos, and salads. We strive to cultivate a better world by serving responsibly sourced, classically cooked, real food with wholesome ingredients and without artificial colors, flavors or preservatives. We are passionate about providing a great guest experience and making our food more accessible to everyone while continuing to be a brand with a demonstrated purpose. Our first Chipotle restaurant opened in Denver, Colorado in 1993. Over 30 years later, our devotion to seeking out high-quality ingredients, raised with respect for animals, farmers, and the environment, remains at the core of our commitment to Food with Integrity.
As of December 31, 2024, we owned and operated 3,644 Chipotle restaurants throughout the United States (“U.S.”) and 82 international Chipotle restaurants. Additionally, we had three international licensed restaurants. We manage our U.S. operations based on ten regions and aggregate our operations to one reportable segment. Our revenue is derived from sales by our restaurants.
Business Strategy
We are a brand with a demonstrated purpose of Cultivating a Better World. Our mission is to win today while we grow our future by focusing on five key fundamental strategies:
•Running successful restaurants with a people accountable culture that provides great Food with Integrity while delivering exceptional in-restaurant and digital experiences;
•Amplifying technology and innovation to drive growth and productivity at our restaurants, support centers and in our supply chain;
•Making the brand visible, relevant, and loved to acquire new guests and improve overall guest engagement;
•Sustaining world class people leadership by developing and retaining top talent at every level; and
•Expanding access and convenience by accelerating new restaurant openings in North America and internationally.
Food with Integrity
Serving high-quality food at reasonable prices is critical to ensuring guests enjoy wholesome food at a great value. In Chipotle-owned and operated restaurants, we strive to serve only animal products that are raised in accordance with criteria we have established in an effort to improve sustainability and promote animal welfare, and without the use of non-therapeutic antibiotics or added growth hormones. We brand our meats as “Responsibly Raised®.” We also seek to use responsibly grown produce, by which we mean produce grown by suppliers whose practices conform to our Food with Integrity standards and our priorities with respect to environmental considerations and employee welfare. For more information about our sustainability and animal welfare initiatives, see our biennial Sustainability Report and interim Update Report on our website www.chipotle.com/sustainability.
Purchasing
Maintaining the high levels of quality and safety we demand in our restaurants depends in part on our ability to acquire high-quality, fresh ingredients and other necessary supplies that meet our specifications from reliable suppliers. We work with 26 independently owned and operated regional distribution centers that purchase from various suppliers we carefully select based on the suppliers' understanding of and adherence to our mission and Food with Integrity standards, quality and price availability. We have also sought to increase the number of suppliers for our ingredients to help mitigate pricing volatility and reduce our reliance on one or several suppliers, which could create supply shortages. In addition, we closely monitor industry news, trade tariffs, weather, exchange rates, foreign demand, geopolitical crises and other world events that may affect our ingredient prices or available supply. Certain key ingredients are purchased from a small number of suppliers.
Quality Assurance and Food Safety
We are committed to serving only safe, high-quality food. Our food safety and quality assurance teams work to ensure compliance with our food safety programs and practices, components of which include:
•naturally derived inhibitors to prevent microbial growth in ingredients;
•advanced technologies and tools that reduce or eliminate pathogens while maintaining food quality;
•enhanced restaurant procedures and protocols for handling ingredients and sanitizing surfaces in our restaurants;
•food safety certifications;
•internal and third-party restaurant inspections;
•small grower support during on-site audits;
•supplier interventions steps to mitigate food safety risks before ingredients reach Chipotle; and
•ingredient traceability.
These and other food safety practices underscore our commitment to be a leader in food safety while continuing to serve high-quality food that our guests love. Our food safety and quality assurance teams establish and monitor our quality and food safety programs and work closely with suppliers to ensure our high standards are met throughout the supply chain. We maintain a limited list of approved suppliers, many of whom are among the top suppliers in the industry. In addition, we have a team approach where our training, operations, culinary, legal and restaurant food safety and quality assurance departments develop and implement operating standards for food quality, food preparation, restaurant cleanliness, employee health protocols, and safety in the restaurants. Our food safety programs are also intended to ensure we not only continue to comply with applicable food safety regulations, but also establish Chipotle as an industry leader in food safety. To help achieve this goal, we have a Food Safety Advisory Council comprised of some of the nation’s foremost food safety authorities. The Food Safety Advisory Council is charged with evaluating our programs and advising us on ways to maintain and elevate our food safety program. Our food safety and quality assurance team members hold board seats and participate in technical working groups with several associations. This gives us the opportunity to learn and share our knowledge and expertise with other food safety professionals and regulatory agencies.
Digital Business and Innovation
Our digital platform continues to be a strategic driver of our growth. Digital sales represent food and beverage revenue for company-owned restaurants generated through the Chipotle website, Chipotle app or third-party delivery aggregators and include revenue deferrals associated with Chipotle Rewards. Digital sales represented 35.1% of food and beverage revenue in 2024, compared to 37.4% in 2023. We have made digital ordering convenient with continued enhancements to our app and by building more Chipotlanes, which is our drive through format for guest pick-up of digital orders. We are also investing in technology and tools to modernize the back of house of our restaurants and to improve the team member experience.
Human Capital
At Chipotle, our vision is to cultivate an environment where our employees can thrive and grow into great leaders. We believe in investing and supporting our people because they are our most important asset. As of December 31, 2024, Chipotle employed 130,504 people worldwide and 1,328 contract workers. Of our employees, 127,820 worked in the United States, and 2,684 worked internationally across Canada, France, Germany, and the United Kingdom. Within the U.S., 126,233 employees worked in our restaurants, and 1,587 in our Restaurant Support Centers and Field Leadership. There were no union petitions or campaigns in 2024, and we continue to bargain in good faith with the one restaurant that voted in 2022 to form a union. We also continue to focus on building a positive people culture where employees feel supported, heard, and are able to grow with Chipotle.
Talent Acquisition
We remain committed to the growth, development, and advancement of our people. In 2024, over 85% of our in-restaurant leadership roles were filled through internal promotions, which remains a critical component to our staffing strategy. To continually attract and hire external talent, we remain focused on creating a best-in-class job seeker and General Manager hiring experience that prioritizes speed, but that also aims to create a transparent process; an experience that identifies shift-specific needs and elevates our talent bar for quality-of-hire. We have seen early success with our new virtual hiring assistant "Ava Cado", almost doubling our application flow. With Ava Cado, approximately 90% of applications are completed, and restaurants are leveraging automated interview rescheduling, freeing up managers to run great restaurants and serve our guests.
To expand our recruitment marketing efforts we continue developing both new and existing partnerships, such as Transition Overwatch and Recruit Military, which assist transitioning Veterans and their spouses. We also prioritize understanding the hiring needs of our international operations in Canada, the United Kingdom, France, and Germany.
Culture and Inclusivity ("C&I")
Our purpose extends beyond serving nutritious food using real ingredients. We are on a journey to create a global culture where everyone is welcome and feels a genuine sense of belonging, and we believe this is achieved through our daily interactions and commitment to model inclusive leadership.
In 2024, Chipotle continued to invest in employee development and training. Our learning programs include inclusive topics and skill-building to provide our leaders with the resources they need to succeed in their current roles and prepare for the future. Our training programs will continue to evolve to respond to a constantly changing world.
Devotion to our culture of inclusivity emanates from our values and the belief that our people make us what we are. We do not see inclusion as a moment, but a movement towards a future where all people can experience success as their best authentic selves. That is why our efforts are not confined to certain roles, departments, identities, or geographies. Driven by a strategy spanning across culture, community, candidate, career, and commerce, we are making meaningful strides towards a future where diversity is understood, embraced, and is a source of our strength.
Maintaining a work environment where all people can succeed as their full authentic self is critical to our success as a business. To deliver meaningful programs that meet the needs of our employees, it is important we understand the dynamic composition of our workforce. As of December 31, 2024, 48.9% of our workforce was male and 49.8% of our workforce was female.
Our most recent Equal Employment Opportunity consolidated report is posted on the Investors page of our website at www.ir.chipotle.com under Corporate Governance – Human Capital Information and additional details about the demographics of our employee population is included in our biennial Sustainability Report and interim Update Report on our website www.chipotle.com/sustainability.
We have undertaken a range of activity to promote a culture of inclusion:
•We continue to drive a consistent and structured candidate interview process with interview guides. This ensures top candidates are identified through equitable hiring practices in both internal and external candidate interviews. We also launched an internal job board across multiple communication channels to provide increased visibility and access to internal opportunities.
•In 2024, Chipotle hired a Director of C&I to create and execute a strategy for inclusion, advise across Centers of Excellence, and enhance existing programs with C&I training. This specialized role is also responsible for the continued maturation of our Employee Resource Groups through a new strategy that improves the leader and member experience.
•We have a holistic approach to pay equity to ensure consistent and equitable compensation among our employees. We retain an independent third-party compensation consultant each year to conduct a pay equity analysis of our U.S. and Canadian workforce, including factors of pay (e.g., grade level, tenure in role, most recent promotion) and external market conditions (e.g., geographic location), to ensure equitable treatment among our employees. In 2024, our review included 99% of our U.S. and Canadian employee population, excluding only approximately 50 of our most senior management employees. The analysis identified small, isolated pay gaps for certain segments of the population, and we subsequently made pay adjustments to close those gaps. Since there are not many common roles among our 50 most senior executives, we consider both internal equity by level, as well as individualized market data, to help ensure we maintain pay equity among this group.
Talent Management
We are committed to cultivating a high-performing workforce through a talent development strategy that prioritizes attracting, developing, and retaining exceptional talent at every level of the organization. In 2024, we promoted over 23,000 employees. Importantly, amongst our Field Leadership roles (Field Leaders, Team Directors, Regional Directors of Operations, and Regional Vice Presidents), the internal promotion rate was above 80%.
Our robust hiring, onboarding, and training programs ensure our newly hired and recently promoted employees are set up for success and are aligned with Chipotle's values and goals. We deployed a variety of critical programming ensuring leadership development where most needed. Some notable highlights include:
•Cultivate University is our leadership training program for new Field Leaders and Team Directors navigating multi-unit management for the first time. Leaders are brought together for a four-day immersive leadership experience designed to bolster leadership skills, while validating and grounding attendees in the operational skills necessary to succeed. In 2024, we had 129 leaders complete the program.
•We introduced additional required restaurant leader training at all levels in 2024, building skills around accountability, coaching, feedback, delegation, and resolving conflict. The courses are designed to align with the leadership skills necessary to excel at each level of restaurant management.
•We formalized our Field Leader in Training materials and have seen cohorts launch throughout the business, ensuring that Managers interested in promotion are getting the development they need to take on the next role.
•Leadership Evolution and Development, our leadership development program, is designed to prepare a cross-functional cohort of mid-level managers for the future of work and leadership. During the 6-month program, participants focus on the capabilities of leading oneself, others, and the business with topics designed to stretch capabilities and improve decision-making skills.
In addition, to ensure leadership continuity, we maintain a robust succession planning process, focusing on critical roles across the company. In 2024, we identified successors for 72% of key positions and continued to develop individualized development plans tailored to prepare successors for readiness. Due to Chipotle's growth, we are excited about two newly created regions and three promotions into Regional Director of Operations and Regional Vice President roles, highlighting additional growth and development for our field teams.
Total Rewards
The financial, physical, and mental well being of our employees remains our top priority. We believe we have compelling compensation packages and incentive programs, and a robust suite of benefit offerings that enable us to engage current team members and attract new team members. In 2024, we conducted an Employee Value Proposition survey which was intended to help us understand what employees appreciate in Chipotle as an employer, what needs improvement and what drives value for our employees. We have gathered valuable insights that will help us continue to improve the employee experience and attract and retain the best talent in the industry. Other areas of Total Rewards that help support our employees include:
•We have made substantial investments in our compensation packages, including competitive wages and industry leading incentive programs, such as our annual and quarterly bonus programs.
•We offer a Debt-Free Degree program that provides Chipotle employees' access to nearly 100 degrees at 10 universities, completely tuition free.
•We support Career Certificates, which further enhances our Tuition Assistance benefits by providing on-demand certificate programs to help Chipotle team members advance their careers in as little as eight weeks.
•We offer a student loan payment matching programs via our 401(k) retirement program. This, in addition to a credit optimization service, has helped to bolster our employees' financial well-being.
•We also offer personalized mental health assistance to all Chipotle employees and their family members with support available 24/7 via in-person, phone, or virtual visits with a licensed counselor.
•Starting in 2025, we are expanding our mental health benefits by offering free access to a mental health app to all U.S. employees.
Employee Listening
We value feedback; both positive sentiments and constructive comments help us improve our organization and culture. Many of our best ideas come from Chipotle employees and we use various communication channels to maintain awareness and responsiveness to questions, concerns, and ideas across our workforce. This includes direct daily engagement through meetings with General Managers, lunch and learns, and other one-on-one interactions.
Employees are encouraged to ask questions, voice concerns directly or anonymously report potential violations of Chipotle's Code of Ethics through our Respectful Workplace hotline. Employees also can raise concerns using other mechanisms, including communication with their managers or human resources business partners. We actively encourage our employees to report any issues or concerns without fear of reprisal, intimidation, or harassment.
We also respond to employee issues quickly via our Employee Service Center which is available seven days a week to resolve employee questions about things like restaurant health and safety, compliance, benefits, payroll, etc.
We are eager to improve our employee engagement efforts and build even stronger feedback mechanisms to ensure our employees feel valued, heard and respected.
Government Regulation and Environmental Matters
We are subject to various federal, state and local laws and regulations that govern aspects of our business operations. While costs associated with compliance with laws and regulations have increased as the number and scope of regulations have increased, the total costs incurred have not had, and are not expected to have, a material effect on our capital expenditures, results of operations or competitive position. See “Risk Factors” in Item 1A for discussion of risks relating to federal, state, local and international laws and regulations applicable to our business.
Seasonality
Seasonal factors influencing our business are described under the heading “Quarterly Financial Data/Seasonality” in Item 7. “Management’s Discussion and Analysis of Financial Condition and Results of Operations.”
Competition
The fast-casual, quick-service, and casual dining segments of the restaurant industry are highly competitive with respect to, among other things, taste, price, food quality and presentation, service, location, convenience, brand reputation, and cleanliness and ambience of each restaurant. Our competition includes a variety of restaurants in each of these segments, including locally-owned restaurants, as well as national and regional chains. Competition from food delivery services, which offer meals from a wide variety of restaurants, also has increased in recent years and is expected to continue to increase. Many of our competitors also offer dine-in, carry-out, online, catering, and delivery services. Among our main competitors are restaurant formats that claim to serve higher quality ingredients without artificial flavors, colors and preservatives, and that serve food quickly and at a reasonable price.
Our Intellectual Property and Trademarks
“Chipotle,” “Chipotle Mexican Grill,” “Food with Integrity,” “Responsibly Raised,” “Chipotle Rewards,” and a number of other marks and related designs and logos are U.S. registered trademarks of Chipotle. We have filed trademark applications for a number of additional marks in the U.S. as well. In addition to our U.S. registrations, we have registered trademarks for “Chipotle” and a number of other marks in Canada, the European Union, the Middle East and various other countries, and have filed trademark applications for “Chipotle Mexican Grill,” “Chipotle” and a number of other marks in additional countries. We also believe that the design of our restaurants is our proprietary trade dress and have registered elements of our restaurant design for trade dress protection in the U.S. as well.
From time to time, we have taken action against other restaurants that we believe are misappropriating our trademarks, restaurant designs or advertising. Although our policy is to protect and defend vigorously our rights to our intellectual property, we may not be able to adequately protect our intellectual property, which could harm the value of our brand and adversely affect our business.
Available Information
We maintain a website at www.chipotle.com, including an investor relations section at ir.chipotle.com, on which we routinely post important information, such as webcasts of quarterly earnings calls and other investor events in which we participate or host, and any related materials. Our Code of Ethics and our Supplier Code of Conduct also are available in this section of our website. You may access our annual reports on Form 10-K, quarterly reports on Form 10-Q, current reports on Form 8-K and amendments to those reports, as well as other reports relating to us that are filed with or furnished to the SEC, free of charge in the investor relations section of our website as soon as reasonably practicable after such material is electronically filed with or furnished to the SEC. The SEC also maintains a website that contains reports, proxy and information statements and other information regarding issuers that file electronically with the SEC at www.sec.gov.
The contents of the websites mentioned above and elsewhere in this report are not incorporated into and should not be considered a part of this report. The references to the URLs for these websites are intended to be inactive textual references only.
ITEM 1A. RISK FACTORS
You should carefully consider the risks described below in addition to the other information set forth in this Annual Report on Form 10-K, including the “Management’s Discussion and Analysis of Financial Conditions and Results of Operations” section and the consolidated financial statements and related notes. If any of the risks and uncertainties described below occur or continue to occur, our business, financial condition and results of operations, and the trading price of our common stock could be materially and adversely affected. The risks and uncertainties described below are those that we have identified as material but are not the only risks and uncertainties we face. Our business is also subject to general risks and uncertainties that affect many other companies, including, but not limited to, overall economic and industry conditions. Additional risks not currently known to us or that we presently deem immaterial may arise or become material and may negatively impact our business, reputation, financial condition, results of operations or the trading price of our common stock.
Risks Related to our Brand Reputation and Restaurant Operations
Food safety and food-borne illness concerns may have an adverse effect on our business by negatively impacting our brand, decreasing sales and increasing costs.
Food safety is our top priority, and we dedicate significant resources to ensuring that our guests enjoy safe, high-quality food products. However, even with strong preventative controls and interventions from farm to restaurant, food safety risks cannot be completely eliminated. Incidents of food-borne illnesses continue to occur in the restaurant and retail food industries and incidents may result from the failure of restaurant employees to properly cook or maintain our ingredients, employees or guests entering our restaurant while infected with communicable diseases, or contaminated ingredients resulting from the failure of one of our suppliers to execute food safety preventive controls. Although we monitor and audit compliance with our program, we cannot guarantee that every food item is safely and properly maintained from the start of the supply chain through guest consumption. Any report, legitimate or rumored, of food-borne illness caused by pathogens such as E. coli, hepatitis A, norovirus, listeria, Campylobacter, Clostridium perfringens or salmonella, or other food safety issues, such as food tampering or contamination, at one of our restaurants could adversely affect our reputation and have a negative impact on our sales. In addition, instances of food-borne illness or food safety issues that occur solely at competitors’ restaurants, suppliers or distributors (even if we do not work with them) could result in negative publicity about the restaurant industry and adversely impact our sales. The occurrence of food-borne illnesses or food safety issues could also adversely affect the price and availability of affected ingredients, resulting in higher costs and lower margins.
We may be at a higher risk for food safety incidents than some competitors due to our greater use of fresh, unprocessed produce, handling of raw chicken in our restaurants, our reliance on employees cooking with traditional methods and the lack of artificial preservatives and frozen ingredients in our menu items. The risk of illnesses associated with our food also may increase due to our delivery or catering businesses, in which our food is transported, stored and/or served in conditions that are not under our control. All of these factors could have an adverse impact on our ability to attract and retain guests, which could in turn have a material adverse effect on our growth and profitability. In addition, real or perceived concerns about emerging food safety issues, such as phthalates, per- and polyfluoroalkyl substances ("PFAS"), microplastics or heavy metals in the U.S. food supply chain, could impact consumers’ confidence in the restaurant industry and reduce restaurant sales.
Failure to maintain the reputation and relevance of the Chipotle brand could negatively impact our financial results.
We built strong value in the Chipotle brand by serving delicious, high quality food, made fresh every day using responsibly sourced ingredients served in generous portions. Our continued success depends on maintaining this compelling brand value, which may be eroded by numerous factors, some of which are outside of our control. Incidents that could erode trust in our brand include actual or perceived food safety or food-borne illnesses; allegations of unethical, racially-biased, inequitable, or socially irresponsible behavior by employees and/or guests; privacy breaches or violations of privacy laws; safety-related incidents occurring in or around our restaurants; guest perceptions regarding smaller entrée portion sizes; or other events or incidents described in this risk factors section. The adverse impact of such incidents may be compounded by negative publicity, including through social or digital media, or if they result in litigation. Social media, video-sharing, networking, and gaming and messaging platforms dramatically increase the speed with which negative publicity is disseminated, often before we have a meaningful opportunity to investigate, respond to and address an issue. Negative online postings or comments about us, including as a result of inaccurate, fictitious or malicious postings or media content, have in the past and could in the future magnify and prolong the adverse impact of any one incident and increase the damage to the value of our brand.
Additionally, consumer demand for our products and our brand value could diminish significantly if we, our employees or business partners fail to comply with applicable laws and regulations, take controversial positions or actions, fail to deliver a consistently positive guest experience or fail to foster an inclusive and welcoming environment. In addition, we cannot ensure that our restaurant crew or business partners will not take actions that adversely affect our brand reputation and relevance.
The restaurant industry is highly competitive. If we are not able to compete successfully, our business, financial condition and results of operations would be adversely affected.
The restaurant industry is highly competitive with respect to taste preferences, price, food quality and selection, customer service, brand reputation, digital engagement, advertising and promotional initiatives, and the location, attractiveness and maintenance of restaurants. We also compete with non-traditional market participants, such as “convenience meals” in the form of entrées, side dishes or meal preparation kits from grocery stores, meal kit delivery services, and “ghost” or “dark” kitchens, where meals are prepared at separate takeaway premises rather than a restaurant, and with delivery aggregators and food delivery services, which provide consumers with convenient access to a broad range of competing restaurant chains and food retailers, particularly in urbanized areas, and may form a closer relationship with our guests. Increased competition could have an adverse effect on our sales, profitability and development plans. If guest tastes or dietary preferences change, if our marketing efforts are unsuccessful, or if our restaurants are unable to compete successfully with other restaurant outlets, our business could be adversely affected.
We continue to believe our commitment to higher-quality and responsibly sourced ingredients resonates with guests and gives us a competitive advantage; however, many of our competitors also make claims related to the quality of their ingredients and lack of artificial flavors, colors and preservatives. The increasing use of these claims by competitors, regardless of the accuracy of such claims, may lessen our differentiation and make it more difficult for us to compete. If we are unable to continue to maintain our distinctiveness and compete effectively, our business, financial condition and results of operations could be adversely affected.
Our investments in technology and automation to transform and enhance the experience of our employees and guests may not generate the expected results.
We have launched several initiatives to make our food preparation and cooking processes more efficient and drive a better experience for our employees and consumers, most of which are still moving through our “stage gate” development and evaluation process. These initiatives include a dual sided plancha, which is our cooking grill; an automated produce slicer; an automated make line by Hyphen, which would automatically assemble guest ordered bowls and salads; and Autocado, an automated avocado processing device that cuts, cores and scoops avocados. We have invested significant time and resources into developing and testing these technologies, but there can be no guarantee that all or any of them will be widely deployed throughout our restaurant network or, if deployed, will materially improve employee or guest experience or our financial performance. We also continue to build upon our investments in digital ordering and guest engagement to enhance guest experience and strengthen our ties with our guests. If these initiatives are not ultimately deployed or if we do not fully realize the intended benefits of these significant investments, our business results may suffer.
Our use of third-party delivery services may not be profitable and substandard service may negatively impact our reputation.
Over 15% of our 2024 food and beverage revenue consisted of delivery orders for which we are reliant on third-party delivery companies. Depending on which ordering platform a guest uses – our platform or the third-party delivery service platform – the delivery fee we collect from the guest may be less than the actual delivery cost. As the delivery industry consolidates, delivery companies gain greater leverage in negotiating the terms of contracts and increasing pricing, which in turn could negatively impact our profits from this channel. If the third-party delivery companies we utilize increase the fees they charge users or give greater priority or promotions on their platforms to other restaurants, our delivery business and our sales may be negatively impacted. In addition, if a third-party delivery driver fails to deliver an order on time, fails to deliver the complete order or otherwise provides a bad guest experience, our guest may attribute that negative experience to Chipotle and our reputation and sales could be adversely impacted. The ordering and payment platforms used by these third parties, our mobile app or our online ordering site have been and could again be interrupted by technological failures, user errors, cyber-attacks or other factors, which could adversely impact sales through these channels and negatively impact our overall sales and reputation.
Risks Related to Human Capital
If we are not able to hire, develop and retain qualified restaurant employees and/or appropriately plan our workforce, our growth plan and profitability could be adversely affected.
The aggressive pace at which we open new restaurants can make it increasingly difficult to recruit and hire sufficient numbers of qualified employees to manage and work in our restaurants, to train employees to deliver a consistently high-quality product and guest experience and to maintain an effective system of internal controls for a dispersed workforce, which could materially harm our business and results of operations. Maintaining appropriate staffing in our restaurants requires precise workforce planning, which has become more complex due to predictive scheduling laws (also called “fair workweek” or “secure scheduling”) and “just cause” termination legislation in certain geographic areas where we operate. The market for qualified talent continues to be competitive and we must continue to offer competitive wages, benefits and workplace conditions to retain qualified employees. We have experienced and may continue to experience challenges in hiring and retaining restaurant employees and in maintaining full restaurant staffing in various locations, which has resulted in longer wait times for guest orders, temporary closures of the digital make line and decreased employee and guest satisfaction. A shortage of qualified candidates who meet legal work authorization requirements, failure to hire, train and retain new restaurant employees in a timely manner or higher than expected turnover levels could affect our ability to open new restaurants, grow sales at existing restaurants or meet our labor cost objectives. Anticipated changes in immigration laws and regulations could decrease the pool of candidates with legal work authorization, cause disruption in the workforce for all companies that rely on hourly workers and increase the costs, time and requirements to hire new employees. In addition, failure to adequately monitor and proactively respond to employee dissatisfaction could lead to poor guest satisfaction, higher turnover, litigation and unionization efforts, which could negatively impact our financial results. We have experienced labor union efforts to organize groups of our employees from time to time and, if successful, those organizational efforts may decrease our operational flexibility and disrupt our normal operations, which could adversely affect our business.
If we fail to comply with applicable employment and labor laws and regulations, it could have a material, adverse impact on our business.
Various employment and labor laws and regulations govern our relationships with our employees, both within and outside the U.S. These laws and regulations relate to matters such as employment discrimination, wage and hour laws, requirements to provide and document meal and rest periods or other benefits, family leave mandates, requirements regarding working conditions and accommodations to certain employees, requirements relating to setting and changing work schedules, citizenship or work authorization and related requirements, insurance and workers’ compensation rules, healthcare laws, anti-discrimination laws, including pay transparency requirements, and anti-harassment laws. We incur substantial costs to comply with these laws and regulations and non-compliance could expose us to significant liabilities. For example, we have had lawsuits filed against us alleging violations of federal and state laws regarding employee wages and payment of overtime, meal and rest breaks, pay transparency to applicants and related practices. We incur legal costs to defend these types of cases, and we could incur losses from these and similar cases, and the amount of such costs and losses could be material.
In addition, some jurisdictions in which we operate have implemented fair workweek or “secure scheduling” legislation, which impose complex requirements related to scheduling for certain restaurant employees; sick pay and paid time off legislation, which requires employers to provide paid time off to employees; and/or “just cause” termination legislation, which restricts companies’ ability to terminate employees or reduce employees’ hours unless they can prove “just cause” or a “bona fide economic reason” for the termination or reduction in hours. Additional jurisdictions are considering similar types of legislation. All of these regulations impose additional obligations on us, which could increase our operating costs, and our failure to comply with any of these regulations could subject us to penalties and other legal liabilities, which could adversely affect our ability to attract and retain employees and our results of operations, and potentially cause us to close or reduce operating hours of some restaurants in these jurisdictions. For example, in 2022 we settled a complaint alleging that we violated New York City’s Fair Workweek law and Earned Safe and Sick Time Act, and we have undergone several audits of our compliance with employment law requirements, which could result in additional liabilities. Our liability exposure for these employment laws and regulations may be higher than our restaurant peers because we have more employees, since we are one of the largest restaurant companies that owns and operates all our restaurants, while most of our restaurant peers franchise some or a significant portion of their operations.
Increases in the cost of labor, including mandated minimum wage increases and increases in the cost of health benefits, could adversely impact our business and profitability.
Our profitability has been and could continue to be adversely impacted by increases in labor costs, including wages and health benefits, which are some of our most significant costs, including increases triggered by federal, state and local laws governing matters such as minimum wages, meal and rest breaks and changes to eligibility for overtime pay; regulations regarding scheduling and benefits; increased health care and workers’ compensation insurance costs; and higher wages and benefit costs necessary to attract, hire and retain high-quality employees with the right skill sets in a highly competitive job market. In addition, state and local laws may require wage increases and standards on working hours and other factors that would restrict our flexibility to respond to market conditions and increase our costs without corresponding benefits. For example, in 2024 California required national restaurant chains, including Chipotle, to pay a minimum $20 per hour wage to California restaurant workers, which minimum wage may be increased annually by a state-appointed council. Other states, counties and cities are considering similar regulations. Our ability to offset higher labor costs by increasing menu prices depends on the willingness of our guests to pay the higher prices and the perceived value of our meals relative to competitors. If competitive or inflationary pressures or other factors prevent us from offsetting higher labor costs by increased menu prices, our profitability may decline.
A failure to recruit, develop and retain effective leaders or the loss or shortage of management personnel with key capacities and skills could impact our strategic growth plans and jeopardize our ability to meet our business performance expectations and growth targets.
Our ability to continue to grow our business depends substantially on the contributions and abilities of our executive leadership team and other key management personnel. Changes in senior management could result in significant changes in strategic direction and initiatives. A failure to maintain appropriate organizational capability to support our strategic initiatives, a failure to implement appropriate development programs and build adequate bench strength with key skillsets, or a failure to effectively manage our leadership succession, could jeopardize our ability to meet our business performance expectations and growth targets. If we are unable to attract, develop, retain and incentivize sufficiently experienced and capable management personnel, our business and financial results may suffer.
Risks Related to Cybersecurity, Data Privacy and IT Systems
Breaches or other unauthorized access, theft, modification or destruction of guest and/or employee personal, confidential or other material information that is stored in our systems or by third parties on our behalf could damage our reputation and expose us to potential liabilities.
As our reliance on technology has grown, the scope and severity of potential risks from cyber threats has increased. Many of our information technology systems (whether cloud-based or hosted in proprietary servers), including those used for our point-of-sale, web and mobile platforms, online and mobile payment systems, delivery services and rewards programs and administrative functions, contain personal, financial or other information that is entrusted to us by our guests, business partners and employees. Many of our information technology systems also contain confidential information about our business, such as business strategies, development initiatives and designs, and confidential information about third parties, such as suppliers. Similar to many other restaurant companies, we have in the past experienced, and we expect to continue to experience, cyber-attacks, including phishing, and other attempts to breach, or gain unauthorized access to, our systems and databases. To date, these attacks have not had a material impact on our operations, but we cannot provide assurance that they will not have an impact in the future.
Our third-party providers’ and business partners’ information technology systems and databases are subject to similar risks. The number and frequency of these attempts varies from year to year and increases as the scope and scale of our technology footprint and digital operations increases. In addition, we provide guest and employee data, as well as confidential information important to our business to third parties. Individuals performing work for us and these third parties also may access some of this data, including on personally owned digital devices. To the extent we, a third party or such an individual were to experience a breach of our or their information technology systems that results in the unauthorized access, theft, use, destruction or other compromises of guests’ or employees’ data or confidential information of Chipotle stored in or transmitted through such systems, including through cyber-attacks or other external or internal methods, it could result in a material loss of revenues from the potential adverse impact to our reputation and brand, a decrease in our ability to retain guests or attract new ones, the imposition of potentially significant costs (including loss of data or payment for recovery of data) and liabilities, loss of business, loss of business partners and licensees and the disruption to our supply chain, business and plans. Unauthorized access, theft, use, destruction or other compromises are becoming increasingly sophisticated and may occur through a variety of methods, including attacks using malicious code, vulnerabilities in software, hardware or other infrastructure (including systems used by our supply chain), system misconfigurations, phishing, deepfakes, ransomware, malware or social engineering. The rapid evolution and increased adoption of artificial intelligence technologies may intensify our cybersecurity risks. Our logging capabilities, or the logging capabilities of third parties, are not always complete or sufficiently granular, affecting our ability to fully understand the scope of security breaches.
Given the increasing complexity and sophistication of techniques used by bad actors to obtain unauthorized access to or disable information technology systems, and the fact that cyberattacks are being made by groups and individuals with a wide range of expertise and motives, it is increasingly difficult to anticipate and defend against cyberattacks, and a cyberattack could occur and persist for an extended period of time before being detected. Moreover, the extent of a particular cyber incident and the steps that we may need to take to investigate the incident may not be immediately clear, and it may take a significant amount of time before such investigation can be finalized and completed and reliable information about the incident is known. During the pendency of any such investigation, we may not know the extent of the harm or how best to remediate it, and we may be required to disclose incidents before their full extent is known.
Such security breaches also could result in a violation of applicable U.S. and international privacy, cyber and other laws or trigger data breach notification laws, including new disclosure rules promulgated by the SEC, and subject us to private third party or securities litigation and governmental investigations and proceedings, any of which could result in our exposure to material civil or criminal liability. These risks also exist in companies that license our brand, that we partner with or invest in that use separate information systems.
We may be required to make significant capital investments and other expenditures to investigate security incidents, remedy cybersecurity problems, recuperate lost data, prevent future compromises and adapt systems and practices to react to the changing threat environment. These include costs associated with notifying affected individuals and other agencies, additional security technologies and training, hiring additional employees, retention of experts and providing credit monitoring services for individuals whose data has been breached. These costs could be material and could adversely impact our results of operations in the period in which they are incurred, including by causing us to delay the pursuit of other important business strategies and initiatives, and may not meaningfully limit the success of future attempts to breach our information technology systems.
Media or other reports of existing or perceived security vulnerabilities in our systems or those of our third-party business partners or service providers can also adversely impact our brand and reputation and negatively impact our business. Additionally, the techniques and sophistication used to conduct cyber-attacks and compromise information technology systems, as well as the sources and targets of these attacks, change frequently and are often not recognized until such attacks are launched or have been in place for a period of time. The rapid evolution and increased adoption of artificial intelligence technologies amplifies these concerns. We continue to make significant investments in technology, third-party services and employees to develop and implement systems and processes that are designed to anticipate cyber-attacks and to prevent or minimize breaches of our information technology systems or data loss, but these security measures cannot provide assurance that we will be successful in preventing such breaches or data loss.
If we fail to fully comply with privacy and data protection laws and regulations, we could incur significant civil and criminal penalties and liabilities, suffer reputational damage, and adverse publicity.
Complex local, state, federal and international laws and regulations apply to the collection, use, retention, protection, disclosure, transfer and other processing of personal data. These privacy and data protection laws and regulations are quickly evolving, with new or modified laws and regulations proposed and implemented frequently and existing laws and regulations subject to new or different interpretations and enforcement. Complying with these laws and regulations can be costly and can delay or impede the development of new services.
For example, Europe’s General Data Protection Regulation (“GDPR”) and the U.K. General Data Protection Regulation (which implements the GDPR into U.K. law), impose stringent data protection requirements and provide for significant penalties for noncompliance. Additionally, the California Consumer Privacy Act (“CCPA”) requires, among other things, covered companies to provide specified disclosures to California consumers and allows them to exercise certain rights in connection with their personal information, such as the right to opt-out of certain sales of personal information and to request deletion of personal information (subject to certain exceptions). The CCPA also provides for civil penalties for violations as well as a private right of action for data breaches that may increase data breach litigation. Further, the California Privacy Rights Act, which became effective in January 2023, significantly modified the CCPA to include additional compliance obligations. Since the CCPA was first passed, 19 other states have enacted similar data privacy legislation, eight of which are in effect as of the end of 2024. In addition, a number of other states have passed or are considering additional privacy laws, including laws on health data and biometric data that are in effect, or are expected to take effect in the near future. These state privacy laws will require us to incur additional costs and expenses in our efforts to comply.
If we fail or are perceived to have failed to comply with applicable privacy and data protection laws, or fail to properly respond to or honor consumer requests under any of the foregoing privacy laws, we could be subject to enforcement actions and regulatory investigations, or claims for damages by guests and other affected individuals or parties, or incur fines and damage to our brand reputation, any of which could have a material adverse effect on our operations, financial performance, and business. The amount and scope of insurance we maintain may not cover all types of claims that may arise.
We rely heavily on information technology systems and failures or interruptions in our IT systems could harm our ability to effectively operate our business and/or result in the loss of guests or employees.
We are heavily dependent on information technology systems, including for administrative functions, point-of-sale and payment processing in our restaurants, digital ordering and delivery business, tracing ingredients back to suppliers and growers, digital Hazard Analysis and Critical Control Points monitoring, monitoring and managing our supply chain, our guest rewards program, marketing initiatives, employee engagement and payroll processing, and various other processes and transactions. Our ability to effectively manage our business and coordinate the procurement, production, distribution, safety and sale of our products depends significantly on the consistent availability, reliability and security of these systems. Many of these critical systems are provided and managed by third parties, and we are reliant on these third-party providers to implement protective measures that ensure the security and availability of their systems. Although we have operational safeguards in place and we take efforts to ensure that our third-party providers have implemented proper standards and controls, we cannot guarantee that breaches or failures caused by these third-party systems or platforms will not occur. Failures may be caused by various factors, including power outages, natural disasters and other catastrophic events, physical theft, computer and network failures, inadequate or ineffective redundancy, problems with transitioning to upgraded or replacement systems or platforms, flaws in third-party software or services, errors or improper use by our employees or the third-party service providers. If any of our critical IT systems were to become unreliable, unavailable, compromised or otherwise fail, and we were unable to recover in a timely manner, we could experience an interruption in our operations that could have a material adverse impact on our profitability.
Risks Related to Our Supply Chain
Increases in the costs of ingredients, restaurant equipment and other materials could adversely affect our financial results.
The prices for some of our ingredients, such as beef, avocados and other produce fluctuate due to factors beyond our control, such as limited sources, seasonal shifts, climate conditions, inclement weather, natural disasters, inflation, military and geopolitical conflicts and industry demand, including as a result of animal disease outbreaks, international commodity markets, food safety concerns, product recalls and government regulation. In addition, we source some ingredients (including avocados, tomatoes, beef, pork, limes and peppers) restaurant equipment, packaging and paper products outside the U.S. (including from Mexico, Canada and China), which could subject them to increased tariffs, trade sanctions or taxes. We try to mitigate future price risk through forward contracts, strong partnerships with key suppliers, directly managing key raw material procurement and diversifying our supply base and countries of origin; however, these activities may not fully insulate us from increases in costs, which could have an adverse impact on our profitability.
We also could be adversely impacted by price increases specific to meats raised in accordance with our Responsibly Raised animal welfare criteria, and ingredients grown in accordance with our Food with Integrity specifications, the markets for which are generally smaller and more concentrated than the markets for conventionally raised or grown ingredients. Any increase in the prices of the ingredients most critical to our menu, such as chicken, beef, dairy (for cheese, sour cream and queso), avocados, tomatoes and pork, would have a particularly adverse effect on our operating results. If the cost of one or more ingredients significantly increases, we may choose to temporarily suspend serving menu items that use those ingredients, such as guacamole or one of our proteins, rather than pay the increased cost. Any such changes to our available menu may negatively impact our restaurant traffic and could adversely impact our sales and brand.
Shortages or interruptions in the supply of ingredients could adversely affect our operating results.
Our business is dependent on frequent and consistent deliveries of ingredients that comply with our Food with Integrity specifications, such as dairy (for cheese, sour cream and queso) and chicken that meets our Responsibly Raised requirements. We may experience shortages, delays or interruptions in the supply of ingredients and other supplies to our restaurants due to higher or more lucrative demand from other sources; inclement weather or natural disasters; animal disease outbreaks (such as avian flu); social or labor unrest; shortages of agricultural workers (including due to changes in immigration laws); operational disruptions at our suppliers, distributors or transportation providers (including due to cyberattacks, malware or ransomware); financial distress or insolvency of suppliers or distributors, or the inability of suppliers or distributors to manage adverse business conditions; or other conditions beyond our control. Ongoing global conflicts have disrupted and could continue to disrupt some shipping routes, which could result in shortages or delays of certain ingredients and packaging. In addition, we have a single or a limited number of suppliers for some of our ingredients, including lemon and lime juice, tomatoes and adobo. Although we believe we have potential alternative suppliers and sufficient reserves of ingredients, shortages or interruptions in our supply of ingredients could adversely affect our financial results.
If our supply chain capacity does not expand to match our new restaurant growth, our long-term growth goals could be impaired or delayed.
We have set aggressive goals for the number of new restaurants we plan to open over the next few years. Even in the absence of extraordinary disruptions, we may not be able to increase the capacity of our supply chain to keep pace with our growth and fully meet our future business needs. We have experienced and may in the future experience limited available supplies of Responsibly Raised proteins and ingredients that meet our Food with Integrity specifications. In addition, we rely on independent third-party distributors to maintain an inventory of our ingredients and supplies, and deliver them to our restaurants on a timely, as needed basis. There can be no assurance that our suppliers or distributors will be able to accommodate our planned growth or continue to supply required ingredients at preferential prices or at all. An inability of our suppliers to accommodate our growth in a timely or cost-effective manner could impair our growth and have an adverse effect on our business, financial condition, results of operations, and prospects.
Legal and Regulatory Risks
We could be party to litigation or other legal proceedings that could adversely affect our business, results of operations and reputation.
We have been and will continue to be subject to litigation and other legal proceedings that may adversely affect our business, including claims brought by employees, guests, government agencies, suppliers, distributors, shareholders, job applicants or others. These proceedings may be in the form of private actions, administrative proceedings, government enforcement or regulatory actions and litigation on a class or collective basis on behalf of what can be a large group of potential claimants. These legal proceedings have involved, and in the future may involve, allegations of illegal, unfair or inconsistent employment practices, including those governing wage and hour, employment of minors, discrimination, harassment, wrongful termination, and vacation and family leave laws; food safety issues including food-borne illness, food contamination and adverse health effects from consumption of our food products; data security or privacy breaches; discrimination against guests or job applicants; personal injury in our restaurants; marketing and advertising claims, including claims that our Food with Integrity, marketing or sustainability claims are misleading or inaccurate; infringement of patent, copyright or other intellectual property rights; violation of the federal securities laws; workers’ compensation; or other concerns. We are party to a number of pending lawsuits and governmental audits alleging violations of federal and state employment laws, including wage and hour claims, and we could be involved in similar or even more significant litigation and legal proceedings in the future. Even if the allegations against us are unfounded or we ultimately are held not liable, the costs to defend ourselves may be significant and the proceedings may divert management's attention away from operating our business, all of which could negatively impact our financial condition and results of operations. A judgment significantly in excess of any applicable insurance coverage or third-party indemnity could materially adversely affect our financial condition or results of operations. In addition, adverse publicity resulting from claims may damage our reputation.
We are subject to extensive laws, government regulation, and other legal requirements and our failure to comply with existing or new laws and regulations could adversely affect our operational efficiencies, ability to attract and retain talent and results of operations.
Our business is subject to extensive federal, state, local and international laws and regulations, including those relating to:
•preparation, sale and labeling of food, including regulations of the Food and Drug Administration, which oversees the safety of the entire food system and covers inspections and mandatory food recalls, menu labeling and nutritional content;
•employment practices and working conditions, including minimum wage rates, wage and hour practices, meal and rest breaks, fair workweek/secure scheduling and “just cause” legislation, employment of minors, discrimination, harassment, classification of employees, paid and family leave, workplace safety, immigration and overtime among others;
•privacy and data security (including regulations governing the protection of personal information, advertising and marketing, access by children, biometrics, surveillance, artificial intelligence, health-related information and financial information), such as California Privacy Rights Act and CCPA in California and privacy-related legislation in a growing number of other states, and international laws such as GDPR in the European Union and Personal Information Protection and Electronic Documents Act in Canada;
•health, sanitation, safety and fire standards and the sale of alcoholic beverages;
•building and zoning requirements, including state and local licensing and regulation governing the design and operation of facilities and land use;
•claims made in marketing and advertising, including regarding nutritional information and sustainability impacts;
•public accommodations and safety conditions, including the Americans with Disabilities Act and similar state laws that give civil rights protections to individuals with disabilities in the context of employment, public accommodations, online resources and other areas;
•environmental matters, such as emissions and air quality; water consumption; the discharge, storage, handling, release and disposal of hazardous or toxic substances; local ordinances restricting the types of packaging we can use in our restaurants; and claims we make about our sustainability practices and achievements;
•new or increased tariffs, trade sanctions or taxes; and
•public company compliance, disclosure and governance matters, including accounting and tax regulations, SEC and NYSE disclosure requirements.
Compliance with these laws and regulations, and future new laws or changes in these laws or regulations that impose additional requirements, can be costly. If the Food and Drug Administration or other government agency adopts new laws and regulations in response to real or perceived emerging food safety, such as concerns over phthalates, PFAS, microplastics or heavy metals in the U.S. food supply, it could impose new processes that disrupt our suppliers’ operations, increase costs or both. Any failure or perceived failure to comply with applicable laws or regulations could result in, among other things, revocation of required licenses, administrative enforcement actions, fines and civil and criminal liability.
Risks Related to Our Growth and Business Strategy
If we are unable to meet our new restaurant opening goals, or maintain the attractiveness of our existing restaurants, our profitability could suffer.
Our growth depends on our ability to open new restaurants at an aggressive rate and operate them profitably as soon as possible. The cost of opening new restaurants has continued to increase due to construction labor inflation and increased costs of materials and equipment. In addition, we incur substantial startup expenses each time we open a new restaurant, and it can take up to 36 months to ramp up the sales and profitability of a new restaurant, during which time costs may be higher as we train new employees and build up a guest base. If we are unable to build the guest base that we expect or fail to overcome the higher startup expenses associated with new restaurants, our new restaurants may not be as profitable as our existing restaurants. In addition, the opening of new stores may negatively impact the profitability of existing stores that are located nearby.
Our ability to open and profitably operate new restaurants also is subject to various risks, such as the identification and availability of desirable locations; the negotiation of acceptable lease terms; the need to obtain all required governmental permits (including zoning approvals and liquor licenses) and comply with other regulatory requirements; the availability of capable contractors and subcontractors; increases in the cost and decreases in the availability of labor and building material; changes in weather, natural disasters, pandemics or other acts of God that could delay construction and adversely affect guest traffic; our ability to hire and train qualified management and restaurant employees; and general economic and business conditions. At each potential location, we compete with other restaurants and retail businesses for desirable development sites, construction contractors, management personnel, hourly employees and other resources. If we are unable to successfully manage these risks, we could face increased costs and lower than anticipated sales and earnings in future periods. Our timeline for completing construction also has gotten longer, due to landlord reluctance to commit to building in light of fluctuating interest rates, tight money supply and general economic conditions, and due to backlogs and long wait times for us to obtain required permits and utility hookups.
In addition, we need to maintain the attractiveness of our existing restaurants through remodels, upgrades and regular upkeep. If the costs associated with remodels, upgrades or regular upkeep are higher than anticipated, restaurants are closed for remodeling for longer periods than planned or remodeled restaurants do not perform as expected, which could have a negative effect on our operating results, and we may not realize our projected desired return on investment.
Our failure to effectively manage and support our growth could have a negative adverse effect on our business and financial results.
As of December 31, 2024, we owned and operated over 3,700 Chipotle restaurants and we plan to open a significant number of new restaurants in the next several years, working towards our long-term goal of 7,000 restaurants in North America. Our existing restaurant management systems, back-office technology systems and processes, financial and management controls, information systems and staffing may not be adequate to support our growing business. To effectively manage a larger number of restaurants, we may need to upgrade and expand our infrastructure and information systems, automate more processes that currently are manual or require manual intervention and hire, train and retrain restaurant employees and corporate support staff, all of which may result in increased costs and at least temporary inefficiencies. We also believe our culture is an important contributor to our success, and as we continue to grow it may be increasingly difficult to imbed and maintain our culture across the company. Our failure to sufficiently invest in our infrastructure and information systems and maintain our strong staffing and culture could harm our brand and operating results.
If we partner with third parties or acquire new businesses that do not align with our core values or that do not fulfill their contractual responsibilities and commitments, our brand reputation and international growth plans could suffer.
Our global growth strategy includes expanding our existing restaurant footprint and introducing Chipotle in new international jurisdictions in which we currently do not operate. The success of our strategy will depend on our identifying and partnering with new business partners, including licensees, joint venture partners, suppliers and distributors, and may include identifying suitable acquisition targets in these new jurisdictions that align with our core values. In 2024, the first licensed Chipotle restaurants opened in Kuwait and Dubai in partnership with international franchise retail operator Alshaya Group, and there are plans to open more licensed restaurants in other areas in the Middle East. We believe guests expect the same high quality food and excellent customer service at restaurants operated by licensees and joint venture partners as they receive in Chipotle-owned and operated restaurants. We provide extensive training to our business partners and we require compliance with specific food quality and safety standards and guest service levels in our agreements with business partners; however, we do not have direct control over the restaurants operated by third-party partners, and the quality and service in those restaurants may be less than the quality and service of Chipotle-operated restaurants. Failure of our business partners to adhere to our high food quality and operating standards, comply with applicable law, adhere to high ethical standards, and create a culture of respect in their restaurants could damage our brand reputation, domestically and internationally, and impair our international expansion plans. New partnerships and/or acquisitions also may divert management’s attention from other initiatives and/or day-to-day operations, which could adversely affect our business and results of operations.
The market price of our common stock may be more volatile than the market price of our peers.
We believe the market price of our common stock generally has traded at a higher price-earnings ratio than stocks of most of our peer companies as well as the overall market, which typically has reflected market expectations for higher future operating results. At any given point in time, our price-earnings ratio may trade at more than twice the price-earnings ratio of the S&P 500. Also, the trading market for our common stock has been volatile at times, including because of adverse publicity events. As a result, if we fail to meet market expectations for our operating results in the future, any resulting decline in the price of our common stock could be significant.
Risks Related to Sustainability Factors
We are subject to evolving public disclosure requirements and expectations, including with respect to sustainability matters, that could expose us to numerous risks and could adversely affect our reputation and results of operations.
We are subject to evolving disclosure obligations promulgated by governmental and regulatory organizations relating to sustainability factors that impact our business. These disclosure obligations are complex and not always consistent, making compliance difficult and uncertain. In addition, investors, guests and other stakeholders increasingly are focusing on sustainability matters and related disclosures. We have incurred and expect to continue to incur increased expenses and management time and attention to comply with these disclosure obligations and stakeholder expectations. For example, measuring Scope 1, 2 and 3 greenhouse gas emissions relating to our business, developing reduction plans and initiatives, and creating and disclosing achievable reduction goals can be costly, difficult and time consuming and is subject to evolving reporting standards, including California’s Climate Corporate Data Accountability Act, California’s Greenhouse Gases: Climate-Related Financial Risk Bill and similar proposals by other national, local and international regulatory agencies. We may also communicate certain initiatives, goals and strategies regarding environmental sustainability and human capital management related matters, such as workforce metrics, responsible sourcing and social investments in our SEC filings or in other public disclosures. We previously announced that we had set science-based targets validated by the Science Based Targets Initiative to reduce absolute Scope 1, 2 and 3 greenhouse gas emissions 50% by 2030 from a 2019 base year, and achievement of this goal is subject to risks and uncertainties, many of which are outside of our control. Achievement of this goal may prove to be more difficult and costly than we anticipate.
In addition, statements about our sustainability-related initiatives and goals, and progress toward those goals, may be based on standards for measuring progress that are still developing, internal controls and processes that continue to evolve, and assumptions that are subject to change in the future. If we are unable to meet our sustainability-related goals or evolving stakeholder or industry expectations and standards, or if we are perceived to have not responded appropriately to the growing concern for sustainability issues, investors, guests and other stakeholders may choose to patronize a competitor that they perceive to be more responsive, and our reputation, business or financial condition may be adversely affected. If our sustainability-related data, processes and reporting are incomplete or inaccurate, or if we fail to achieve progress with respect to our sustainability goals on a timely basis, or at all, our reputation, business, financial performance and growth could be adversely affected.
In addition, we could be criticized by anti-ESG stakeholders for the scope or nature of our sustainability initiatives or goals or for any revisions to these goals. We could also be subjected to negative responses by governmental actors (such as anti-ESG legislation or retaliatory legislative treatment) or consumers (such as boycotts or negative publicity campaigns) that could adversely affect our reputation, business, financial performance and growth.
Climate change and volatile adverse weather conditions could adversely affect our restaurant sales or results of operations.
There is growing concern that climate change and global warming has caused and may continue to cause more severe, volatile weather or extended droughts, which could increase the frequency and duration of weather impacts on our operations. Adverse weather conditions have in the past and may again impact guest traffic at our restaurants and, in more severe cases such as hurricanes, tornadoes, wildfires or other natural disasters, cause temporary restaurant closures, all of which negatively impact our restaurant sales. In addition, our supply chain is subject to increased costs caused by the effects of climate change and diminished energy and water resources. Increasing weather volatility and changes in global weather patterns could reduce crop size and crop quality, or destroy crops altogether, which could result in decreased availability or higher pricing for our produce and other ingredients. We may be forced to source ingredients from new geographic regions, which could impact quality and taste, and increase our costs. These factors are beyond our control and may be unpredictable. Climate change and government regulation relating to climate change mitigation also could result in construction delays for new restaurants and interruptions to the availability or increases in the cost of utilities. The ongoing and long-term costs of these impacts related to climate change and other sustainability-related issues could have a material adverse effect on our business and financial condition if we are not able to mitigate them.
General Risk Factors
Economic and business factors that are largely beyond our control may adversely affect consumer behavior and our financial results.
Restaurant dining generally is dependent upon consumer discretionary spending, which may be affected by general economic conditions that are beyond our control. Increasing or prolonged high inflation, international, domestic and regional economic conditions, consumer income levels, financial market volatility, a slow or stagnant pace of economic growth, mass layoffs, rising energy costs, rising interest rates, social unrest, military conflicts and governmental, political and budget concerns or divisions may have a negative effect on consumer confidence and discretionary spending. Persistent inflation and concern about a prolonged economic downturn may lead consumers to decrease their discretionary spending. A significant decrease in guest traffic or average transaction size would negatively impact our financial performance. The actual or perceived threat of a pandemic or communicable disease, terrorist attack, mass shooting, heightened security requirements, including cybersecurity, or a failure to protect information systems for critical infrastructure, such as the electrical grid and telecommunications systems, could harm our operations, the economy or consumer confidence generally. Any of the above factors or other unfavorable changes in business and economic conditions affecting our guests could increase our costs, reduce traffic in our restaurants or limit our ability to increase pricing, any of which could lower our profit margins and have a material adverse effect on our sales, financial condition and results of operations. These factors also could cause us to, among other things, reduce the number and frequency of new restaurant openings, close restaurants or delay remodeling of our existing restaurant locations. Further, poor economic conditions may force nearby businesses to shut down, which could reduce traffic to our restaurants or cause our restaurant locations to be less attractive.
In addition, we purchase ingredients, packaging and equipment from both U.S. and international suppliers and we may need to increase our menu prices in response to increased inflation, higher taxes, new tariffs on imported goods, wage increases due to a tighter job market and other macro-economic factors. Higher menu prices or the perceived value of our meals relative to competitors may lead consumers to reduce their spending in our restaurants or switch to competitors’ value or lower-priced meals. If competitive or other factors prevent us from offsetting these higher costs through menu price increases, our profitability may decline.
Our quarterly financial results may fluctuate significantly, including due to factors that are not in our control.
Our quarterly financial results may fluctuate significantly and could fail to meet investors’ expectations for various reasons, including:
•negative publicity about the safety of our food, employment-related issues, guest safety, litigation or other issues involving our restaurants;
•fluctuations in supply costs, particularly for our most significant ingredients, and our inability to offset the higher cost with price increases, without adversely impacting guest traffic;
•our inability to purchase sufficient quantities of our key ingredients and equipment as our restaurant count grows;
•labor availability and wages of restaurant management and employees;
•increases in marketing or promotional expenses;
•the timing of new restaurant openings and related revenues and expenses, and the operating costs at newly opened restaurants;
•the impact of inclement weather and natural disasters, such as freezes and droughts, which could decrease guest traffic and increase the costs of ingredients;
•the amount and timing of stock-based compensation;
•litigation, settlement costs and related legal expenses;
•taxes, new or increased tariffs or trade sanctions, asset impairment charges and non-operating costs; and
•variations in general economic conditions, including the impact of rising inflation and the impact of rising interest rates on consumer demand trends.
As a result of any of these factors, results for any one quarter are not necessarily indicative of results to be expected for any other quarter or for any year. Average restaurant sales or comparable restaurant sales in any future period may decrease.
ITEM 1B. UNRESOLVED STAFF COMMENTS
None.
ITEM 1C. CYBERSECURITY
Cybersecurity Risk Management and Strategy
As a global company, we are regularly subject to cyberattacks and other cybersecurity incidents. In response, we have implemented cybersecurity processes, technologies, and controls to aid in our efforts to assess, identify, and manage cybersecurity risks. Our enterprise risk management framework considers cybersecurity risk alongside other company risks as part of our overall risk assessment process. Our enterprise risk management team collaborates with our Information Security function, led by our Chief Information Security Officer (“CISO”) and our Chief Customer and Technology Officer (“CCTO”), to gather insights for assessing, identifying and managing cybersecurity threat risks, their severity, and potential mitigations. We also are a member of an industry cybersecurity intelligence and risk sharing organization to stay abreast of changes in the cybersecurity environment.
We assess Chipotle’s Information Security program using an industry cybersecurity framework from the National Institute of Standards and Technology. This program includes policies, processes and procedures that help assess and identify our cybersecurity risks and inform how security measures and controls are developed, implemented and maintained. The risk assessment along with risk-based analysis and judgment are used to select security controls to address risks. During this process, the following factors, among others, are considered: likelihood and severity of risk, impact on the Company and others if a risk materializes, feasibility and cost of controls and impact of controls on operations.
We maintain internal resources to perform penetration testing designed to simulate evolving tactics and techniques of real-world threat actors, engage with industry partners and law enforcement and intelligence communities and conduct tabletop exercises and periodic risk interviews across our business. We also engage an independent third party to periodically perform internal and external penetration testing of Chipotle's information security environment and engage other third parties to periodically conduct assessments of our cybersecurity capabilities. In addition, we continue to expand training and awareness practices to mitigate risk from human error, including mandatory computer-based training and internal communications for employees. Our employees undergo cybersecurity awareness training and regular phishing awareness campaigns that are based upon and designed to emulate real-world contemporary threats. We provide prompt feedback (and, if necessary, additional training or remedial action) based on the results of such exercises.
Our processes also address cybersecurity risks associated with our use of third-party service providers including suppliers, software and cloud-based service providers, as well as third-party security firms used in different capacities to provide or operate some of our cybersecurity controls and technology systems. We proactively evaluate the cybersecurity risk of a third party by utilizing a repository of risk assessments, external monitoring sources, threat intelligence and predictive analytics to better inform Chipotle during contracting and vendor selection processes. Additionally, when third party risks are identified, we require those third parties to agree by contract to implement appropriate security controls. Security issues are documented and tracked, and periodic monitoring of third parties is conducted in an effort to mitigate risk.
In addition to the processes, technologies, and controls that we have in place to reduce the likelihood of a material cybersecurity incident (or series of related cybersecurity incidents), Chipotle has a written incident response plan outlining how to address cybersecurity events that occur. The plan sets forth the steps for coordination among various corporate functions and governance groups and serves as a framework for the execution of responsibilities across businesses and operational roles. Our incident response plan is designed to help us coordinate actions to prepare for, detect, respond to and recover from cybersecurity incidents, and includes processes to triage, assess severity, escalate, contain, investigate, and remediate the incident, as well as to assess the need for disclosure, comply with applicable legal obligations and mitigate the impact to our brand and reputation and on impacted parties. We also maintain insurance coverage that, subject to its terms and conditions, is intended to help us cover certain costs associated with cybersecurity incidents and information system failures.
In addition to our cybersecurity incident response plan, we conduct tabletop exercises to enhance our incident response preparedness. We maintain business continuity and disaster recovery plans to prepare for and respond to the potential for a disruption in the technology we rely on.
Chipotle (or the third parties it relies on) may not be able to fully, continuously, or effectively implement security controls as intended. As described above, we utilize a risk-based approach and judgment to determine whether and how to implement certain security controls and it is possible that we may not implement the necessary controls if we are unable to recognize or underestimate a particular risk. In addition, security controls, no matter how well designed or implemented, may only mitigate and not fully eliminate cybersecurity risks. Cybersecurity events, when detected by security tools or third parties, may not always be identified immediately or addressed in the manner intended by our cybersecurity incident response plan.
Impact of cybersecurity risks on business strategy, results of operations or financial condition
Based on the information available as of the date of this Annual Report, we have no reason to believe any risks from cybersecurity threats, including as a result of any previous cybersecurity incidents, have materially affected or are reasonably likely to materially affect us, including our business strategy, results of operations or financial condition. For additional information, see “Risks Related to Cybersecurity, Data Privacy and IT Systems,” in Item 1A, “Risk Factors” in this Annual Report.
Cybersecurity Governance
Our cybersecurity risk management and strategy processes are led by our CISO and our CCTO. These individuals have collectively over 50 years of professional experience in various roles across multiple industries involving managing information security, developing cybersecurity strategy, implementing effective information and cybersecurity programs and managing multiple industry and regulatory compliance environments. Both individuals previously held positions similar to their current roles at other large publicly traded organizations.
Cybersecurity is an important part of our risk management processes and an area of focus for our Board of Directors (the “Board”) and management. Although cybersecurity risk oversight continues to remain a top priority for the Board, the Audit and Risk Committee of our Board has primary oversight responsibility for the Company’s cybersecurity and other technology risks. The Committee regularly reviews with and discusses cybersecurity, privacy and data security programs, the status of projects to strengthen internal cybersecurity, results from third-party assessments, and any significant cybersecurity incidents, including recent incidents at other companies and the emerging threat landscape with our CISO and CCTO. The Committee also reviews with management the implementation and effectiveness of the Company’s controls to monitor and mitigate cybersecurity risks. In addition, our Board receives an annual report and quarterly written updates regarding our cybersecurity program.
ITEM 2. PROPERTIES
As of December 31, 2024, Chipotle and our consolidated subsidiaries owned and operated 3,726 restaurants. Our main office is located at 610 Newport Center Drive, Suite 1100, Newport Beach, CA 92660 and our telephone number is (949) 524-4000. We lease our main office and substantially all of the properties on which we operate restaurants. We own 17 properties and operate restaurants on all of them. For additional information regarding the lease terms and provisions, see Note 1. “Description of Business and Summary of Significant Accounting Policies” and Note 9. “Leases” in our consolidated financial statements included in Item 8. “Financial Statements and Supplementary Data.” ITEM 3. LEGAL PROCEEDINGS
ITEM 4. MINE SAFETY DISCLOSURES
Not applicable.
PART II
ITEM 5. MARKET FOR REGISTRANT’S COMMON EQUITY, RELATED SHAREHOLDER MATTERS AND ISSUER PURCHASES OF EQUITY SECURITIES
Our common stock trades on the New York Stock Exchange under the symbol “CMG.”
As of January 31, 2025, there were approximately 2,394 shareholders of record. This does not include persons whose stock is in nominee or “street name” accounts through brokers.
Purchases of Equity Securities by the Issuer
The table below reflects shares of common stock we repurchased during the fourth quarter of 2024.
| | | | | | | | | | | | | | | | | | | | | | | | | | |
| Period | | Total Number of Shares Purchased | | Average Price Paid Per Share | | Total Number of Shares Purchased as Part of Publicly Announced Plans or Programs(1) | | Approximate Dollar Value of Shares that May Yet Be Purchased Under the Plans or Programs(2) |
| Purchased 10/1 through 10/31 | | 1,474,582 | | $ | 58.05 | | 1,474,582 | | $ | 973,992,478 |
| Purchased 11/1 through 11/30 | | 2,348,512 | | $ | 59.14 | | 2,348,512 | | $ | 835,097,636 |
| Purchased 12/1 through 12/31 | | 1,713,277 | | $ | 62.31 | | 1,713,277 | | $ | 1,028,341,738 |
| Total | | 5,536,371 | | $ | 59.83 | | 5,536,371 | | |
(1)Shares were repurchased pursuant to repurchase programs announced on July 24, 2024 and October 29, 2024.
(2)The December total includes an additional $300 million in authorized repurchases approved on December 17, 2024 and announced February 4, 2025. There is no expiration date for this program. The authorization to repurchase shares will end when we have repurchased the maximum amount of shares authorized, or we have determined to discontinue such repurchases.
Dividend Policy
We are not required to pay any dividends and have not declared or paid any cash dividends on our common stock. We intend to continue to retain earnings for use in the operation and expansion of our business and to repurchase shares of common stock (subject to market conditions), and therefore do not anticipate paying any cash dividends on our common stock in the foreseeable future.
COMPARISON OF CUMULATIVE TOTAL RETURN
The following graph compares the cumulative annual stockholders return on our common stock from December 31, 2019, through December 31, 2024, to that of the total return index for the S&P 500 and the S&P 500 Restaurants Index assuming an investment of $100 on December 31, 2019. In calculating total annual stockholder return, reinvestment of dividends, if any, is assumed. The indices are included for comparative purposes only. They do not necessarily reflect management’s opinion that such indices are an appropriate measure of the relative performance of our common stock. The values shown are neither indicative nor determinative of future performance. This graph is not “soliciting material,” is not deemed filed with the Securities and Exchange Commission and is not to be incorporated by reference in any of our filings under the Securities Act or the Exchange Act, whether made before or after the date hereof and irrespective of any general incorporation language in any such filing.
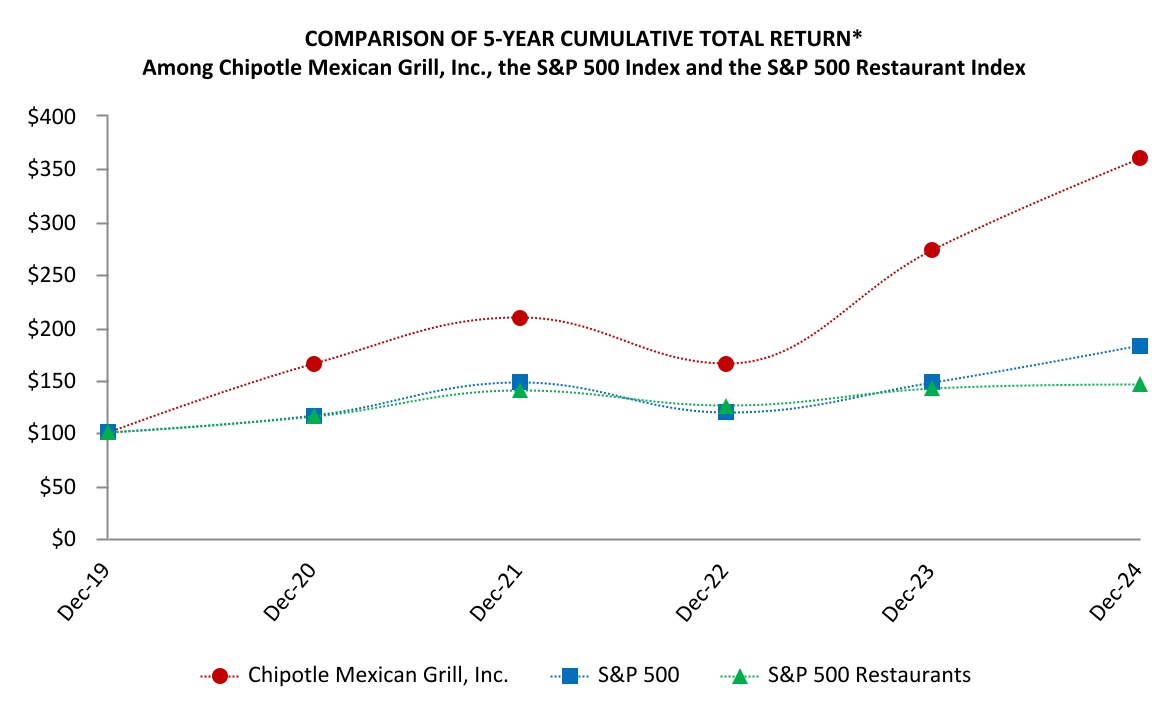
| | | | | | | | | | | | | | | | | | | | | | | | | | | | | | | | | | | |
| Company/Index | 2019 | | 2020 | | 2021 | | 2022 | | 2023 | | 2024 |
| Chipotle Mexican Grill, Inc. | $ | 100 | | $ | 166 | | $ | 209 | | $ | 166 | | $ | 273 | | $ | 360 |
| S&P 500 | 100 | | 116 | | 148 | | 119 | | 148 | | 182 |
| S&P 500 Restaurants | 100 | | 116 | | 140 | | 126 | | 142 | | 146 |
*$100 invested on December 31, 2019, in stock or index, including reinvestment of dividends.
Fiscal year ending December 31, 2024.
Source data: Bloomberg
ITEM 6. RESERVED
ITEM 7. MANAGEMENT’S DISCUSSION AND ANALYSIS OF FINANCIAL CONDITION AND RESULTS OF OPERATIONS
You should read the following discussion together with our consolidated financial statements and related notes included in Item 8. “Financial Statements and Supplementary Data.” This section of the Form 10-K generally discusses 2024 items and year-to-year comparisons of 2024 to 2023. Discussions of 2022 items and year-to-year comparisons of 2023 and 2022 that are not included in this Form 10-K can be found in “Management’s Discussion and Analysis of Financial Condition and Results of Operations” in Part II, Item 7 on our Annual Report on Form 10-K for the year ended December 31, 2023. The discussion contains forward-looking statements involving risks, uncertainties and assumptions that could cause our results to differ materially from expectations. See “Cautionary Note Regarding Forward-Looking Statements.” Factors that might cause such differences include those described in Item 1A. “Risk Factors”, 7A. "Quantitative and Qualitative Disclosure About Market Risk", and elsewhere in this report.
Overview
As of December 31, 2024, we owned 3,644 Chipotle restaurants throughout the United States, and 82 international Chipotle restaurants. Additionally, we had three international licensed restaurants. We manage our U.S. operations based on ten regions and aggregate our operations to one reportable segment.
Throughout “Management’s Discussion and Analysis of Financial Condition and Results of Operations” we commonly discuss the following key operating metrics which we believe will drive our financial results and long-term growth model. We believe these metrics are useful to investors because management uses these metrics to assess the growth of our business and the effectiveness of our marketing and operational strategies:
•Comparable restaurant sales
•Food, beverage, and packaging as a percentage of total revenue
•Labor as a percentage of total revenue
•Occupancy as a percentage of total revenue
•Other operating costs as a percentage of total revenue
•New restaurant openings
2024 Financial Highlights, year-over-year:
•Total revenue increased 14.6% to $11.3 billion
•Comparable restaurant sales increased 7.4%
•Diluted earnings per share was $1.11, a 24.7% increase from $0.89
Sales Trends. Comparable restaurant sales increased 7.4% for the year ended December 31, 2024. The increase is attributable to higher transactions of 5.3% and a 2.1% increase in average check. Comparable restaurant sales represent the change in period-over-period total revenue for restaurants in operation for at least 13 full calendar months. Digital sales represented 35.1% of total food and beverage revenue. For 2025, management is anticipating comparable restaurant sales growth in the low to mid-single digit range.
Restaurant Development. During the year ended December 31, 2024, we opened 304 restaurants, which included 257 restaurants with a Chipotlane. We expect to open approximately 315 to 345 company-owned restaurants in 2025. We expect that at least 80% of our new company-owned restaurants will include a Chipotlane.
Licensing. During the year ended December 31, 2024, three licensed restaurants were opened in the Middle East.
Cultivate Next Fund. Our Cultivate Next Fund is a venture formed to make early-stage investments into strategically aligned companies that further our purpose to Cultivate a Better World. The Fund is authorized to invest up to $100.0 million, which is financed almost entirely by Chipotle. As of December 31, 2024, we have made $63.0 million in investments through this Fund.
Restaurant Activity
The following table details company-owned restaurant unit data for the years indicated.
| | | | | | | | | | | |
| | Year ended December 31, |
| | 2024 | | 2023 |
| Beginning of period | 3,437 | | 3,187 |
| Chipotle openings | 304 | | 270 |
| Non-Chipotle openings | - | | 1 |
| Chipotle permanent closures | (7) | | (3) |
| Chipotle relocations | (8) | | (12) |
| Non-Chipotle permanent closures | - | | (6) |
| Total at end of period | 3,726 | | 3,437 |
The following table details licensed restaurant unit data for the years indicated.
| | | | | | | | | | | | | | | |
| | | Year ended December 31, |
| | | | | 2024 | | 2023 |
| Beginning of period | | | | | - | | | - | |
| Licensed restaurant openings | | | | | 3 | | | - | |
| Total at end of period | | | | | 3 | | | - | |
Results of Operations
Our results of operations as a percentage of total revenue and period-over-period change are discussed in the following section.
Revenue
| | | | | | | | | | | | | | | | | |
| | Year ended December 31, | | Percentage |
| | 2024 | | 2023 | | change |
| | (dollars in millions) | | |
| Food and beverage revenue | $ | 11,247.4 | | $ | 9,804.1 | | 14.7% |
| Delivery service revenue | 66.5 | | 67.5 | | (1.6 | %) |
| Total revenue | $ | 11,313.9 | | $ | 9,871.6 | | 14.6% |
Average restaurant sales (1) | $ | 3.213 | | $ | 3.018 | | 6.5% |
| Comparable restaurant sales increase | 7.4% | | 7.9% | | |
| Transactions | 5.3% | | 5.0% | | |
| Average check | 2.1% | | 2.9% | | |
| Menu price increase | 2.9% | | 5.2% | | |
| Check mix | (0.8 | %) | | (2.3 | %) | | |
(1)Average restaurant sales refers to the average trailing 12-month food and beverage revenue for restaurants in operation for at least 12 full calendar months.
The following is a summary of the change in restaurant sales for the period indicated:
| | | | | | | |
| | | | Year ended |
| | | | (dollars in millions) |
| For the period ended December 31, 2023 | | | $ | 9,871.6 | |
| Change from: | | | |
| Comparable restaurant sales | | | 695.4 | |
| Restaurants not yet in comparable base opened in 2024 | | | 290.4 | |
| Restaurants not yet in comparable base opened in 2023 | | | 453.7 | |
| Other | | | 2.8 | |
| For the period ended December 31, 2024 | | | $ | 11,313.9 | |
Food, Beverage and Packaging Costs
| | | | | | | | | | | | | | | | | |
| | Year ended December 31, | | Percentage |
| | 2024 | | 2023 | | change |
| | (dollars in millions) | | |
| Food, beverage and packaging | $ | 3,374.5 | | $ | 2,912.6 | | 15.9% |
| As a percentage of total revenue | 29.8% | | 29.5% | | 0.3 | % |
Food, beverage and packaging costs increased 0.3% as a percentage of total revenue for the year ended December 31, 2024 compared to the year ended December 31, 2023. The increase was due to higher usage of ingredients as we focused on ensuring consistent and generous portions, inflation across several ingredient costs, primarily avocados, and a protein mix shift from the Smoked Brisket limited time offering and a Braised Beef Barbacoa marketing initiative. This increase was partially offset by a 1.0% benefit from menu price increases.
Labor Costs
| | | | | | | | | | | | | | | | | |
| | Year ended December 31, | | Percentage |
| | 2024 | | 2023 | | change |
| | (dollars in millions) | | |
| Labor costs | $ | 2,789.8 | | $ | 2,441.0 | | 14.3% |
| As a percentage of total revenue | 24.7% | | 24.7% | | - | % |
Labor costs remained flat as a percentage of total revenue for the year ended December 31, 2024 compared to the year ended December 31, 2023. The 1.1% benefit from sales leverage was mostly offset by 0.9% due to restaurant wage inflation, of which 0.4% was due to minimum wage increases for our restaurants in California.
Occupancy Costs
| | | | | | | | | | | | | | | | | |
| | Year ended December 31, | | Percentage |
| | 2024 | | 2023 | | change |
| | (dollars in millions) | | |
| Occupancy costs | $ | 563.4 | | $ | 503.3 | | 11.9% |
| As a percentage of total revenue | 5.0% | | 5.1% | | (0.1 | %) |
Occupancy costs decreased 0.1% as a percentage of total revenue for the year ended December 31, 2024 compared to the year ended December 31, 2023, primarily due to 0.3% of sales leverage partially offset by 0.2% of increased occupancy expense, of which 0.1% was associated with existing restaurants and 0.1% was associated with new restaurants.
Other Operating Costs
| | | | | | | | | | | | | | | | | |
| | Year ended December 31, | | Percentage |
| | 2024 | | 2023 | | change |
| | (dollars in millions) | | |
| Other operating costs | $ | 1,568.5 | | $ | 1,428.7 | | 9.8% |
| As a percentage of total revenue | 13.9% | | 14.5% | | (0.6 | %) |
Other operating costs decreased 0.6% as a percentage of total revenue for the year ended December 31, 2024 compared to the year ended December 31, 2023, primarily due to 0.5% of sales leverage and 0.2% of lower delivery expenses.
General and Administrative Expenses
| | | | | | | | | | | | | | | | | |
| | Year ended December 31, | | Percentage |
| | 2024 | | 2023 | | change |
| | (dollars in millions) | | |
| General and administrative expenses | $ | 697.5 | | $ | 633.6 | | 10.1% |
| As a percentage of total revenue | 6.2% | | 6.4% | | (0.2 | %) |
The following is a summary of the change in general and administrative expenses for the period indicated:
| | | | | | | |
| | | Year ended |
| | | (dollars in millions) |
| For the period ended December 31, 2023 | | | $ | 633.6 | |
| Change from: | | | |
| Wages | | | 20.5 | |
| Conferences, primarily the biennial All Managers’ Conference | | | 17.7 | |
| Legal contingencies | | | 16.6 | |
| Outside services related to corporate initiatives | | | 8.1 | |
| Stock-based compensation | | | 5.3 | |
| | | |
| | | |
| Restructuring costs | | | (6.5) | |
| Other | | | 2.2 | |
| For the period ended December 31, 2024 | | | $ | 697.5 | |
Impairment, Closure Costs, and Asset Disposals
| | | | | | | | | | | | | | | | | |
| | Year ended December 31, | | Percentage |
| | 2024 | | 2023 | | change |
| | (dollars in millions) | | |
| Impairment, closure costs, and asset disposals | $ | 26.9 | | $ | 38.4 | | (29.8%) |
| As a percentage of total revenue | 0.2% | | 0.4% | | (0.2%) |
Impairment, closure costs, and asset disposals decreased in dollar terms for the year ended December 31, 2024 compared to the year ended December 31, 2023, primarily due to a gain on the sale of corporate equipment and higher charges related to the replacement of certain leasehold improvements in the comparable period.
Interest and Other Income, Net
| | | | | | | | | | | | | | | | | |
| | Year ended December 31, | | Percentage |
| | 2024 | | 2023 | | change |
| | (dollars in millions) | | |
| Interest and other income, net | $ | 93.9 | | $ | 62.7 | | 49.8% |
| As a percentage of total revenue | 0.8% | | 0.6% | | 0.2% |
Interest and other income, net increased in dollar terms for the year ended December 31, 2024 compared to the year ended December 31, 2023, primarily due to increased interest income from higher investment balances in U.S. Treasury securities, money market funds and time deposits.
Provision for Income Taxes
| | | | | | | | | | | | | | | | | |
| | Year ended December 31, | | Percentage |
| | 2024 | | 2023 | | change |
| | (dollars in millions) | | |
| Provision for income taxes | $ | 476.1 | | | $ | 391.8 | | | 21.5% |
| Effective income tax rate | 23.7% | | 24.2% | | (0.5%) |
The effective income tax rate decreased 0.5% for the year ended December 31, 2024 compared to the year ended December 31, 2023, primarily due to lower nondeductible expenses of 0.6% and income tax reserves of 0.4%. These decreases were partially offset by a 0.6% reduction in tax benefits related to option exercise and equity vesting.
Quarterly Financial Data/Seasonality
Seasonal factors cause our profitability to fluctuate from quarter to quarter. Historically, our average daily restaurant sales and net income are lower in the first and fourth quarters due, in part, to the holiday season and because fewer people eat out during periods of inclement weather (the winter months) than during periods of mild or warm weather (the spring, summer and fall months). Other factors also have a seasonal effect on our results. For example, restaurants located near colleges and universities generally do more business during the academic year. Seasonal factors, however, might be moderated or outweighed by other factors that may influence our quarterly results, such as unexpected publicity impacting our business in a positive or negative way, disease outbreak, epidemic or endemic, the impact of inflation on consumer spending, fluctuations in food or packaging costs, or the timing of menu price increases or promotional activities and other marketing initiatives. The number of trading days in a quarter can also affect our results, although, on an overall annual basis, changes in trading days do not have a significant impact.
Our quarterly results are also affected by other factors such as the amount and timing of non-cash stock-based compensation expense and related tax rate impacts, litigation, settlement costs and related legal expenses, impairment charges and non-operating costs, timing of marketing or promotional expenses, the number and timing of new restaurants opened in a quarter, and closure of restaurants. New restaurants typically have higher operating costs following opening because of the expenses associated with their opening and operating inefficiencies in the months immediately following opening. Accordingly, results for a particular quarter are not necessarily indicative of results to be expected for any other quarter or for any year.
Liquidity and Capital Resources
Cash and Investments
As of December 31, 2024, we had a cash and marketable investments balance of $2.2 billion, non-marketable investments of $85.2 million, and $29.8 million of restricted cash. After funding the current operations in our restaurants and support centers, the first planned use of our cash flow from operations is to provide capital for the continued investment in new restaurant construction. In addition to continuing to invest in our restaurant expansion, we expect to utilize cash flow from operations to: repurchase additional shares of our common stock subject to market conditions; invest in, maintain, and refurbish our existing restaurants; and for general corporate purposes. As of December 31, 2024, $1.0 billion remained available for repurchases of shares of our common stock, which includes the $300.0 million additional authorization approved by our Board of Directors on December 17, 2024. Under the remaining repurchase authorizations, shares may be purchased from time to time in open market transactions, subject to market conditions.
Borrowing Capacity
As of December 31, 2024, we had $500.0 million of undrawn borrowing capacity under a line of credit facility.
Use of Cash
We believe that cash from operations, together with our cash and investment balances, will be sufficient to meet ongoing capital expenditures, working capital requirements and other cash needs for the foreseeable future. Assuming no significant declines in comparable restaurant sales, we expect we will generate positive cash flow for the foreseeable future.
We have not required significant working capital because guests generally pay using cash or credit and debit cards and because our operations do not require significant receivables, nor do they require significant inventories due, in part, to our use of various fresh ingredients. In addition, we generally have the right to pay for the purchase of food, beverages and supplies sometime after the receipt of those items, generally within ten days, thereby reducing the need for incremental working capital to support our growth.
Our total capital expenditures for 2024 were $593.6 million. In 2024, we spent on average about $1.5 million in development and construction costs per new restaurant, or about $1.3 million net of landlord reimbursements of $0.2 million. In 2025, we expect to incur about $683.7 million in total capital expenditures. We expect approximately $502.7 million in capital expenditures related to our construction of new restaurants, before any reductions for landlord reimbursements. We expect the average investment cost for new restaurants opening in 2025 will be slightly higher than the average investment costs for those opened in 2024. We expect approximately $149.0 million in capital expenditures related to investments in existing restaurants including remodeling and similar improvements, new equipment and hardware, and technology to optimize efficiencies. Finally, we expect a portion of our incurred capital expenditures to be for additional corporate initiatives including investments in technology to boost innovation, enhance the guest experience, and improve operations.
The following table summarizes current and long-term material cash requirements as of December 31, 2024, which we expect to fund primarily with operating cash flows:
| | | | | | | | | | | | | | | | | | | | | | | | | | | | | |
| Payments Due by Fiscal Year |
| Total | | 2025 | | 2026-2027 | | 2028-2029 | | Thereafter |
| (dollars in millions) |
Operating leases(1) | $ | 7,204 | | | $ | 502 | | | $ | 1,089 | | | $ | 1,036 | | | $ | 4,577 | |
Purchase obligations(2) | 2,289 | | | 1,161 | | | 766 | | | 362 | | | - | |
| Total | $ | 9,493 | | | $ | 1,663 | | | $ | 1,855 | | | $ | 1,398 | | | $ | 4,577 | |
(1)See Note 9. “Leases” of our consolidated financial statements included in Item 8. “Financial Statements and Supplementary Data.” This includes commitments related to reasonably certain renewal periods for leases that have commenced and includes legally binding lease payments for leases signed but not yet commenced. (2)Purchase obligations include agreements to purchase goods or services that are enforceable and legally binding on us and that specify all significant terms. We have excluded agreements that are cancellable without penalty. The majority of our purchase obligations relate to food, beverage and packaging, capital projects, information technology, marketing initiatives and corporate sponsorships, and other miscellaneous items.
The above table does not include income tax liabilities for uncertain tax positions for which we are not able to make a reasonably reliable estimate of the amount and period of related future payments. Additionally, we have excluded our estimated loss contingencies, due to uncertainty regarding the timing and amount of payment. See Note 11. “Commitments and Contingencies” of our consolidated financial statements included in Item 8. “Financial Statements and Supplementary Data.” Cash Flows
Cash provided by operating activities was $2.1 billion for the year ended December 31, 2024, compared to $1.8 billion for the year ended December 31, 2023. The increase was primarily due to higher net earnings and, to a lesser extent, net cash changes in operating assets and liabilities.
Cash used in investing activities was $837.5 million for the year ended December 31, 2024, compared to $946.0 million for the year ended December 31, 2023. The change was primarily associated with a $121.2 million decrease in investment purchases net of investment maturities. This was partially offset by increased capital expenditures of $32.9 million primarily related to costs associated with new restaurant development.
Cash used in financing activities was $1.1 billion for the year ended December 31, 2024, compared to $660.7 million for the year ended December 31, 2023. The change was primarily due to increased repurchases of common stock of $409.2 million.
Critical Accounting Estimates
We describe our significant accounting policies in Note 1. “Description of Business and Summary of Significant Accounting Policies” of our consolidated financial statements included in Item 8. “Financial Statements and Supplementary Data.” Critical accounting estimates are those that we believe are both significant and that require us to make difficult, subjective or complex judgments, often because we need to estimate the effect of inherently uncertain matters. We base our estimates and judgments on historical experiences and various other factors that we believe to be appropriate under the circumstances. Actual results may differ from these estimates, and we might obtain different estimates if we used different assumptions or factors. Leases
The majority of our operating leases consist of restaurant locations and office space. We determine if a contract contains a lease at inception. Our leases generally have remaining terms of 1-20 years and most include options to extend the leases for additional 5-year periods. Generally, the lease term is the minimum of the noncancelable period of the lease or the lease term inclusive of reasonably certain renewal periods up to a term of 20 years. If the estimate of our reasonably certain lease term was changed, our depreciation and rent expense could differ materially.
Operating lease assets and liabilities are recognized at the lease commencement date, which is the date we control the use of the property. Operating lease liabilities represent the present value of lease payments not yet paid. We made the policy election to combine lease and non-lease components. We consider fixed common area maintenance (“CAM”) part of our fixed future lease payments; therefore, fixed CAM is also included in our operating lease liability. Operating lease assets represent our right to use an underlying asset and are based upon the operating lease liabilities adjusted for prepayments, initial direct costs, lease incentives, and impairment of operating lease assets. To determine the present value of lease payments not yet paid, we estimate incremental borrowing rates corresponding to the reasonably certain lease term. As we have no outstanding debt nor committed credit facilities, secured or otherwise, we estimate this rate based on prevailing financial market conditions, comparable company and credit analysis, and management judgment. If the estimate of our incremental borrowing rate was changed, our operating lease assets and liabilities could differ materially.
Impairment of Long-Lived Assets
Long-lived assets are reviewed for impairment whenever events or changes in circumstances indicate that the carrying amount of an asset may not be recoverable. Long-lived assets are grouped at the lowest level for which identifiable cash flows are largely independent of the cash flows of other assets and liabilities. For restaurant assets, we test impairment at the individual restaurant asset group level, which includes leasehold improvements, property and equipment and operating lease assets.
The fair value measurement for asset impairment is generally based on Level 3 inputs. We first compare the carrying value of the asset (or asset group, referred interchangeably throughout as asset) to the asset’s estimated future undiscounted cash flows. If the estimated undiscounted future cash flows are less than the carrying value of the asset, we determine if we have an impairment loss by comparing the carrying value of the asset to the asset's estimated fair value. The estimated fair value of the asset is generally determined using the income approach to measure the fair value, which is based on the present value of estimated future cash flows. Key inputs to the income approach for restaurant assets include the discount rate, projected revenue and expenses, and sublease income if we are closing the restaurant. In certain cases, management uses other market information, when available, to estimate the fair value of an asset. The impairment charges represent the excess of each asset’s carrying amount over its estimated fair value and are allocated among the long-lived asset or assets of the group.
Our estimates of future revenues and expenses are highly subjective judgments based on internal projections and knowledge of our operations, historical performance, and trends in sales and restaurant operating costs, and can be significantly impacted by changes in our business or economic conditions. The determination of asset fair value is also subject to significant judgment and utilizes valuation techniques including discounting estimated future cash flows and market-based analyses to determine fair value. If our estimates or underlying assumptions, including discount rate and sublease income change in the future, our operating results may be materially impacted.
Stock-based Compensation
We recognize compensation expense for equity awards over the requisite service period based on the award’s fair value. Under our stock incentive plans, we issue stock-only stock appreciation rights ("SOSARs"), restricted stock units ("RSUs"), and performance stock units ("PSUs"). We use the Black-Scholes valuation model to determine the fair value of our SOSARs, and we use the Monte Carlo simulation model to determine the fair value of PSUs that contain market conditions. Both of these models require assumptions to be made regarding our stock price volatility, the expected life of the award and expected dividend rates. The volatility and the expected life assumptions are based on our historical data. Similarly, the compensation expense of performance share awards is based in part on the estimated probability of achieving levels of performance associated with particular levels of payout for performance shares. We determine the probability of achievement of future levels of performance by comparing the relevant performance level with our internal estimates of future performance. Those estimates are based on a number of assumptions, including but not limited to growth in restaurant cash flow dollars, average restaurant level operating margin, and growth in new restaurant openings, and different assumptions may have resulted in different conclusions regarding the probability of achieving future levels of performance relevant to the payout levels for the awards. If we change our estimates of stock price volatility or expected lives of our SOSARs, or if we change our assumptions regarding the probability of achieving future levels of performance with respect to performance share awards, our stock-based compensation expense and results of operations may be materially impacted.
Income Taxes
Our provision for income taxes, deferred tax assets and liabilities and any related valuation allowance requires the use of estimates based on our management’s interpretation and application of complex tax laws and accounting guidance. The majority of our income tax liability is incurred in the U.S. We establish reserves for uncertain tax positions for material, known tax exposures relating to deductions, transactions and other matters involving some uncertainty as to the measurement and recognition of the item. We may adjust these reserves when our judgment changes as a result of the evaluation of new information not previously available and will be reflected in the period in which the new information is available, or due to the expiration of any applicable statute of limitations. While we believe that our reserves are adequate, issues raised by a tax authority may be resolved at an amount different than the related reserve and could materially increase or decrease our income tax provision in future periods.
ITEM 7A. QUANTITATIVE AND QUALITATIVE DISCLOSURE ABOUT MARKET RISK
Commodity Price Risks
We are exposed to commodity price risks. Many of the ingredients we use to prepare our food, as well as our packaging materials and utilities to run our restaurants, are ingredients or commodities that are affected by the price of other commodities, exchange rates, foreign demand, weather, seasonality, production, availability and other factors outside our control. We work closely with our suppliers and use a mix of forward pricing protocols under which we agree with our supplier on fixed prices for deliveries at some time in the future, fixed pricing protocols under which we agree on a fixed price with our supplier for the duration of that protocol, formula pricing protocols under which the prices we pay are based on a specified formula related to the prices of the goods, such as spot prices or based on changes in industry indices, and range forward protocols under which we agree on a price range for the duration of that protocol. Generally, our pricing protocols with suppliers can remain in effect for periods ranging from one to 24 months, depending on the outlook for prices of the particular ingredient. In some cases, we have minimum purchase obligations. We have tried to increase the number of suppliers for our ingredients, which we believe can help mitigate pricing volatility and supply continuity risks, and we follow industry news, trade tariffs, exchange rates, foreign demand, weather, geopolitical crises and other world events that may affect our ingredient prices. Increases in ingredient prices could adversely affect our results if we choose for competitive or other reasons not to increase menu prices at the same rate at which ingredient costs increase, or if menu price increases result in guest resistance. We also could experience shortages of key ingredients for many unforeseen reasons, such as crop damage due to inclement weather, if our suppliers need to close or restrict operations, or due to industry-wide shipping and freight delays.
Changing Interest Rates
We are exposed to interest rate risk through fluctuations of interest rates on our investments. As of December 31, 2024, we had $2.3 billion in cash and cash equivalents, current and long-term investments, and restricted cash, of which the substantial majority are interest bearing. Changes in interest rates affect the interest income we earn, and therefore impact our cash flows and results of operations.
Foreign Currency Exchange Risk
A portion of our operations consist of activities outside of the U.S. and we have currency risk on the transactions in other currencies and translation adjustments resulting from the conversion of our international financial results into the U.S. dollar. However, a substantial majority of our operations and investment activities are transacted in the U.S., and therefore our foreign currency risk is not material at this date.
ITEM 8. FINANCIAL STATEMENTS AND SUPPLEMENTARY DATA
Report of Independent Registered Public Accounting Firm
To the Shareholders and the Board of Directors of Chipotle Mexican Grill, Inc.
Opinion on the Financial Statements
We have audited the accompanying consolidated balance sheets of Chipotle Mexican Grill, Inc. (the Company) as of December 31, 2024 and 2023, the related consolidated statements of income and comprehensive income, shareholders' equity and cash flows for each of the three years in the period ended December 31, 2024, and the related notes (collectively referred to as the “consolidated financial statements”). In our opinion, the consolidated financial statements present fairly, in all material respects, the financial position of the Company at December 31, 2024 and 2023, and the results of its operations and its cash flows for each of the three years in the period ended December 31, 2024, in conformity with U.S. generally accepted accounting principles.
We also have audited, in accordance with the standards of the Public Company Accounting Oversight Board (United States) (PCAOB), the Company's internal control over financial reporting as of December 31, 2024, based on criteria established in Internal Control-Integrated Framework issued by the Committee of Sponsoring Organizations of the Treadway Commission (2013 framework) and our report dated February 5, 2025 expressed an unqualified opinion thereon.
Basis for Opinion
These financial statements are the responsibility of the Company's management. Our responsibility is to express an opinion on the Company’s financial statements based on our audits. We are a public accounting firm registered with the PCAOB and are required to be independent with respect to the Company in accordance with the U.S. federal securities laws and the applicable rules and regulations of the Securities and Exchange Commission and the PCAOB.
We conducted our audits in accordance with the standards of the PCAOB. Those standards require that we plan and perform the audit to obtain reasonable assurance about whether the financial statements are free of material misstatement, whether due to error or fraud. Our audits included performing procedures to assess the risks of material misstatement of the financial statements, whether due to error or fraud, and performing procedures that respond to those risks. Such procedures included examining, on a test basis, evidence regarding the amounts and disclosures in the financial statements. Our audits also included evaluating the accounting principles used and significant estimates made by management, as well as evaluating the overall presentation of the financial statements. We believe that our audits provide a reasonable basis for our opinion.
Critical Audit Matter
The critical audit matter communicated below is a matter arising from the current period audit of the financial statements that was communicated or required to be communicated to the audit committee and that: (1) relates to accounts or disclosures that are material to the financial statements and (2) involved our especially challenging, subjective or complex judgments. The communication of the critical audit matter does not alter in any way our opinion on the consolidated financial statements, taken as a whole, and we are not, by communicating the critical audit matter below, providing a separate opinion on the critical audit matter or on the account or disclosure to which it relates.
| | | | | | | | |
| | Evaluation of stock-based compensation performance condition assumptions |
| | |
| Description of the Matter | | The Company incurred $134.6 million in stock-based compensation expense during the year ended December 31, 2024. Approximately 3,649,000 of the Company’s vested and non-vested stock awards were subject to performance conditions during the year ended December 31, 2024. As described in Notes 1 and 8 of the consolidated financial statements, the Company records the grant date fair value of the performance stock awards and expenses the fair value of the performance stock awards subject to service conditions over the respective vesting period. Stock-based compensation expense of stock awards subject to performance conditions is based on the estimated probability of achieving levels of performance associated with particular levels of payout. Additionally, at each reporting period, the Company evaluates the probable outcome of the performance conditions including consideration of significant assumptions and as applicable, recognizes the cumulative effect of the change in estimate in the period of the change.
Auditing the estimated quantity of awards the Company determined are probable of vesting for the Company’s stock awards subject to performance conditions was complex and judgmental. In particular, the stock compensation expense is sensitive to significant assumptions including management’s internal estimates of the Company’s future performance. Those estimates are based on certain targets relating to growth in cumulative base restaurant cash flow dollars.
|
| | |
| How We Addressed the Matter in Our Audit | | We obtained an understanding, evaluated the design, and tested the operating effectiveness of management’s controls over stock-based compensation. We tested controls over management’s review of the assumptions used with regards to the performance conditions. We also tested management's controls to validate that data used in management’s internal estimates of the Company’s future performance was complete and accurate.
Our substantive audit procedures included, among others, testing the significant assumptions underlying the performance conditions (e.g., certain targets related to growth in cumulative base restaurant cash flow dollars) and testing the completeness and accuracy of the underlying data. We evaluated management’s significant assumptions by comparing the assumptions to current market and economic trends, historical results of the Company's business, and to other relevant factors. We additionally performed a sensitivity analysis of the significant assumptions to evaluate the change in the expense to be recognized for the stock awards subject to performance conditions. We also evaluated the adequacy of the Company’s stock-based compensation disclosures included in Notes 1 and 8 of the consolidated financial statements in relation to these matters.
|
/s/ Ernst & Young LLP
We have served as the Company’s auditor since 1997.
Irvine, California
February 5, 2025
CHIPOTLE MEXICAN GRILL, INC.
CONSOLIDATED BALANCE SHEETS
(in thousands, except per share data)
| | | | | | | | | | | |
| | December 31, |
| | 2024 | | 2023 |
| Assets | | | |
| Current assets: | | | |
| Cash and cash equivalents | $ | 748,537 | | $ | 560,609 |
| Accounts receivable, net | 143,963 | | 115,535 |
| Inventory | 48,942 | | 39,309 |
| Prepaid expenses and other current assets | 97,538 | | 117,462 |
| Income tax receivable | 67,229 | | 52,960 |
| Investments | 674,378 | | 734,838 |
| Total current assets | 1,780,587 | | 1,620,713 |
| Leasehold improvements, property and equipment, net | 2,390,126 | | 2,170,038 |
| Long-term investments | 868,025 | | 564,488 |
| Restricted cash | 29,842 | | 25,554 |
| Operating lease assets | 4,000,127 | | 3,578,548 |
| Other assets | 113,728 | | 63,082 |
| Goodwill | 21,939 | | 21,939 |
| Total assets | $ | 9,204,374 | | $ | 8,044,362 |
| Liabilities and shareholders' equity | | | |
| Current liabilities: | | | |
| Accounts payable | $ | 210,695 | | $ | 197,646 |
| Accrued payroll and benefits | 261,913 | | 227,537 |
| Accrued liabilities | 179,747 | | 147,688 |
| Unearned revenue | 238,577 | | 209,680 |
| Current operating lease liabilities | 277,836 | | 248,074 |
| | | |
| Total current liabilities | 1,168,768 | | 1,030,625 |
| Commitments and contingencies (Note 11) | | | |
| Long-term operating lease liabilities | 4,262,782 | | 3,803,551 |
| Deferred income tax liabilities | 46,208 | | 89,109 |
| Other liabilities | 71,070 | | 58,870 |
| Total liabilities | 5,548,828 | | 4,982,155 |
| Shareholders' equity: | | | |
Preferred stock, $0.01 par value, 600,000 shares authorized, no shares issued as of December 31, 2024 and December 31, 2023, respectively | - | | - |
Common stock, $0.01 par value, 11,500,000 shares authorized, 1,358,751 and 1,874,139 shares issued as of December 31, 2024 and December 31, 2023, respectively | 13,586 | | 18,741 |
| Additional paid-in capital | 2,078,010 | | 1,937,794 |
Treasury stock, at cost, 0 and 502,843 common shares as of December 31, 2024 and December 31, 2023, respectively | - | | | (4,944,656) | |
| Accumulated other comprehensive loss | (10,282) | | | (6,657) | |
| Retained earnings | 1,574,232 | | 6,056,985 |
| Total shareholders' equity | 3,655,546 | | 3,062,207 |
| Total liabilities and shareholders' equity | $ | 9,204,374 | | $ | 8,044,362 |
| | | |
See accompanying notes to consolidated financial statements.
CHIPOTLE MEXICAN GRILL, INC.
CONSOLIDATED STATEMENTS OF INCOME AND COMPREHENSIVE INCOME
(in thousands, except per share data)
| | | | | | | | | | | | | | | | | |
| | Year ended December 31, |
| | 2024 | | 2023 | | 2022 |
| Food and beverage revenue | $ | 11,247,384 | | $ | 9,804,124 | | $ | 8,558,001 |
| Delivery service revenue | 66,469 | | 67,525 | | 76,651 |
| Total revenue | 11,313,853 | | 9,871,649 | | 8,634,652 |
| Restaurant operating costs (exclusive of depreciation and amortization shown separately below): | | | | | |
| Food, beverage and packaging | 3,374,516 | | 2,912,564 | | 2,602,245 |
| Labor | 2,789,789 | | 2,440,982 | | 2,197,958 |
| Occupancy | 563,374 | | 503,264 | | 460,425 |
| Other operating costs | 1,568,482 | | 1,428,747 | | 1,311,905 |
| General and administrative expenses | 697,483 | | 633,584 | | 564,191 |
| Depreciation and amortization | 335,030 | | 319,394 | | 286,826 |
| Pre-opening costs | 41,897 | | 36,931 | | 29,560 |
| Impairment, closure costs, and asset disposals | 26,949 | | 38,370 | | 21,139 |
| Total operating expenses | 9,397,520 | | 8,313,836 | | 7,474,249 |
| Income from operations | 1,916,333 | | 1,557,813 | | 1,160,403 |
| Interest and other income, net | 93,897 | | 62,693 | | 21,128 |
| Income before income taxes | 2,010,230 | | 1,620,506 | | 1,181,531 |
| Provision for income taxes | 476,120 | | | 391,769 | | | 282,430 | |
| Net income | $ | 1,534,110 | | $ | 1,228,737 | | $ | 899,101 |
| Earnings per share: | | | | | |
| Basic | $ | 1.12 | | $ | 0.89 | | $ | 0.65 |
| Diluted | $ | 1.11 | | $ | 0.89 | | $ | 0.64 |
| Weighted-average common shares outstanding: | | | | | |
| Basic | 1,368,343 | | 1,377,768 | | 1,392,543 |
| Diluted | 1,376,555 | | 1,385,500 | | 1,403,077 |
| Other comprehensive income/(loss), net of income taxes: | | | | | |
| Foreign currency translation adjustments | $ | (3,625) | | $ | 1,231 | | | (2,534) | |
| Comprehensive income | $ | 1,530,485 | | $ | 1,229,968 | | $ | 896,567 |
See accompanying notes to consolidated financial statements.
CHIPOTLE MEXICAN GRILL, INC.
CONSOLIDATED STATEMENTS OF SHAREHOLDERS’ EQUITY
(in thousands)
| | | | | | | | | | | | | | | | | | | | | | | | | | | | | | | | | | | | | | | | | | | | | | | |
| Common Stock | | | | Treasury Stock | | | | | | |
| Shares | | Amount | | Additional
Paid-In
Capital | | Shares | | Amount | | Retained
Earnings | | Accumulated Other Comprehensive Loss | | Total |
| Balance, December 31, 2021 | 1,856,597 | | $ | 18,566 | | | $ | 1,711,117 | | | 452,622 | | $ | (3,356,102) | | | $ | 3,929,147 | | | $ | (5,354) | | | $ | 2,297,374 | |
| Stock-based compensation | - | | - | | | 99,821 | | | - | | - | | | - | | | - | | | 99,821 | |
| Stock plan transactions and other | 9,395 | | 94 | | | 79 | | | - | | - | | | - | | | - | | | 173 | |
| Repurchase of common stock | - | | - | | | - | | | 32,029 | | (925,912) | | | - | | | - | | | (925,912) | |
| Net income | - | | - | | | - | | | - | | - | | | 899,101 | | | - | | | 899,101 | |
| Other comprehensive income/(loss), net of income taxes | - | | - | | | - | | | - | | - | | | - | | | (2,534) | | | (2,534) | |
| Balance, December 31, 2022 | 1,865,992 | | 18,660 | | | 1,811,017 | | | 484,651 | | (4,282,014) | | | 4,828,248 | | | (7,888) | | | 2,368,023 | |
| Stock-based compensation | - | | - | | | 126,686 | | | - | | - | | | - | | | - | | | 126,686 | |
| Stock plan transactions and other | 8,147 | | 81 | | | 91 | | | - | | - | | | - | | | - | | | 172 | |
| Repurchase of common stock | - | | - | | | - | | | 18,192 | | (662,642) | | | - | | | - | | | (662,642) | |
| Net income | - | | - | | | - | | | - | | - | | | 1,228,737 | | | - | | | 1,228,737 | |
| Other comprehensive income/(loss), net of income taxes | - | | - | | | - | | | - | | - | | | - | | | 1,231 | | | 1,231 | |
| Balance, December 31, 2023 | 1,874,139 | | 18,741 | | | 1,937,794 | | | 502,843 | | (4,944,656) | | | 6,056,985 | | | (6,657) | | | 3,062,207 | |
| Stock-based compensation | - | | - | | | 134,635 | | | - | | - | | | - | | | - | | | 134,635 | |
| Stock plan transactions and other | 6,284 | | 62 | | | 5,581 | | | - | | - | | | - | | | - | | | 5,643 | |
| Repurchase of common stock | (14,506) | | | (145) | | | - | | | 4,323 | | (249,540) | | | (827,739) | | | - | | | (1,077,424) | |
| Retirement of treasury stock | (507,166) | | | (5,072) | | | - | | | (507,166) | | | 5,194,196 | | | (5,189,124) | | | - | | | - | |
| Net income | - | | - | | | - | | | - | | - | | | 1,534,110 | | | - | | | 1,534,110 | |
| Other comprehensive income/(loss), net of income taxes | - | | - | | | - | | | - | | - | | | - | | | (3,625) | | | (3,625) | |
| Balance, December 31, 2024 | 1,358,751 | | $ | 13,586 | | | $ | 2,078,010 | | | $ | - | | | $ | - | | | $ | 1,574,232 | | | $ | (10,282) | | | $ | 3,655,546 | |
See accompanying notes to consolidated financial statements.
CHIPOTLE MEXICAN GRILL, INC.
CONSOLIDATED STATEMENTS OF CASH FLOWS
(in thousands) | | | | | | | | | | | | | | | | | |
| | Year ended December 31, |
| | 2024 | | 2023 | | 2022 |
| Operating activities | | | | | |
| Net income | $ | 1,534,110 | | $ | 1,228,737 | | $ | 899,101 |
| Adjustments to reconcile net income to net cash provided by operating activities: | | | | | |
| Depreciation and amortization | 335,030 | | 319,394 | | 286,826 |
| Deferred income tax provision | (42,937) | | (9,505) | | | (43,195) | |
| Impairment, closure costs, and asset disposals | 24,582 | | 37,025 | | 20,738 |
| Provision for credit losses | 215 | | 1,570 | | | (760) |
| Stock-based compensation expense | 131,730 | | 124,016 | | 98,030 |
| Other | (3,472) | | | (13,080) | | | (16,202) | |
| Changes in operating assets and liabilities: | | | | | |
| Accounts receivable | (29,274) | | (11,216) | | (14,026) | |
| Inventory | (9,797) | | | (3,649) | | | (3,011) | |
| Prepaid expenses and other current assets | 9,244 | | | (39,211) | | | (14,660) | |
| Operating lease assets | 285,587 | | 254,241 | | 234,273 |
| Other assets | (17,690) | | | 4,204 | | | (346) |
| Accounts payable | 8,467 | | 5,313 | | 18,208 |
| Accrued payroll and benefits | 34,857 | | | 57,048 | | | 9,864 | |
| Accrued liabilities | 27,284 | | 3,188 | | | (27,964) |
| Unearned revenue | 46,139 | | | 35,685 | | | 33,374 |
| Income tax payable/receivable | (14,363) | | (5,237) | | | 46,262 |
| Operating lease liabilities | (217,894) | | | (214,477) | | | (207,186) | |
| Other long-term liabilities | 3,258 | | 9,431 | | 3,853 | |
| Net cash provided by operating activities | 2,105,076 | | 1,783,477 | | 1,323,179 |
| Investing activities | | | | | |
| Purchases of leasehold improvements, property and equipment | (593,603) | | | (560,731) | | | (479,164) | |
| Purchases of investments | (986,673) | | | (1,115,131) | | | (614,416) | |
| Maturities of investments | 722,637 | | 729,853 | | 263,548 |
| Proceeds from sale of equipment | 20,113 | | | - | | | - | |
| Net cash used in investing activities | (837,526) | | | (946,009) | | | (830,032) | |
| Financing activities | | | | | |
| Repurchase of common stock | (1,001,559) | | | (592,349) | | | (830,140) | |
| Tax withholding on stock-based compensation awards | (74,229) | | | (69,146) | | | (98,970) | |
| Other financing activities | 2,089 | | 843 | | | (294) | |
| Net cash used in financing activities | (1,073,699) | | | (660,652) | | | (929,404) | |
| Effect of exchange rate changes on cash, cash equivalents and restricted cash | (1,635) | | 381 | | | (1,007) | |
| Net change in cash, cash equivalents, and restricted cash | 192,216 | | 177,197 | | | (437,264) |
| Cash, cash equivalents, and restricted cash at beginning of year | 586,163 | | 408,966 | | 846,230 |
| Cash, cash equivalents, and restricted cash at end of year | $ | 778,379 | | $ | 586,163 | | $ | 408,966 |
| Supplemental disclosures of cash flow information | | | | | |
| Income taxes paid | $ | 532,862 | | $ | 400,229 | | $ | 275,796 | |
| Purchases of leasehold improvements, property and equipment accrued in accounts payable and accrued liabilities | $ | 82,636 | | $ | 76,415 | | $ | 72,021 |
| Repurchase of common stock accrued in accounts payable and accrued liabilities | $ | 7,279 | | $ | 5,643 | | $ | 4,497 |
See accompanying notes to consolidated financial statements.
CHIPOTLE MEXICAN GRILL, INC.
NOTES TO CONSOLIDATED FINANCIAL STATEMENTS
(dollar and share amounts in thousands, unless otherwise specified)
1. Description of Business and Summary of Significant Accounting Policies
In this annual report on Form 10-K, Chipotle Mexican Grill, Inc., a Delaware corporation, together with its subsidiaries, is collectively referred to as “Chipotle,” “we,” “us,” or “our.”
We develop and operate restaurants that serve a relevant menu of burritos, burrito bowls, quesadillas, tacos, and salads, made using fresh, high-quality ingredients. As of December 31, 2024, we operated 3,726 restaurants including 3,644 Chipotle restaurants within the United States, and 82 international Chipotle restaurants. Additionally, we had three international licensed restaurants. We manage our U.S. operations based on ten regions and aggregate our operations to one reportable segment. Additional details on the nature of our business and our reportable operating segment are included in Note 14. "Segment Reporting". On June 26, 2024, we effected a 50-for-1 stock split of our common stock and proportionately increased the number of authorized shares of common stock. All share and per share information, including share-based compensation, throughout this Annual Report on Form 10-K has been retroactively adjusted to reflect the stock split. The shares of common stock retain a par value of $0.01 per share. Accordingly, an amount equal to the par value of the additional shares issued in the stock split was reclassified from capital in excess of par value to common stock. In the second quarter of 2024 we retired all treasury stock owned, which was recognized as a deduction from common stock for the shares' par value and the excess of cost over par as a deduction from retained earnings. All shares of common stock that we repurchase are immediately retired and not held as treasury stock.
Principles of Consolidation and Basis of Presentation
Our consolidated financial statements include our accounts, our wholly and majority owned subsidiaries and investees we control after elimination of all intercompany accounts and transactions.
Management Estimates
The preparation of financial statements in conformity with U.S. generally accepted accounting principles requires management to make estimates and assumptions that affect the reported amounts of assets and liabilities and the disclosure of contingent assets and liabilities as of the date of the financial statements, as well as the reported amounts of revenue and expenses during the reporting period. Actual results could differ from those estimates under different assumptions or conditions.
Cash and Cash Equivalents
We consider highly liquid investment instruments purchased with an initial maturity of three months or less to be cash equivalents. Amounts receivable from credit card companies are also considered cash equivalents as they are both short-term and highly liquid in nature. We maintain cash and cash equivalent balances that exceed federally-insured limits with a number of financial institutions.
Restricted Cash
We maintain certain cash balances restricted as to withdrawal or use. Restricted cash assets are primarily insurance-related restricted trust assets.
Accounts Receivable
Accounts receivable primarily consists of receivables from third party gift card distributors, delivery partners, interest receivable, insurance liabilities covered by third-party insurance carriers and vendor rebates.
Allowance for Credit Losses
We closely monitor accounts receivable and held to maturity investment balances and estimate the allowance for credit losses when lifetime credit losses are expected by management. Our estimate is based on historical collection experience, external market data and other factors, including those related to current market conditions and events. We do not recognize a reserve for expected credit losses related to our U.S. Treasury security investments as management has concluded there is no risk of non-payment.
As of December 31, 2024 and 2023, our allowance for credit losses was $2,953 and $2,742, respectively.
Inventory
Inventory, consisting principally of food, beverages, and supplies, is valued at the lower of first-in, first-out cost or net realizable value.
Equity Method Investments
Investments are accounted for under the equity method if we are able to exercise significant influence, but not control, over an investee. Our share of the earnings or losses as reported by the investees is included in interest and other income, net on the consolidated statements of income and comprehensive income. The investments are evaluated for impairment annually and when facts and circumstances indicate that the carrying value may not be recoverable. If a decline in fair value is determined to be other-than-temporary, an impairment charge is recorded in interest income and other income, net on our consolidated statements of income and comprehensive income.
Investments
Investments classified as trading securities are carried at fair value with any unrealized gain or loss being recorded in interest and other income, net on the consolidated statements of income and comprehensive income. Investments classified as available-for-sale are carried at fair value with unrealized gains and losses, net of tax, included as a component of other comprehensive income (loss), net of income taxes on the consolidated statements of income and comprehensive income. Held-to-maturity securities are carried at amortized cost. Non-marketable equity investments are measured at cost, less impairments, if any, plus or minus changes resulting from observable price changes in orderly transactions for the identical or similar investment of the same issuer. These gains or losses are included in interest and other income, net on the consolidated statements of income and comprehensive income.
Our held-to-maturity investments are comprised of U.S. Treasury securities and corporate debt securities, which are held at amortized cost. We also have investments in notes receivable. Convertible notes are held at fair value.
We have elected to fund certain deferred compensation plan obligations, as described further in Note 8. “Stock-Based Compensation and Employee Benefit Plans”, through a rabbi trust, the assets of which are designated as trading securities. The rabbi trust is subject to creditor claims in the event of insolvency, but the assets held in the rabbi trust are not available for general corporate purposes. Amounts in the rabbi trust are invested in mutual funds, consistent with the investment choices selected by participants in their Deferred Plan accounts, which are designated as trading securities, carried at fair value, and are included in other assets on the consolidated balance sheets. We record trading gains and losses, along with the offsetting amount related to the increase or decrease in deferred compensation to reflect our exposure to liabilities for payment under the deferred plan in general and administrative expenses on the consolidated statements of income and comprehensive income.
Fair Value Measurements
Fair value is the price we would receive to sell an asset or pay to transfer a liability (exit price) in an orderly transaction between market participants. For assets and liabilities recorded or disclosed at fair value, we determine fair value based on the following:
Level 1: Quoted prices in active markets for identical assets or liabilities that the entity has the ability to access.
Level 2: Observable inputs other than prices included in Level 1, such as quoted prices for similar assets and liabilities in active markets; quoted prices for identical or similar assets and liabilities in markets that are not active; or other inputs that are observable or can be corroborated with observable market data.
Level 3: Unobservable inputs for the asset or liability. This includes certain pricing models, discounted cash flow methodologies and similar techniques that use significant unobservable inputs.
Foreign Currency Translation
The functional currency of our foreign entities is the currency of the primary economic environment in which the entity operates. The operations, assets, and liabilities of our entities outside the U.S. are initially measured using the functional currency of that entity. Gains and losses arising from the impact of foreign currency exchange rate fluctuations on transactions in foreign currency are included as a separate component of other comprehensive income (loss), net of income taxes on the consolidated statements of income and comprehensive income. Assets and liabilities of these foreign entities are translated at exchange rates in effect as of the balance sheet date. Income and expense accounts are translated monthly using average monthly exchange rates. Resulting translation adjustments are recorded in accumulated other comprehensive loss on the consolidated balance sheets.
Leasehold Improvements, Property and Equipment
Leasehold improvements, property and equipment are recorded at cost. Internal costs directly associated with the acquisition, development and construction of a restaurant are capitalized. During the years ended December 31, 2024, 2023 and 2022, we capitalized $17,624, $15,385, and $12,695 of internal costs, respectively. Expenditures for refurbishments and improvements that significantly add to the productivity capacity or extend the useful life are capitalized, while expenditures for maintenance and repairs are expensed as incurred.
Capitalized software includes the costs of developing or obtaining internal-use software, such as external direct costs of materials and services, payroll and benefits costs, additional functionality, and costs to develop or obtain software that allows for access or conversion of historical data by new systems. We capitalize costs when the preliminary project stage is complete, management has authorized and committed to funding the software project, it is probable that the software project will be completed, and it is probable that the software will be used to perform the intended function.
Depreciation is calculated using the straight-line method over the estimated useful lives of the assets. Leasehold improvements are amortized over the shorter of the lease term, which generally includes option periods that are reasonably certain, or the estimated useful lives of the assets.
Upon retirement or disposal of assets, asset cost and accumulated depreciation are derecognized and any related gain or loss is reflected in impairment, closure costs, and asset disposals in the consolidated statements of income and comprehensive income. Assets to be disposed of are reported at the lower of their carrying amount or fair value less estimated costs to sell.
At least annually, or when impairment indicators are present, we evaluate, and adjust when necessary, the estimated useful lives of leasehold improvements, property and equipment. The changes in estimated useful lives did not have a material impact on depreciation in any period. The estimated useful lives are:
| | | | | |
| Leasehold improvements and buildings | 3-20 years |
| Furniture and fixtures | 4-7 years |
| Equipment | 3-10 years |
Leases
The majority of our operating leases consist of restaurant locations and office space. We determine if a contract contains a lease at inception. Our leases generally have remaining terms of 1-20 years and most include options to extend the leases for additional 5-year periods. Generally, the lease term is the minimum of the noncancelable period of the lease or the lease term inclusive of reasonably certain renewal periods up to a term of 20 years.
We recognize an operating lease asset and operating lease liability for each lease with a contractual term greater than 12 months at the time of lease inception. We do not record leases with an initial term of 12 months or less on our consolidated balance sheet but continue to record rent expense on a straight-line basis over the lease term.
Operating lease assets and liabilities are recognized at the lease commencement date, which is the date we control the use of the property. Operating lease liabilities represent the present value of lease payments not yet paid. We made the policy election to combine lease and non-lease components. We consider fixed CAM part of our fixed future lease payments; therefore, fixed CAM is also included in our lease liability. To determine the present value of lease payments not yet paid, we estimate incremental borrowing rates corresponding to the lease term including reasonably certain renewal periods. As we have no outstanding debt nor committed credit facilities, secured or otherwise, we estimate this rate based on prevailing financial market conditions, comparable company and credit analysis, and management judgment.
Total lease costs, which are recorded primarily as occupancy costs, include fixed operating lease costs, variable lease costs and short-term lease costs. Most of our real estate leases require we pay certain expenses, such as CAM costs, real estate taxes and insurance, of which the fixed portion is included in operating lease costs. We recognize operating lease costs on a straight-line basis over the lease term. In addition to the above costs, variable lease costs also include amounts based on a percentage of gross sales in excess of specified levels and are recognized when probable and are not included in determining the present value of our operating lease liability.
Operating lease assets represent our right to use an underlying asset and are based upon the operating lease liabilities adjusted for lease payments made at or before the lease commencement date, initial direct costs, lease incentives, and impairment of operating lease assets. For operating leases, operating lease assets are reduced over the lease term by the recognized straight-line lease expense less the amount of accretion of the lease liability. Additionally, tenant incentives used to fund leasehold improvements are generally recognized when earned and reduce our right-of-use asset related to the lease. These are amortized through the operating lease asset as reductions of expense over the lease term.
Our lease agreements do not contain any material residual value guarantees or material restrictive covenants. We have not entered into any leases with related parties.
Goodwill
Goodwill is not subject to amortization, but instead is tested for impairment annually in the fourth quarter, or more frequently when impairment indicators are present, and we are required to record any necessary impairment adjustments. Impairment is measured as the excess of the carrying value over the fair value of the goodwill. No impairment charges were recognized on goodwill for the years ended December 31, 2024, 2023 and 2022.
Insurance Liability
We are self-insured for a significant portion of our employee health benefits programs, and carry significant retentions for risks and associated liabilities with respect to workers’ compensation, general liability, property and auto damage, employment practices liability, cyber liability and directors’ and officers’ liability. Predetermined loss limits have been arranged with third party insurance companies to limit exposure to these claims. We record a liability that represents our estimated cost of claims incurred and unpaid as of the balance sheet date. Our estimated liability is not discounted and is based on a number of assumptions and factors, including historical trends, actuarial assumptions and economic conditions, and is closely monitored and adjusted when warranted by changing circumstances.
Reserves/Contingencies for Litigation and Other Matters
We are involved in various claims and legal actions that arise in the ordinary course of business. We record an accrual for legal contingencies when we determine that it is probable that we have incurred a liability and we can reasonably estimate the amount of the loss.
Income Taxes
We compute income taxes using the asset and liability method, under which deferred income tax assets and liabilities are recognized based on the differences between the financial reporting bases and the respective tax bases of assets and liabilities. Deferred tax assets and liabilities are measured using enacted tax rates expected to apply to taxable income in the years in which we expect the temporary differences to reverse. Any effects of changes in income tax rates or tax laws are included in the provision for income taxes in the period that includes the enactment date.
We routinely assess the realizability of our deferred tax assets by jurisdiction and may record a valuation allowance if, based on all available positive and negative evidence, we determine that some portion of the deferred tax assets may not be realized prior to expiration. If we determine that we may be able to realize our deferred tax assets in the future in excess of their net recorded amount, we would make an adjustment to the deferred tax asset valuation allowance, which would reduce the provision for income taxes during the period in which the determination was made that the deferred tax asset can be realized.
We evaluate our tax filing positions and recognize a tax benefit from an uncertain tax position only if it is more likely than not that based on its technical merits the tax position will be sustained upon examination by the relevant taxing authorities, including resolutions of any related appeals or litigation processes. The tax benefits recognized in the financial statements from such a position are measured based on the largest tax benefit that has a greater than 50% likelihood of being realized upon settlement with a taxing authority. For uncertain tax positions that do not meet this threshold, we record a related tax reserve in the period in which it arises. We adjust our unrecognized tax benefit liability and provision for income taxes in the period in which the uncertain tax position is effectively settled, the statute of limitations expires for the relevant taxing authority to examine the tax position or when new information becomes available that requires a change in recognition and/or measurement of the liability.
We recognize interest to be paid on an underpayment of income taxes in interest expense and any related statutory penalties in the provision for income taxes in our consolidated statements of income and comprehensive income. Accrued interest and penalties are included within the related tax reserve on our consolidated balance sheets.
Revenue Recognition
We generally recognize revenue, net of discounts and incentives, when payment is tendered at the point of sale. We report revenue net of sales-related taxes collected from guests and remitted to governmental taxing authorities. Food and beverage revenue primarily relates to the sale of food and beverages. Delivery service revenue is comprised of delivery and related service fees charged to guests on sales made through Chipotle’s app and website.
Delivery
Delivery services are fulfilled by third-party service providers. In some cases, we make delivery sales through our website Chipotle.com or the Chipotle App (“White Label Sales”). In other cases, we make delivery sales through a non-Chipotle owned channel, such as the delivery partner’s website or mobile app (“Marketplace Sales”). With respect to White Label Sales, we control the delivery services and generally recognize revenue, including delivery fees, when the delivery partner transfers food to the guest. For these sales, we receive payment directly from the guest at the time of sale. With respect to Marketplace Sales, we generally recognize revenue, excluding delivery fees collected by the delivery partner, when control of the food is transferred to the guest. We receive payment from the delivery partner subsequent to the transfer of food and the payment terms are short-term in nature.
Gift Cards
We sell gift cards, which do not have expiration dates and we do not deduct non-usage fees from outstanding gift card balances. Gift card balances are initially recorded as unearned revenue. We recognize revenue from gift cards when the gift card is redeemed by the guest. Historically, the majority of gift cards are redeemed within one year. In addition, a portion of gift cards are not expected to be redeemed and will be recognized as breakage over time in proportion to gift card redemptions. The gift card breakage rate is based on company and program specific information, including historical redemption patterns, and expected remittance to government agencies under unclaimed property laws, if applicable. We evaluate our gift card breakage rate estimate annually, or more frequently as circumstances warrant, and apply that rate to gift card redemptions. Gift card liability balances are typically highest at the end of each calendar year following increased gift card sales during the holiday season; accordingly, revenue recognized from gift card liability balances is highest in the first quarter of each calendar year.
Chipotle Rewards
We have a loyalty program called Chipotle Rewards. Guests who enroll in the program generally earn points for every dollar spent.
We may also periodically offer promotions, which typically provide the guest with the opportunity to earn bonus points or other rewards. Guests may redeem earned points for various rewards, which are primarily comprised of free food and beverage items. Earned rewards generally expire one month to two months after they are issued, and points generally expire if an account is inactive for a period of six months.
We defer revenue associated with the estimated selling price of points or rewards earned by guests as each point or reward is earned, net of points or rewards we do not expect to be redeemed. The estimated selling price of each point or reward earned is based on the estimated value of the product for which the reward is expected to be redeemed. Our estimate of points and rewards we expect to be redeemed is based on historical and other company specific data. The costs associated with rewards redeemed are primarily included in food, beverage, and packaging on our consolidated statements of income and comprehensive income.
We evaluate Chipotle Rewards point breakage annually, or more frequently as circumstances warrant.
We recognize revenue associated with Chipotle Rewards within food and beverage revenue on the consolidated statements of income and comprehensive income when a guest redeems an earned reward. Deferred revenue associated with Chipotle Rewards is included in unearned revenue on our consolidated balance sheets.
Food, Beverage and Packaging Costs
Food, beverage and packaging costs include inventory, warehousing and related purchasing and distribution costs.
Other Operating Costs
Other operating costs include marketing and promotional costs, delivery expense, bank and credit card processing fees, restaurant utilities, technology costs, maintenance costs and other costs that directly support the operation and sales-related activities of our restaurants.
Consideration Received from Vendors
We receive consideration for a variety of vendor-sponsored programs, such as volume rebates and promotions. Vendor consideration is recorded as a reduction of food, beverage and packaging or other operating costs on our consolidated statements of income and comprehensive income depending on the classification of the related costs.
Advertising, Marketing and Promotional Costs
Advertising, marketing and promotional costs are expensed as incurred and totaled $286,044, $264,085 and $250,673 for the years ended December 31, 2024, 2023 and 2022, respectively. Advertising, marketing and promotional costs include costs related to free food which a guest does not need to make a purchase to earn. These costs are included in other operating costs on the consolidated statements of income and comprehensive income.
Stock-Based Compensation
RSUs and SOSARs generally vest equally on the second and third anniversaries of the grant date, and SOSARs expire after seven years. PSUs generally vest on the third anniversary of the grant date, depending on performance levels achieved relative to the target market and performance factors in each PSU agreement. Stock-based compensation expense is generally recognized on a straight-line basis for each separate vesting portion. The grant date fair value of RSUs is based on the closing price of Chipotle common stock on the award date. The grant date fair value of PSUs that contain only performance conditions is based on the closing price of Chipotle common stock on the award date, where the grant date fair value of PSUs that also contain market conditions consider the output of the Monte Carlo simulation in the grant date fair value, as applicable. The grant date fair value of SOSARs is determined using the Black-Scholes valuation model.
Compensation expense related to employees eligible to retire and retain full rights to the awards is recognized over 12 months which coincides with the service period required to earn the full award. We estimate forfeitures based on historical data when determining the amount of stock-based compensation costs to be recognized in each period. PSUs with performance or market vesting conditions generally vest based on our achievement versus stated targets or criteria over a three-year performance and service period. Performance goals are determined by the Board and include measures such as average restaurant operating margin, restaurant cash flow dollars, new restaurant unit growth, and total shareholder return relative to our peer group. Compensation expense on stock awards subject to performance conditions, which is based on the quantity of awards we have determined are probable of vesting, is recognized over the longer of the estimated performance goal attainment period or time vesting period. Compensation expense is recognized ratably for awards subject to market conditions regardless of whether the market condition is satisfied, provided that the requisite service has been met. Some stock-based compensation awards are made to employees involved in our new restaurant development activities, and expense for these awards is recognized as capitalized development and included in leasehold improvements, property and equipment, net, on the consolidated balance sheets.
Restaurant Pre-Opening Costs
Pre-opening costs, including rent, wages, benefits and travel for training and opening teams, food and other restaurant operating costs, are expensed as incurred prior to a restaurant opening for business.
Impairment of Long-Lived Assets
Long-lived assets are reviewed for impairment whenever events or changes in circumstances indicate that the carrying amount of an asset may not be recoverable. Long-lived assets are grouped at the lowest level for which identifiable cash flows are largely independent of the cash flows of other assets and liabilities. For restaurant assets we test impairment at the individual restaurant asset group level, which includes leasehold improvements, property and equipment and operating lease assets.
The fair value measurement for asset impairment is generally based on Level 3 inputs. See “Fair Value Measurements” above for a description of level inputs. We first compare the carrying value of the asset (or asset group, referred interchangeably throughout as asset) to the asset’s estimated future undiscounted cash flows. If the estimated undiscounted future cash flows are less than the carrying value of the asset, we determine if we have an impairment loss by comparing the carrying value of the asset to the asset's estimated fair value. The estimated fair value of the asset is generally determined using the income approach to measure the fair value, which is based on the present value of estimated future cash flows. Key inputs to the income approach for restaurant assets include the discount rate, projected restaurant revenues and expenses, and sublease income if we are closing the restaurant. In certain cases, management uses other market information, when available, to estimate the fair value of an asset. The impairment charges represent the excess of each asset’s carrying amount over its estimated fair value and are allocated among the long-lived asset or assets of the group.
Earnings per Share
Basic earnings per share is calculated by dividing income available to common shareholders by the weighted-average number of shares of common stock outstanding during each period. Diluted earnings per share (“diluted EPS”) is calculated using income available to common shareholders divided by diluted weighted-average shares of common stock outstanding during each period. Potentially dilutive securities include shares of common stock underlying SOSARs and non-vested stock awards (collectively “stock awards”). Diluted EPS considers the impact of potentially dilutive securities except in periods in which there is a loss because the inclusion of the potential common shares would have an anti-dilutive effect. Stock awards are excluded from the calculation of diluted EPS in the event they are subject to performance conditions or are antidilutive.
Recently Issued Accounting Standards
Recently Adopted Accounting Pronouncement
In November 2023, the FASB issued ASU No. 2023-07, “Segment Reporting (Topic 280): Improvements to Reportable Segment Disclosure.” The ASU updates reportable segment disclosure requirements, primarily through requiring enhanced disclosures about significant segment expenses and information used to assess segment performance. The amendments do not change how segments are determined, aggregated, or how thresholds are applied to determine reportable segments. We adopted ASU No. 2023-07 during the year ended December 31, 2024. See Note 14 "Segment Reporting" in the accompanying notes to the consolidated financial statements for further detail.
Recent Accounting Pronouncements Not Yet Adopted
In December 2023, the FASB issued ASU No. 2023-09, “Income Taxes (Topic 740): Improvements to Income Tax Disclosures.” The ASU includes amendments requiring enhanced income tax disclosures, primarily related to standardization and disaggregation of rate reconciliation categories and income taxes paid by jurisdiction. The guidance is effective for fiscal years beginning after December 15, 2024, with early adoption permitted, and should be applied either prospectively or retrospectively. We are currently evaluating the impact of adopting this ASU on our consolidated financial statements and related disclosures.
In March 2024, the Securities and Exchange Commission ("SEC") issued its final climate disclosure rules. The rules require disclosure of climate-related information outside of the audited financial statements and disclosure in the footnotes addressing specified financial statement effects of severe weather events and other natural conditions above certain financial thresholds, certain carbon offsets and renewable energy credits or certificates, if material. Disclosure requirements will begin phasing in for fiscal years beginning on or after January 1, 2025. On April 4, 2024, the SEC determined to voluntarily stay the effective date of the final rules pending certain legal challenges. We are currently evaluating the impact of adopting the new rules and continue to monitor the status of the related legal challenges.
In November 2024, the FASB issued ASU No. 2024-03, "Disaggregation of Income Statement Expenses (Subtopic 220-40)." The ASU requires public entities to disaggregate, in a tabular presentation, certain income statement expenses into different categories, such as purchases of inventory, employee compensation, depreciation, and intangible asset amortization. The guidance is effective for fiscal years beginning after December 15, 2026, with early adoption permitted, and may be applied retrospectively. We are currently evaluating the impact of adopting the new ASU on our consolidated financial statements and related disclosures.
We reviewed all other recently issued accounting pronouncements and concluded that they were either not applicable or not expected to have a significant impact to the consolidated financial statements.
2. Supplemental Balance Sheet Information
Prepaid expenses and other current assets were as follows:
| | | | | | | | | | | |
| December 31, |
| 2024 | | 2023 |
| Prepaid expenses | $ | 80,253 | | $ | 97,670 |
| Other current assets | 17,285 | | 19,792 |
| Prepaid expenses and other current assets | $ | 97,538 | | $ | 117,462 |
Leasehold improvements, property and equipment, net were as follows:
| | | | | | | | | | | |
| December 31, |
| 2024 | | 2023 |
| Land | $ | 12,943 | | $ | 12,943 |
| Leasehold improvements and buildings | 2,918,408 | | 2,595,866 |
| Furniture and fixtures | 293,841 | | 267,294 |
| Equipment | 1,221,290 | | 1,114,236 |
| Construction in Progress | 192,945 | | 161,721 |
| Leasehold improvements, property and equipment, gross | 4,639,427 | | 4,152,060 |
| Accumulated depreciation | (2,249,301) | | | (1,982,022) | |
| Leasehold improvements, property and equipment, net | $ | 2,390,126 | | $ | 2,170,038 |
Accrued payroll and benefits were as follows:
| | | | | | | | | | | |
| December 31, |
| 2024 | | 2023 |
| Workers' compensation liability | $ | 35,242 | | $ | 30,520 |
| Accrued payroll, bonuses and taxes | 195,660 | | 170,251 |
| Other accrued payroll and benefits | 31,011 | | 26,766 |
| Accrued payroll and benefits | $ | 261,913 | | $ | 227,537 |
Accrued liabilities were as follows:
| | | | | | | | | | | |
| December 31, |
| 2024 | | 2023 |
| Sales and use tax payable | $ | 47,206 | | $ | 42,071 |
| General, product and automobile insurance reserves | 34,404 | | 30,169 |
| Other accrued liabilities | 98,137 | | 75,448 |
| Accrued liabilities | $ | 179,747 | | $ | 147,688 |
3. Revenue Recognition
Gift Cards
The gift card liability included in unearned revenue on the consolidated balance sheets was as follows:
| | | | | | | | | | | |
| | December 31, |
| | 2024 | | 2023 |
| Gift card liability | $ | 181,771 | | | $ | 164,930 | |
Revenue recognized from the redemption of gift cards that was included in unearned revenue at the beginning of the year was as follows:
| | | | | | | | | | | | | | | | | |
| | Year ended December 31, |
| | 2024 | | 2023 | | 2022 |
| Revenue recognized from gift card liability balance at the beginning of the year | $ | 80,067 | | $ | 61,389 | | $ | 59,175 |
Chipotle Rewards
Changes in our Chipotle Rewards liability included in unearned revenue on the consolidated balance sheets were as follows:
| | | | | | | | | | | | | | | | | |
| | Year ended December 31, |
| | 2024 | | 2023 | | 2022 |
| Chipotle Rewards liability, beginning balance | $ | 44,750 | | $ | 38,057 | | $ | 25,572 |
| Revenue deferred | 164,986 | | 135,490 | | 121,406 |
| Revenue recognized | (152,930) | | | (128,797) | | | (108,921) | |
| Chipotle Rewards liability, ending balance | $ | 56,806 | | $ | 44,750 | | $ | 38,057 |
4. Fair Value Measurements
Assets and Liabilities Measured at Fair Value on a Recurring Basis
The carrying value of our cash and cash equivalents, restricted cash, accounts receivable and accounts payable approximate fair value because of their short-term nature.
The following tables show our cash, cash equivalents, and debt investments by significant investment category as of December 31, 2024 and 2023:
| | | | | | | | | | | | | | | | | | | | | | | | | | | | | | | | | | | | | | | | | |
| December 31, 2024 |
| Adjusted cost | | Unrealized Gains | | Unrealized Losses | | Fair Value | | Cash and Cash Equivalents | | Current Investments | | Long-term Investments |
| Cash | $ | 95,969 | | | $ | - | | | $ | - | | | $ | 95,969 | | | $ | 95,969 | | | $ | - | | | $ | - | |
| Level 1 | | | | | | | | | | | | | |
| Money market funds | 574,689 | | | - | | | - | | | 574,689 | | | 574,689 | | | - | | | - | |
| Time deposits | 77,879 | | | - | | | - | | | 77,879 | | | 77,879 | | | - | | | - | |
| U.S. Treasury securities | 1,404,777 | | | 4,831 | | | 693 | | | 1,408,915 | | | - | | | 635,392 | | | 769,385 | |
| Corporate debt securities | 48,210 | | | 116 | | | - | | | 48,326 | | | - | | | 34,736 | | | 13,474 | |
| Subtotal | 2,105,555 | | | 4,947 | | | 693 | | | 2,109,809 | | | 652,568 | | | 670,128 | | | 782,859 | |
| Level 3 | | | | | | | | | | | | | |
Corporate debt security(1) | 16,401 | | | 11 | | | - | | | 16,412 | | | - | | | 2,000 | | | 14,401 | |
Notes receivable(2) | 3,763 | | | 250 | | | - | | | 4,013 | | | - | | | 2,250 | | | 1,763 | |
| Subtotal | 20,164 | | | 261 | | | - | | | 20,425 | | | - | | | 4,250 | | | 16,164 | |
| Total | $ | 2,221,688 | | | $ | 5,208 | | | $ | 693 | | | $ | 2,226,203 | | | $ | 748,537 | | | $ | 674,378 | | | $ | 799,023 | |
| | | | | | | | | | | | | | | | | | | | | | | | | | | | | | | | | | | | | | | | | |
| December 31, 2023 |
| Adjusted cost | | Unrealized Gains | | Unrealized Losses | | Fair Value | | Cash and Cash Equivalents | | Current Investments | | Long-term Investments |
| Cash | $ | 128,458 | | | $ | - | | | $ | - | | | $ | 128,458 | | | $ | 128,458 | | | $ | - | | | $ | - | |
| Level 1 | | | | | | | | | | | | | |
| Money market funds | 355,872 | | | - | | | - | | | 355,872 | | | 355,872 | | | - | | | - | |
| Time deposits | 76,279 | | | - | | | - | | | 76,279 | | | 76,279 | | | - | | | - | |
| U.S. Treasury securities | 1,200,658 | | | 4,352 | | | 4,083 | | | 1,200,927 | | | - | | | 731,339 | | | 469,319 | |
| Corporate debt securities | 19,755 | | | 13 | | | 7 | | | 19,761 | | | - | | | - | | | 19,755 | |
| Subtotal | 1,652,564 | | | 4,365 | | | 4,090 | | | 1,652,839 | | | 432,151 | | | 731,339 | | | 489,074 | |
| Level 3 | | | | | | | | | | | | | |
Corporate debt security(1) | 17,401 | | | - | | | 27 | | | 17,374 | | | - | | | 999 | | | 16,402 | |
Notes receivable(2) | 14,500 | | | 1,289 | | | 141 | | | 15,648 | | | - | | | 2,500 | | | 13,148 | |
| Subtotal | 31,901 | | | 1,289 | | | 168 | | | 33,022 | | | - | | | 3,499 | | | 29,550 | |
| Total | $ | 1,812,923 | | | $ | 5,654 | | | $ | 4,258 | | | $ | 1,814,319 | | | $ | 560,609 | | | $ | 734,838 | | | $ | 518,624 | |
(1)The fair value of the corporate debt security is measured using Level 3 (unobservable) inputs. We determined the fair value for the corporate debt security using an internally-developed valuation model and unobservable inputs include credit and liquidity spreads and effective maturity.
(2)We have elected to measure our investment in convertible notes receivable of private companies at fair value under the fair value option. The fair value of the notes receivable are measured using Level 3 (unobservable) inputs. We determined the fair value for the notes receivable using an internally-developed valuation model and unobservable inputs include estimates of the equity value of the underlying business and the timing and probability of future financing events.
Assets and Liabilities Measured at Fair Value on a Nonrecurring Basis
Assets recognized or disclosed at fair value on the consolidated financial statements on a nonrecurring basis include items such as leasehold improvements, property and equipment, certain long-term investments, operating lease assets, other assets, and goodwill. These assets are measured at fair value whenever events or changes in circumstances indicate that the carrying amount of an asset may not be recoverable or if there has been an observable price change of a non-marketable equity security.
For the years ended December 31, 2024, 2023 and 2022, nonrecurring fair value measurements resulting in asset impairments were not material.
5. Equity Investments
| | | | | | | | | | | |
| | December 31, |
| | 2024 | | 2023 |
| Equity method investments | $ | 28,097 | | $ | 8,896 |
| Other investments | 69,002 | | 45,864 |
| Total | $ | 97,099 | | $ | 54,760 |
Equity Method Investments
As of December 31, 2024, and December 31, 2023, we owned 6,487 and 4,325 shares of common stock of Tractor Beverages, Inc. (“Tractor”). As of December 31, 2024, our investment represents ownership of approximately 13.8% of Tractor, and we have invested total cash consideration of $14,872. As we are a significant customer of Tractor and maintain board representation, we are accounting for our investment under the equity method. There were no impairment charges for the years ended December 31, 2024, 2023 or 2022, associated with this equity method investment. The investment in common stock is included within other assets on the consolidated balance sheets with a carrying value of $18,097 and $8,896 as of December 31, 2024 and December 31, 2023, respectively. Refer to Note 13. “Related Party Transactions” for related party disclosures. Other Investments
As of December 31, 2024, we held 5,819 shares of the Series B Preferred Stock of Hyphen. Hyphen is a privately held company, and as such, the preferred shares comprising our investment are illiquid and fair value is not readily determinable. As of December 31, 2024, we have recognized a cumulative gain of $6,782 related to our investment in Hyphen. The investment is included within long-term investments on the consolidated balance sheet with a carrying value of $31,782 as of December 31, 2024.
As of December 31, 2024, we owned 766 shares of the Series C Preferred Stock of Nuro, Inc. (“Nuro”). Our investment represents a minority interest and we have determined that we do not have significant influence over Nuro. Nuro is a privately held company, and as such, the preferred shares comprising our investment are illiquid and fair value is not readily determinable. As of December 31, 2024, we have recognized a cumulative gain of $5,968 related to our investment in Nuro due to observable transactions in prior periods. The investment is included within long-term investments on the consolidated balance sheets with a carrying value of $15,968 as of December 31, 2024 and December 31, 2023, respectively.
As of December 31, 2024, we held additional investments in other entities through the Cultivate Next Fund. These additional investments are included within long-term investments on the consolidated balance sheets with a carrying value of $21,252 and $21,221 as of December 31, 2024 and December 31, 2023, respectively.
6. Income Taxes
Income before income taxes, classified by source of income, was as follows:
| | | | | | | | | | | | | | | | | |
| Year ended December 31, |
| 2024 | | 2023 | | 2022 |
| Domestic | $ | 2,031,759 | | $ | 1,637,756 | | $ | 1,192,004 |
| Foreign | (21,529) | | | (17,250) | | | (10,473) | |
| Income before income taxes | $ | 2,010,230 | | $ | 1,620,506 | | $ | 1,181,531 |
The components of the provision for income taxes were as follows:
| | | | | | | | | | | | | | | | | |
| Year ended December 31, |
| 2024 | | 2023 | | 2022 |
| Current tax: | | | | | |
| U.S. Federal | $ | 412,943 | | | $ | 314,757 | | | $ | 246,210 |
| U.S. State and Local | 104,478 | | | 85,355 | | | 79,041 | |
| Foreign | 1,636 | | | 1,162 | | | 374 | |
| 519,057 | | | 401,274 | | | 325,625 |
| Deferred tax: | | | | | |
| U.S. Federal | (32,751) | | (7,992) | | (23,502) | |
| U.S. State and Local | (10,195) | | (1,532) | | | (19,940) |
| Foreign | (4,385) | | | (7,606) | | 3,771 |
| (47,331) | | (17,130) | | (39,671) | |
| Valuation allowance | 4,394 | | 7,625 | | | (3,524) | |
| Provision for income taxes | $ | 476,120 | | | $ | 391,769 | | | $ | 282,430 | |
The effective tax rate differs from the statutory tax rates as follows:
| | | | | | | | | | | | | | | | | |
| Year ended December 31, |
| 2024 | | 2023 | | 2022 |
| Statutory U.S. federal income tax rate | 21.0% | | 21.0% | | 21.0% |
| State income tax, net of related federal income tax benefit | 3.7 | | 4.0 | | 3.8 |
| Federal tax credits | (0.9) | | | (1.0) | | | (1.0) | |
| Executive compensation disallowed | 0.5 | | 0.8 | | 0.8 |
| Valuation allowance | 0.3 | | 0.3 | | 0.2 |
| Uncertain tax position reserves | - | | 0.4 | | 0.3 |
| Other | 0.2 | | 0.2 | | 0.6 |
| Return to provision and other discrete items | (0.1) | | | (0.2) | | | (0.1) |
| Equity compensation related adjustments | (1.0) | | | (1.3) | | | (1.7) | |
| | | | | |
| Effective income tax rate | 23.7% | | 24.2% | | 23.9% |
The effective tax rate for the year ended December 31, 2024, was lower than the effective tax rate for the year ended December 31, 2023, primarily due to a decrease in nondeductible expenses and income tax reserves, partially offset by a reduction in excess tax benefits related to option exercises and equity vesting.
The components of the deferred income tax assets and liabilities for continuing operations were as follows:
| | | | | | | | | | | |
| December 31, |
| 2024 | | 2023 |
| Deferred income tax liability: | | | |
| Leasehold improvements, property and equipment, net | $ | 262,692 | | $ | 272,017 |
| Goodwill and other assets | 1,753 | | 1,743 |
| Operating lease assets | 1,088,934 | | 972,835 |
| Total deferred income tax liability | 1,353,379 | | 1,246,595 |
| Deferred income tax asset: | | | |
| Gift card liability | 19,087 | | 18,101 |
| Capitalized transaction costs | 323 | | 323 |
| Stock-based compensation and other employee benefits | 61,574 | | 50,954 |
| Foreign net operating loss carry-forwards | 35,215 | | 32,252 |
| State credits | 872 | | 1,838 |
| Operating lease liabilities | 1,159,788 | | 1,038,911 |
| Allowances, reserves and other | 26,105 | | 12,870 |
| Capitalized research costs | 29,122 | | 25,990 |
| Prepaid assets and other | 10,334 | | 6,637 |
| State net operating loss carry-forwards | 3,867 | | 4,332 |
| Valuation allowance | (39,116) | | | (34,722) | |
| Total deferred income tax asset | 1,307,171 | | 1,157,486 |
| Deferred income tax liabilities | $ | 46,208 | | $ | 89,109 |
Gross foreign net operating losses (“NOLs”) were $165,085 and $149,891 as of December 31, 2024 and 2023, respectively. Our foreign NOLs can be carried forward indefinitely.
Gross state NOLs available across all jurisdictions in which we operate were $52,950 and $62,492 as of December 31, 2024 and 2023, respectively. Our state NOLs expire over varying intervals in the future.
We had gross valuation allowances against certain foreign deferred tax assets of $183,346 and $160,607 as of December 31, 2024 and 2023, respectively. The increase in the valuation allowances were primarily related to net operating losses of consolidated foreign subsidiaries.
Unrecognized Tax Benefits
A reconciliation of the unrecognized tax benefits was as follows:
| | | | | | | | | | | | | | | | | |
| Year ended December 31, |
| 2024 | | 2023 | | 2022 |
| Beginning of year | $ | 16,488 | | $ | 8,902 | | $ | 5,262 |
| Increase resulting from prior year tax positions | 3,737 | | 7,561 | | 3,937 |
| Decrease resulting from prior year tax positions | (3,748) | | | (295) | | - | |
| Increase resulting from current year tax positions | 916 | | 783 | | 312 |
| Settlements with taxing authorities | - | | | (6) | | - |
| Lapsing of statutes of limitations | (505) | | | (457) | | | (609) | |
| End of year | $ | 16,888 | | $ | 16,488 | | $ | 8,902 |
Interest expense related to uncertain tax positions is recognized in interest and other income, net on the consolidated statements of income and comprehensive income. Penalties related to uncertain tax positions are recognized in provision for income taxes on the consolidated statements of income and comprehensive income. For the years ended December 31, 2024, 2023 and 2022, we recognized $1,441, $1,541 and $384, respectively, in interest expense related to uncertain tax positions. These are gross amounts before any tax benefits and are included in other liabilities on the consolidated balance sheets. As of December 31, 2024 and 2023, we have accrued interest of $2,959 and $2,026, respectively.
We were subject to an examination by the Internal Revenue Service (“IRS”) for our U.S. income tax returns for the tax year ended December 31, 2020. As a result of the examination, the IRS has issued an immaterial assessment of income taxes, interest, and penalties.
For the majority of states where we have a significant presence, we are no longer subject to tax examinations by tax authorities for tax years before 2020. Currently, we expect expirations of statutes of limitations, excluding indemnified amounts, on reserves of approximately $3,035 within the next twelve months.
It is reasonably possible the amount of the unrecognized benefit with respect to certain unrecognized positions could significantly increase or decrease within the next twelve months and would have an impact on net income.
7. Shareholders’ Equity
We have had a stock repurchase program in place since 2008. As of December 31, 2024, we had $1,028,342 authorized for repurchasing shares of our common stock, which includes $300,000 in additional authorizations approved by our Board of Directors on December 17, 2024. Prior to June 26, 2024, shares we repurchased were held in treasury stock until they were reissued or retired at the discretion of our Board of Directors. Beginning on June 26, 2024, all shares of common stock that we repurchase are immediately retired and not held as treasury stock.
During the second quarter of 2024, we retired 507,166 shares of its common stock that were being held as treasury stock. The retirement resulted in a reduction of $5,194,196 in treasury stock, $5,072 in the par value of common stock, and $5,189,124 in retained earnings.
During the years ended December 31, 2024, 2023 and 2022, shares of common stock at a total cost of $74,229, $69,146, and $98,970, respectively, were netted and surrendered as payment for minimum statutory withholding obligations in connection with the vesting of outstanding stock awards. Shares surrendered by the participants in accordance with the applicable award agreements and plan are deemed repurchased by us but are not part of publicly announced share repurchase programs.
8. Stock-Based Compensation and Employee Benefit Plans
Pursuant to the 2022 Stock Incentive Plan, we grant stock options, SOSARs, RSUs, or PSUs to employees and non-employee directors. We issue shares of common stock upon the exercise of stock options and SOSARs, and the vesting of RSUs and PSUs.
We also have an employee stock purchase plan (“ESPP”), 401(k) Defined Contribution Plan, and a Deferred Compensation Plan.
Stock-Based Compensation
Under the 2022 Stock Incentive Plan, 121,571 shares of common stock have been authorized and reserved for issuance to eligible participants, of which 105,569 shares were authorized for issuance but not issued or subject to outstanding awards as of December 31, 2024. For purposes of calculating the available shares remaining, each share issuable pursuant to outstanding full value awards, such as RSUs and PSUs, count as two shares, and each share underlying a stock option or SOSAR count as one share.
On August 31, 2024 our now former CEO terminated employment with the company and forfeited all of his unvested equity awards, resulting in a reversal of expense of $27,863. In response to the CEO departure, we granted retention RSUs to key executives. These awards have various vesting terms, and will vest over one, two or three years. Total expense recognized for the retention RSUs for the year ended December 31, 2024 was $17,080. The impact of the CEO forfeiture and employee retention awards are reflected in the tables below.
Total stock-based compensation expense was as follows:
| | | | | | | | | | | | | | | | | |
| | Year ended December 31, |
| | 2024 | | 2023 | | 2022 |
| Stock-based compensation | $ | 134,635 | | $ | 126,686 | | $ | 99,821 |
| Stock-based compensation, net of income taxes | $ | 109,996 | | $ | 107,210 | | $ | 84,928 |
| Total capitalized stock-based compensation included in leasehold improvements, property and equipment, net on the consolidated balance sheets | $ | 2,905 | | $ | 2,670 | | $ | 1,791 |
| Excess tax benefit on stock-based compensation recognized in provision for income taxes on the consolidated statements of income and comprehensive income | $ | 23,419 | | $ | 25,437 | | $ | 24,689 |
SOSARs
A summary of SOSAR activity was as follows (in thousands, except years and per share data):
| | | | | | | | | | | | | | | | | | | | | | | |
| Shares | | Weighted-Average Exercise Price per
Share | | Weighted-Average Remaining
Contractual Life (Years) | | Aggregate Intrinsic Value |
| Outstanding, January 1, 2024 | 14,738 | | $ | 26.05 | | 4.4 | | $ | 290,156 |
| Granted | 2,533 | | 53.04 | | | | |
| Exercised | (5,077) | | 21.83 | | | | |
| Forfeited | (1,780) | | 38.56 | | | | |
| Outstanding, December 31, 2024 | 10,414 | | 32.53 | | 4.2 | | 289,373 |
| Exercisable, December 31, 2024 | 4,152 | | 22.88 | | 2.6 | | 155,371 |
| Vested and expected to vest, December 31, 2024 | 9,997 | | 32.07 | | 4.1 | | 282,450 |
The total intrinsic value of SOSARs exercised during the years ended December 31, 2024, 2023 and 2022, was $177,274, $142,830, and $77,124, respectively. Unrecognized stock-based compensation expense for SOSARs as of December 31, 2024 was $22,865 and is expected to be recognized over a weighted-average period of 1.5 years. SOSARs expire 7 years after the day they were granted.
The weighted-average assumptions utilized in the Black-Scholes option-pricing model to estimate the fair value of SOSARs granted each year were as follows:
| | | | | | | | | | | | | | | | | |
| 2024 | | 2023 | | 2022 |
| Risk-free interest rate | 4.2% | | 4.1% | | 2.1% |
| Expected life (years) | 3.6 | | 3.6 | | 3.6 |
| Expected dividend yield | 0.0% | | 0.0% | | 0.0% |
| Volatility | 35.7% | | 36.4% | | 36.0% |
| Weighted-average Black-Scholes fair value per share at date of grant | $ | 16.98 | | $ | 10.60 | | $ | 9.13 |
The risk-free interest rate is based on U.S. Treasury rates for instruments with similar terms, and the expected life assumption is based on our historical data. We have not paid dividends to date and do not plan to pay dividends in the near future. The volatility assumption is based on our historical data and implied volatility.
Non-Vested Stock Awards (RSUs)
A summary of RSU award activity was as follows (in thousands, except per share data):
| | | | | | | | | | | |
| Shares | | Weighted-Average Grant Date Fair Value
per Share |
| Outstanding, January 1, 2024 | 3,002 | | $ | 32.08 | |
| Granted | 2,615 | | 53.67 | |
| Vested | (948) | | 31.96 | |
| Forfeited | (322) | | 39.58 | |
| Outstanding, December 31, 2024 | 4,347 | | 44.54 | |
| Vested and expected to vest, December 31, 2024 | 3,919 | | 44.21 | |
The weighted-average grant date fair value per RSU granted during the years ended December 31, 2023 and 2022, was $33.32 and $31.19, respectively. Unrecognized stock-based compensation expense for non-vested RSU stock awards we have determined are probable of vesting was $88,093 as of December 31, 2024, and is expected to be recognized over a weighted-average period of 1.3 years. The fair value of shares earned as of the vesting date during the years ended December 31, 2024, 2023 and 2022, was $49,672, $39,464, and $33,959, respectively.
Non-Vested Performance Stock Awards (PSUs)
A summary of PSU award activity was as follows (in thousands, except per share data):
| | | | | | | | | | | |
| Shares | | Weighted-Average Grant Date Fair
Value per Share |
| Outstanding, January 1, 2024 | 2,794 | | $ | 31.24 |
| Granted | 866 | | 52.90 |
| Vested | (777) | | 29.59 |
| Forfeited | (838) | | 37.89 |
| Outstanding, December 31, 2024 | 2,045 | | 38.32 |
| Vested and expected to vest, December 31, 2024* | 3,649 | | 37.78 |
*The vested and expected to vest total above represents outstanding base PSUs, adjusted for expected payout amounts in line with current and future estimated performance levels.
The weighted-average fair value per PSU granted during the years ended December 31, 2023 and 2022, was $32.14 and $31.39, respectively. The unrecognized stock-based compensation expense for non-vested PSU stock awards we have determined are probable of vesting was $50,157 as of December 31, 2024, and is expected to be recognized over a weighted-average period of 2.2 years. The fair value of shares earned as of the vesting date during the years ended December 31, 2024, 2023 and 2022, was $113,181, $110,794, and $177,293, respectively.
During the years ended December 31, 2024 and December 31, 2023, we awarded performance share awards that are subject to service, market, and performance vesting conditions. The quantity of shares that vest will range from 0% to 300% of the targeted number of shares based on performance factors related to restaurant cash flow dollars earned over three-year periods beginning on January 1, 2024 and January 1, 2023, and gross new restaurant openings over the same three-year periods. If the defined minimum targets are not met, then no shares will vest. Further, in no event may more than 100% of the target number of PSUs vest if our 3-year total shareholder return is below the 25th percentile of the constituent companies comprising the S&P 500 on the days of the grants.
During the year ended December 31, 2022, we awarded performance share awards that are subject to service, market, and performance vesting conditions. The quantity of shares that vest will range from 0% to 300% of the targeted number of shares based on performance factors related to restaurant cash flow dollars earned over a three-year period beginning on January 1, 2022. If the defined minimum targets are not met, then no shares will vest. Further, in no event may more than 100% of the target number of PSUs vest if our 3-year total shareholder return is below the 25th percentile of the constituent companies comprising the S&P 500 on the day of the grant.
Employee Stock Purchase Plan
We also offer an ESPP. Employees become eligible to participate in the program after one year of service with Chipotle and may contribute up to 15% of their earnings, subject to an annual maximum dollar amount. The ESPP provides a quarterly offering period to purchase our common stock at a price of 92.5% of the lower of the fair market value on the first and last trading days of each offering period. A total of 12,500 shares were authorized for issuance within the ESPP, of which 12,311 were available for issuance as of December 31, 2024. For the years ended December 31, 2024, 2023 and 2022, the number of shares issued under the ESPP were 78, 79, and 32, respectively.
Employee Benefit Plans
401(k) Defined Contribution Plan
We maintain the Chipotle Mexican Grill 401(k) Plan (“401(k) Plan”) for eligible U.S.-based employees. The 401(k) Plan allows participants to make cash contributions from payroll deductions. Employees become eligible to receive matching contributions after one year, and at least 1,000 hours, of service with Chipotle. We match 100% of the first 3% of pay contributed by each eligible employee and 50% on the next 2% of pay contributed each pay period (with an annual true-up) through cash contributions. For the years ended December 31, 2024, 2023 and 2022, matching contributions totaled approximately $16,523, $13,821, and $12,923, respectively, and are included in general and administrative expenses and labor dependent on employee classification on the consolidated statements of income and comprehensive income. Certain subsidiaries outside the U.S. also offer other similar benefits and are immaterial to the consolidated statements of income and comprehensive income.
Deferred Compensation Plan
We also maintain the Chipotle Mexican Grill, Inc. Supplemental Deferred Investment Plan (the “Deferred Plan”) for eligible employees. The Deferred Plan is a non-qualified plan that allows participants to make tax-deferred contributions that cannot be made under the 401(k) Plan because of Internal Revenue Service limitations. Participants’ earnings on contributions made to the Deferred Plan fluctuate with the actual earnings and losses of a variety of available investment choices selected by the participant. Total obligations under the Deferred Plan as of December 31, 2024 and 2023 were $36,509 and $27,178, respectively, and are included in other liabilities on the consolidated balance sheets and were fully funded as of December 31, 2024. We match 100% of the first 3% of pay contributed by each eligible employee and 50% on the next 2% of pay contributed once the 401(k) contribution limits are reached.
The following table summarizes estimated current and long-term material cash requirements for our deferred compensation plan as of December 31, 2024:
| | | | | | | | | | | | | | | | | | | | | | | | | | | | | |
| Payments Due by Fiscal Year |
| Total | | 2025 | | 2026-2027 | | 2028-2029 | | Thereafter |
Deferred compensation(1) | $ | 36,509 | | $ | 7,172 | | $ | 8,763 | | $ | 8,055 | | $ | 12,518 |
(1)Includes scheduled payments from our deferred compensation plan where payment dates are determinable for employed participants in accordance with the account’s election, and the assumption that active participants will retire at the age of 65 and begin distributions from their accounts at that time. This does not include future contributions, investment earnings, or future participants. Timing and amounts of payments may vary significantly.
9. Leases
The weighted-average remaining lease term and discount rate were as follows:
| | | | | | | | | | | |
| December 31, |
| 2024 | | 2023 |
| Weighted-average remaining lease term (years) | 13.9 | | 13.7 |
| Weighted-average discount rate | 5.30 | % | | 5.10 | % |
The components of lease cost were as follows:
| | | | | | | | | | | | | | | | | | | | |
| | Year ended December 31, |
| Classification | 2024 | | 2023 | | 2022 |
| Operating lease cost | Occupancy, Other operating costs, General and administrative expenses and Pre-opening costs | $ | 486,598 | | $ | 436,313 | | $ | 397,112 |
| Short-term lease cost | Other operating costs | 572 | | 519 | | 633 |
| Variable lease cost | Occupancy, Other operating costs, General and administrative expenses and Pre-opening costs | 120,948 | | 111,896 | | 102,636 |
| Sublease income | General and administrative expenses | (3,559) | | | (4,765) | | | (5,444) | |
| Total lease cost | | $ | 604,559 | | $ | 543,963 | | $ | 494,937 |
Supplemental disclosures of cash flow information related to leases were as follows:
| | | | | | | | | | | | | | | | | |
| | Year ended December 31, |
| | 2024 | | 2023 | | 2022 |
| Cash paid for operating lease liabilities | $ | 466,171 | | $ | 421,591 | | $ | 386,238 |
| Operating lease assets obtained in exchange for operating lease liabilities | $ | 692,684 | | $ | 521,759 | | $ | 425,243 |
| Derecognition of operating lease assets due to terminations or impairment | $ | 6,899 | | $ | 6,862 | | $ | 14,718 |
Maturities of lease liabilities were as follows as of December 31, 2024:
| | | | | |
| Operating Leases |
| 2025 | $ | 464,795 |
| 2026 | 507,341 |
| 2027 | 499,428 |
| 2028 | 484,473 |
| 2029 | 467,981 |
| Thereafter | 4,133,853 |
| Total lease payments | 6,557,871 |
| Less: imputed interest | 2,017,253 |
| Operating lease liabilities (Current and Long-Term) | $ | 4,540,618 |
As of December 31, 2024, the total lease payments include $2,759,141 related to options to extend lease terms that are reasonably certain of being exercised and exclude approximately $646,462 of legally binding lease payments for leases signed but not yet commenced and $11,419 of future sublease income.
10. Earnings Per Share
The following table sets forth the computations of basic and diluted earnings per share:
| | | | | | | | | | | | | | | | | |
| | Year ended December 31, |
| | 2024 | | 2023 | | 2022 |
| Net income | $ | 1,534,110 | | $ | 1,228,737 | | $ | 899,101 |
| Shares: | | | | | |
| Weighted-average number of common shares outstanding (for basic calculation) | 1,368,343 | | 1,377,768 | | 1,392,543 |
| Dilutive stock awards | 8,212 | | 7,732 | | 10,534 |
| Weighted-average number of common shares outstanding (for diluted calculation) | 1,376,555 | | 1,385,500 | | 1,403,077 |
| Basic earnings per share | $ | 1.12 | | $ | 0.89 | | $ | 0.65 |
| Diluted earnings per share | $ | 1.11 | | $ | 0.89 | | $ | 0.64 |
The following stock awards were excluded from the calculation of diluted earnings per share:
| | | | | | | | | | | | | | | | | |
| | Year ended December 31, |
| | 2024 | | 2023 | | 2022 |
| Stock awards subject to performance conditions | 2,179 | | 2,517 | | 2,701 |
| Stock awards that were antidilutive | 2,210 | | 3,565 | | 8,149 |
| Total stock awards excluded from diluted earnings per share | 4,389 | | 6,082 | | 10,850 |
11. Commitments and Contingencies
Purchase Obligations
We enter into various purchase obligations in the ordinary course of business, generally of a short-term nature. Those that are binding primarily relate to commitments for food purchases and supplies, capital projects, corporate assets, information technology, marketing initiatives and corporate sponsorships, and other miscellaneous items.
Litigation
We are involved in various claims and legal actions, such as wage and hour, wrongful termination and other employment-related claims, slip and fall and other personal injury claims, advertising and consumer claims, privacy claims, and lease, construction and other commercial disputes, that arise in the ordinary course of business, some of which may be covered by insurance. The outcomes of these actions are not predictable, but we do not believe that the ultimate resolution of any pending or threatened actions of these types will have a material adverse effect on our financial position, results of operations, liquidity, or capital resources. However, if there is a significant increase in the number of these claims, or if we incur greater liabilities than we currently anticipate under one or more claims, it could materially and adversely affect our business, financial condition, results of operations and cash flows.
Shareholder Actions
On November 11, 2024, Michael Stradford filed a complaint in the U.S. District Court for the Central District of California on behalf of a purported class of purchasers of shares of Chipotle common stock between February 8, 2024 and October 29, 2024. The complaint purports to state claims against Chipotle, former Chief Executive Officer Brian Niccol, and President and Chief Strategy Officer Jack Hartung, who served during the majority of the claimed class period as Chief Financial and Administrative Officer. The complaint asserts claims arising under Sections 10(b) and 20(a) of the Exchange Act and related rules and regulations, based on Chipotle’s alleged failure during the claimed class period to disclose that (1) Chipotle’s entrée portion sizes were inconsistent and allegedly left many guests dissatisfied; (2) in order to address the issue and retain guest loyalty, Chipotle would have to ensure more generous portion sizes, which would increase costs; and (3) as a result, the defendants’ statements about Chipotle's business, operations, and prospects were materially false and misleading. The complaint asserts that as a result, the market price of Chipotle’s stock was artificially inflated during the claimed class period. The complaint seeks damages on behalf of the purported class in an unspecified amount, interest, an award of reasonable costs and attorneys’ fees, and other relief as determined appropriate by the court.
On December 10, 2024, Anand Roy filed a shareholder derivative action in the U.S. District Court for the Central District of California alleging that the defendants, members of Chipotle’s Board of Directors and President and Chief Strategy Officer breached their fiduciary duties by making or allowing Chipotle to make allegedly false and misleading statements substantially the same as those alleged in the Stradford matter described above. The complaint further alleges that the defendants breached their fiduciary duties by causing Chipotle to repurchase stock at inflated prices and by engaging in improper insider sales of Chipotle stock. On December 17, 2024, Daniel Rodriguez filed a shareholder derivative action against the same defendants in the same court, making allegations substantially the same as those in the Roy complaint. Each of these actions purports to state a claim for damages on behalf of Chipotle and is based on statements in the company’s SEC filings and related public disclosures, and seeks damages, including punitive damages, in an unspecified amount as well as interest, an award of reasonable costs and attorneys’ fees, and other relief as determined appropriate by the court. On January 23, 2025, the Roy and Rodriguez actions were consolidated into a single derivative lawsuit captioned In re Chipotle Mexican Grill, Inc. Stockholder Derivative Litigation.
Chipotle intends to defend all of these cases vigorously, but it is not possible at this time to reasonably estimate the outcome of or any potential liability from these cases.
Accrual for Estimated Liability
In relation to various legal matters, we had an accrued legal liability balance of $19,465 and $7,640 included within accrued liabilities on the consolidated balance sheets as of December 31, 2024 and 2023, respectively.
12. Debt
As of December 31, 2024, we had a $500,000 revolving credit facility with JPMorgan Chase Bank (“JPMorgan”) as administrative agent. Borrowings on the credit facility bear interest at a rate equal to the Secured Overnight Financing Rate (“SOFR”) plus 1.475%, which is subject to increase due to changes in our total leverage ratio as defined in the credit agreement. We are also obligated to pay a commitment fee of 0.175% per year for unused amounts under the credit facility, which also may increase due to changes in our total leverage ratio. Further, we are subject to certain covenants defined in the credit agreement, which include maintaining a total leverage ratio of less than 3.0x, maintaining a consolidated fixed charge coverage ratio of greater than 1.5x, and limiting us from incurring additional indebtedness in certain circumstances. We had no outstanding borrowings under the credit facility and were in compliance with all covenants as of December 31, 2024 and December 31, 2023, respectively.
13. Related Party Transactions
As of December 31, 2024, we owned approximately 13.8% of the common stock outstanding of Tractor. As we are a significant customer of Tractor and maintain board representation, we are accounting for our investment under the equity method. Accordingly, we have identified Tractor as a related party. We purchase product from the supplier for sale to guests in our restaurants. During the years ended December 31, 2024, 2023 and 2022, purchases from the supplier were $49,323, $43,555, and $37,015, respectively.
We are an investor in Vebu Inc. (“Vebu”), a developer of restaurant automation technology. As we are a significant customer of Vebu and maintain board representation, we have determined that Vebu is a related party. Our investment, which is comprised of preferred shares, is accounted for as a non-marketable equity investment and is included within long-term investments on the consolidated balance sheet. During the years ended December 31, 2024, 2023 and 2022, purchases from Vebu were $957, $991, and $840, respectively.
14. Segment Reporting
Segment information is prepared on the same basis that our CEO, who is our Chief Operating Decision Maker ("CODM"), manages our segments, evaluates financial results, and makes key operating decisions. We have one reportable operating segment: U.S.
The U.S. reportable operating segment is comprised of all ten operating segments located in the United States, which we have aggregated to a single operating segment in consideration of the aggregation criteria set forth in ASC 280. All other operating segments, which comprise our operations in Canada, Europe and international licensed restaurants do not meet the quantitative thresholds for determining reportable segments.
The U.S. reportable segment derives its revenue from company-owned restaurants located in the United States, which serve a relevant menu of burritos, burrito bowls (a burrito without the tortilla), quesadillas, tacos, and salads. No guest accounts for 10% or more of our revenues. The accounting policies of the U.S. reportable segment are the same as those described in Note 1. "Description of Business and Summary of Significant Accounting Policies". Our CODM uses income from operations to evaluate performance and make key operating decisions, such as deciding the rate at which we invest resources into the U.S segment versus other parts of the Company. The CODM is not provided asset information by reportable segment as asset information is provided to the CODM on a consolidated basis.
The following tables present selected financial information with respect to our single reportable segment:
| | | | | | | | | | | | | | | | | |
| Year ended December 31, |
| U.S. segment | 2024 | | 2023 | | 2022 |
| Food and beverage revenue | $ | 11,045,450 | | $ | 9,652,976 | | $ | 8,439,674 |
| Delivery service revenue | 66,282 | | 67,393 | | 76,536 |
| U.S. segment total revenue | 11,111,732 | | 9,720,369 | | 8,516,210 |
| | | | | |
| Reconciliation: | | | | | |
All other revenue(1) | 202,121 | | 151,280 | | 118,442 |
| Total consolidated revenue | $ | 11,313,853 | | | $ | 9,871,649 | | | $ | 8,634,652 | |
| | | | | | | | | | | | | | | | | |
| Year ended December 31, |
| 2024 | | 2023 | | 2022 |
| U.S. segment total revenue | $ | 11,111,732 | | $ | 9,720,369 | | $ | 8,516,210 |
| | | | | |
| Less: | | | | | |
| Food, beverage and packaging | 3,299,295 | | 2,853,651 | | 2,556,657 |
| Labor | 2,741,590 | | 2,402,964 | | 2,168,994 |
| Occupancy | 548,688 | | 491,757 | | 450,684 |
| Marketing | 283,053 | | 261,358 | | 248,319 |
| Other operating costs, excluding marketing | 1,254,512 | | 1,141,850 | | 1,045,025 |
| Depreciation and amortization | 300,513 | | 282,521 | | 253,904 |
Other segment items(2) | 55,482 | | 64,150 | | 48,019 |
| U.S. segment income from operations | 2,628,599 | | 2,222,118 | | 1,744,608 |
| | | | | |
| Reconciliation: | | | | | |
Corporate and other unallocated expenses(3) | 709,426 | | 657,134 | | 574,572 |
Other loss from operations(4) | (2,840) | | (7,171) | | (9,633) |
| Interest and other income, net | 93,897 | | 62,693 | | 21,128 |
| Total consolidated income before income taxes | $ | 2,010,230 | | | $ | 1,620,506 | | | $ | 1,181,531 | |
(1)All other revenue represents sales within our company-owned stores in Canada, Europe and royalty revenue from our international licensed restaurants.
(2)Other segment items consist of pre-opening costs, impairment, closure costs, and asset disposals related to the U.S. segment.
(3)Corporate and other unallocated expenses represent corporate overhead expenses that have not been allocated to any segment for reporting purposes including general and administrative expenses.
(4)Amounts reflect the net loss from operations related to our operations in Canada, Europe and international licensed restaurants.
The Company's long-lived tangible assets, including the Company's operating lease assets recognized on the consolidated balance sheets were located as follows:
| | | | | | | | | | | |
| December 31, |
| 2024 | | 2023 |
| United States | 6,247,406 | | | 5,637,230 | |
| International | 142,847 | | | 111,356 | |
ITEM 9. CHANGES IN AND DISAGREEMENTS WITH ACCOUNTANTS ON ACCOUNTING AND FINANCIAL DISCLOSURE
None.
ITEM 9A. CONTROLS AND PROCEDURES
We maintain disclosure controls and procedures (as defined in Rule 13a-15(e) promulgated under the Securities Exchange Act of 1934, as amended (the “Exchange Act”)) that are designed to ensure that information required to be disclosed in Exchange Act reports is recorded, processed, summarized and reported within the time periods specified in the Securities and Exchange Commission’s rules and forms, and that such information is accumulated and communicated to our management, including our Chief Executive Officer and Chief Financial Officer, as appropriate, to allow timely decisions regarding required disclosure.
Evaluation of Disclosure Controls and Procedures
As of December 31, 2024, we carried out an evaluation, under the supervision and with the participation of our management, including our Chief Executive Officer and Chief Financial Officer, of the effectiveness of the design and operation of our disclosure controls and procedures. Based on the foregoing, our Chief Executive Officer and Chief Financial Officer concluded that our disclosure controls and procedures were effective as of the end of the period covered by this annual report.
Changes in Internal Control over Financial Reporting
There were no changes during the fiscal quarter ended December 31, 2024 in our internal control over financial reporting (as defined in Rule 13a-15(f) under the Exchange Act) that have materially affected or are reasonably likely to materially affect our internal control over financial reporting.
Management’s Annual Report on Internal Control over Financial Reporting
The management of Chipotle Mexican Grill, Inc. is responsible for establishing and maintaining adequate internal control over financial reporting. Our internal control over financial reporting is a process designed to provide reasonable assurance regarding the reliability of financial reporting and the preparation of financial statements for external purposes in accordance with accounting principles generally accepted in the United States of America. Our internal control over financial reporting includes those policies and procedures that (i) pertain to the maintenance of records that, in reasonable detail, accurately and fairly reflect the transactions and dispositions of our assets; (ii) provide reasonable assurance that transactions are recorded as necessary to permit preparation of financial statements in accordance with accounting principles generally accepted in the United States of America, and that our receipts and expenditures are being made only in accordance with authorizations of our management and directors; and (iii) provide reasonable assurance regarding prevention or timely detection of unauthorized acquisition, use, or disposition of assets that could have a material effect on our financial statements.
Because of its inherent limitations, internal control over financial reporting may not prevent or detect misstatements. Also, projections of any evaluation of effectiveness to future periods are subject to the risk that controls may become inadequate because of changes in conditions, or that the degree of compliance with the policies or procedures may deteriorate.
Management assessed the effectiveness of our internal control over financial reporting as of December 31, 2024, based on the framework set forth by the Committee of Sponsoring Organizations of the Treadway Commission in Internal Control—Integrated Framework (the “2013 framework”). Based on that assessment, management concluded that, as of December 31, 2024, our internal control over financial reporting was effective based on the criteria established in the 2013 framework.
Our independent registered public accounting firm, Ernst & Young LLP, has issued an attestation report on the effectiveness of our internal control over financial reporting as of December 31, 2024. This report follows.
Report of Independent Registered Public Accounting Firm
To the Shareholders and the Board of Directors of Chipotle Mexican Grill, Inc.
Opinion on Internal Control Over Financial Reporting
We have audited Chipotle Mexican Grill, Inc.’s internal control over financial reporting as of December 31, 2024, based on criteria established in Internal Control—Integrated Framework issued by the Committee of Sponsoring Organizations of the Treadway Commission (2013 framework) (the COSO criteria). In our opinion, Chipotle Mexican Grill, Inc. (the Company) maintained, in all material respects, effective internal control over financial reporting as of December 31, 2024, based on the COSO criteria.
We also have audited, in accordance with the standards of the Public Company Accounting Oversight Board (United States) (PCAOB), the consolidated balance sheets of the Company as of December 31, 2024 and 2023, the related consolidated statements of income and comprehensive income, shareholders’ equity and cash flows for each of the three years in the period ended December 31, 2024, and the related notes and our report dated February 5, 2025 expressed an unqualified opinion thereon.
Basis for Opinion
The Company’s management is responsible for maintaining effective internal control over financial reporting and for its assessment of the effectiveness of internal control over financial reporting included in the accompanying Management’s Annual Report on Internal Control over Financial Reporting. Our responsibility is to express an opinion on the Company’s internal control over financial reporting based on our audit. We are a public accounting firm registered with the PCAOB and are required to be independent with respect to the Company in accordance with the U.S. federal securities laws and the applicable rules and regulations of the Securities and Exchange Commission and the PCAOB.
We conducted our audit in accordance with the standards of the PCAOB. Those standards require that we plan and perform the audit to obtain reasonable assurance about whether effective internal control over financial reporting was maintained in all material respects.
Our audit included obtaining an understanding of internal control over financial reporting, assessing the risk that a material weakness exists, testing and evaluating the design and operating effectiveness of internal control based on the assessed risk, and performing such other procedures as we considered necessary in the circumstances. We believe that our audit provides a reasonable basis for our opinion.
Definition and Limitations of Internal Control Over Financial Reporting
A company’s internal control over financial reporting is a process designed to provide reasonable assurance regarding the reliability of financial reporting and the preparation of financial statements for external purposes in accordance with generally accepted accounting principles. A company’s internal control over financial reporting includes those policies and procedures that (1) pertain to the maintenance of records that, in reasonable detail, accurately and fairly reflect the transactions and dispositions of the assets of the company; (2) provide reasonable assurance that transactions are recorded as necessary to permit preparation of financial statements in accordance with generally accepted accounting principles, and that receipts and expenditures of the company are being made only in accordance with authorizations of management and directors of the company; and (3) provide reasonable assurance regarding prevention or timely detection of unauthorized acquisition, use, or disposition of the company’s assets that could have a material effect on the financial statements.
Because of its inherent limitations, internal control over financial reporting may not prevent or detect misstatements. Also, projections of any evaluation of effectiveness to future periods are subject to the risk that controls may become inadequate because of changes in conditions, or that the degree of compliance with the policies or procedures may deteriorate.
/s/ Ernst & Young LLP
Irvine, California
February 5, 2025
ITEM 9B. OTHER INFORMATION
Adoption or Termination of 10b5-1 Trading Plans
Except as disclosed below, no Section 16 officer or director, as defined in Rule 16a-1(f) of the Securities Exchange Act of 1934 adopted modified or terminated a written trading plan for the purchase or sale of the Company’s securities intended to satisfy the affirmative defense conditions of Rule 10b5-1(c) or a non-Rule 10b5-1 trading arrangement (as defined in Item 408 of Regulation S-K of the Exchange Act).
Scott Boatwright, our Chief Executive Officer, adopted a new written trading plan on December 6, 2024 for the sale of up to 247,050 shares of the Company’s common stock, subject to certain conditions, from March 5, 2025, at the earliest, until December 31, 2025, at the latest. This trading plan was adopted during an open trading window and complies with the Company’s Insider Trading Policy. Actual transactions will be disclosed in Section 16 filings made with the SEC in accordance with applicable securities laws, rules and regulations.
ITEM 9C. DISCLOSURE REGARDING FOREIGN JURISDICTIONS THAT PREVENT INSPECTIONS
Not applicable.
PART III
ITEM 10. DIRECTORS, EXECUTIVE OFFICERS AND CORPORATE GOVERNANCE
Incorporated by reference from the definitive proxy statement for our 2025 annual meeting of shareholders, which will be filed no later than 120 days after December 31, 2024.
Insider Trading Policy
Chipotle maintains an Insider Trading Policy that applies to members of our Board of Directors, our executive officers and all other employees who have access to material, nonpublic information regarding Chipotle. The Insider Trading Policy is filed as an exhibit to this Annual Report.
ITEM 11. EXECUTIVE COMPENSATION
Incorporated by reference from the definitive proxy statement for our 2025 annual meeting of shareholders, which will be filed no later than 120 days after December 31, 2024.
Our current and historical practice is to grant equity awards only during periods when our trading window for insiders is open pursuant to our Insider Trading Policy. The annual equity grant, including to our executive officers, usually occurs within one week after we publicly announce our financial results for the fourth quarter and full fiscal year and our interim equity grants during the year (for example, to newly hired or promoted employees) usually occurs within one week after we publicly announce our financial results for a financial quarter. In 2024, the Compensation, People and Culture Committee of our Board approved the annual grant of equity awards on February 9, 2024, which was the day the trading window for insiders opened after we announced our 2023 fourth quarter and full year financial results. We filed our 2023 Annual Report on Form 10-K with the SEC on February 7, 2024; however, our filing occurred after the SEC’s filing cutoff time and our 2023 Annual Report on Form 10-K received a filing date of February 8, 2024. As a result, the annual grant of equity awards to our named executive officers, including the grant of the SOSARs listed in the table below, occurred one business day after the filing of our 2023 Annual Report on Form 10-K with the SEC.
| | | | | | | | | | | | | | | | | | | | | | | | | | | | | |
| Name | Grant Date | | Number of securities underly the award | | Exercise price of the award
($/SH) | | Grant date fair value of the award | | Percentage change in the closing market price of the securities underlying the award between the trading day ending immediately prior to the disclosure of material nonpublic information and the trading day beginning immediately following the disclosure of material nonpublic information |
| Brian Niccol | 2/9/2024 | | 476,800 | | $ | 52.77 | | $ | 8,048,384 | | (1.08)% |
| Jack Hartung | 2/9/2024 | | 154,000 | | $ | 52.77 | | $ | 2,599,520 | | (1.08)% |
| Curt Garner | 2/9/2024 | | 148,100 | | $ | 52.77 | | $ | 2,499,928 | | (1.08)% |
| Scott Boatwright | 2/9/2024 | | 118,500 | | $ | 52.77 | | $ | 2,002,800 | | (1.08)% |
| Chris Brandt | 2/9/2024 | | 56,300 | | $ | 52.77 | | $ | 950,592 | | (1.08)% |
ITEM 12. SECURITY OWNERSHIP OF CERTAIN BENEFICIAL OWNERS AND MANAGEMENT AND RELATED STOCKHOLDER MATTERS
Incorporated by reference from the definitive proxy statement for our 2025 annual meeting of shareholders, which will be filed no later than 120 days after December 31, 2024.
| | | | | | | | | | | | | | | | | |
| (a) Number of Securities to be Issued Upon Exercise of Outstanding Options and Rights(1) | | (b) Weighted-Average Exercise Price of Outstanding Options and Rights(1) | | (c) Number of Securities Remaining Available for Future Issuance Under Equity Compensation Plans (excluding securities reflected in column (a))(2) |
| | | | | |
| Equity Compensation Plans Approved by Security Holders | 16,805,202 | | $ | 32.53 | | 117,879,513 |
| Equity Compensation Plans Not Approved by Security Holders | None | | N/A | | None |
| Total | 16,805,202 | | $ | 32.53 | | 117,879,513 |
__________________
(1)Includes shares issuable in connection with awards with performance and market conditions, which will be issued based on achievement of performance criteria associated with the awards, with the number of shares issuable dependent on our level of performance. The weighted-average exercise price in column (b) includes the weighted-average exercise price of SOSARs only.
(2)Includes 105,568,859 shares remaining available under the Chipotle Mexican Grill, Inc. 2022 Stock Incentive Plan, and 12,310,654 shares remaining available under the Chipotle Mexican Grill, Inc. Employee Stock Purchase Plan. In addition to being available for future issuance upon exercise of SOSARs or stock options that may be granted after December 31, 2024, all of the shares available for grant under the Chipotle Mexican Grill, Inc. 2022 Stock Incentive Plan, may instead be issued in the form of restricted stock, restricted stock units, performance shares or other equity-based awards. Each share underlying a full value award such as restricted stock, restricted stock units or performance shares counts as two shares used against the total number of securities authorized under the plan.
Additional information for this item is incorporated by reference from the definitive proxy statement for our 2025 annual meeting of shareholders, which will be filed no later than 120 days after December 31, 2024.
ITEM 13. CERTAIN RELATIONSHIPS AND RELATED TRANSACTIONS, AND DIRECTOR INDEPENDENCE
Incorporated by reference from the definitive proxy statement for our 2025 annual meeting of shareholders, which will be filed no later than 120 days after December 31, 2024.
ITEM 14. PRINCIPAL ACCOUNTING FEES AND SERVICES
Incorporated by reference from the definitive proxy statement for our 2025 annual meeting of shareholders, which will be filed no later than 120 days after December 31, 2024.
PART IV
ITEM 15. EXHIBITS, FINANCIAL STATEMENT SCHEDULES
1. All Financial statements
The following consolidated financial statements filed as part of this report are included in Part II, Item 8. “Financial Statements and Supplementary Data” of this 10-K:
•Consolidated Statements of Income and Comprehensive Income for the years ended December 31, 2024, 2023 and 2022;
•Consolidated Balance Sheets as of December 31, 2024 and 2023;
•Consolidated Statements of Cash Flows for the years ended December 31, 2024, 2023 and 2022;
•Consolidated Statements of Equity for the years ended December 31, 2024, 2023 and 2022;
•Notes to Consolidated Financial Statements; and
•Reports of Independent Registered Public Accounting Firm
2. Financial statement schedules
No schedules are required because either the required information is not present or is not present in amounts sufficient to require submission of the schedule, or because the information required is included in the consolidated financial statements or the notes thereto.
3. Exhibits
| | | | | | | | | | | | | | | | | | | | | | | | | | | | | | | | | | | | | | |
| | | | | Description of Exhibit Incorporated Herein by Reference |
| Exhibit Number | | Exhibit Description | | Form | | File No. | | Filing Date | | Exhibit Number | | Filed Herewith |
| 3.1 | | | | 8-K | | 001-32731 | | June 7, 2024 | | 3.1 | | |
| 3.2 | | | | 8-K | | 001-32731 | | June 1, 2023 | | 3.1 | | |
| 4.2 | | | | | | | | | | | | X |
| 10.1† | | | | 10-Q | | 001-32731 | | July 24, 2019 | | 10.1 | | |
| 10.2† | | | | 10-Q | | 001-32731 | | July 24, 2019 | | 10.2 | | |
| 10.3† | | | | 8-K | | 001-32731 | | May 24, 2018 | | 10.1 | | |
| 10.4† | | | | 10-K | | 001-32731 | | March 17, 2006 | | 10.6 | | |
| 10.5† | | | | 8-K | | 001-32731 | | March 21, 2007 | | 10.1 | | |
| 10.6† | | | | 8-K | | 001-32731 | | February 15, 2018 | | 10.1 | | |
| 10.7† | | | | 10-Q | | 001-32731 | | April 26, 2018 | | 10.14 | | |
| 10.8 | | | | 10-K | | 001-32731 | | February 7, 2024 | | 10.10 | | |
| | | | | | | | | | | | | | | | | | | | | | | | | | | | | | | | | | | | | | |
| 10.9† | | | | 10-K | | 001-32731 | | February 10, 2021 | | 10.36 | | |
| 10.10† | | | | 10-Q | | 001-32731 | | April 28, 2022 | | 10.1 | | |
| 10.11† | | | | 10-Q | | 001-32731 | | April 28, 2022 | | 10.2 | | |
| 10.12† | | | | 10-Q | | 001-32731 | | April 28, 2022 | | 10.3 | | |
| 10.13† | | | | 10-Q | | 001-32731 | | April 28, 2022 | | 10.4 | | |
| 10.14† | | | | | | | | | | | | X |
| 10.15† | | | | 10-Q | | 001-32731 | | July 27, 2022 | | 10.2 | | |
| 10.16† | | | | 10-Q | | 001-32731 | | April 27, 2023 | | 10.1 | | |
| 10.17† | | | | 10-Q | | 001-32731 | | April 27, 2023 | | 10.2 | | |
| 10.18† | | | | 10-Q | | 001-32731 | | April 27, 2023 | | 10.3 | | |
| 10.19† | | | | 10-Q | | 001-32731 | | April 27, 2023 | | 10.4 | | |
| 10.20† | | | | 10-Q | | 001-32731 | | October 27, 2023 | | 10.1 | | |
| 10.21† | | | | 10-K | | 001-32731 | | February 9, 2023 | | 10.33 | | |
| 10.22† | | | | 10-K | | 001-32731 | | February 7, 2024 | | 10.25 | | |
| 10.23† | | | | 10-Q | | 001-32731 | | April 25, 2024 | | 10.1 | | |
| 10.24† | | | | 10-Q | | 001-32731 | | April 25, 2024 | | 10.2 | | |
| 10.25† | | | | 10-Q | | 001-32731 | | April 25, 2024 | | 10.3 | | |
| 10.26† | | | | 10-Q | | 001-32731 | | April 25, 2024 | | 10.4 | | |
| 10.27† | | | | 10-Q | | 001-32731 | | October 29, 2024 | | 10.1 | | |
| 10.28† | | | | 10-Q | | 001-32731 | | October 29, 2024 | | 10.2 | | |
| 10.29† | | | | 10-Q | | 001-32731 | | October 29, 2024 | | 10.3 | | |
| 10.30† | | | | 10-Q | | 001-32731 | | October 29, 2024 | | 10.4 | | |
| 10.31† | | | | 10-Q | | 001-32731 | | October 29, 2024 | | 10.5 | | |
| 19.1 | | | | - | | - | | - | | - | | X |
| 21.1 | | | | - | | - | | - | | - | | X |
| 23.1 | | | | - | | - | | - | | - | | X |
| 31.1 | | | | - | | - | | - | | - | | X |
| | | | | | | | | | | | | | | | | | | | | | | | | | | | | | | | | | | | | | |
| 31.2 | | | | - | | - | | - | | - | | X |
| 32.1 | | | | - | | - | | - | | - | | X |
| 97.1† | | | | 10-K | | 001-32731 | | February 7, 2024 | | 97.1 | | |
| 101.INS | | Inline XBRL Instance Document (the instance document does not appear in the Interactive Data File because its XBRL tags are embedded within the Inline XBRL document) | | - | | - | | - | | - | | X |
| 101.SCH | | Inline XBRL Taxonomy Extension Schema Document | | - | | - | | - | | - | | X |
| 101.CAL | | Inline XBRL Taxonomy Extension Calculation Linkbase Document | | - | | - | | - | | - | | X |
| 101.DEF | | Inline XBRL Taxonomy Extension Definition Linkbase Document | | - | | - | | - | | - | | X |
| 101.LAB | | Inline XBRL Taxonomy Extension Label Linkbase Document | | - | | - | | - | | - | | X |
| 101.PRE | | Inline XBRL Taxonomy Extension Presentation Linkbase Document | | - | | - | | - | | - | | X |
| 104 | | Cover Page Interactive Data File (formatted as inline XBRL and contained in Exhibit 101) | | - | | - | | - | | - | | X |
| | | | | | | | | | | | |
| †- Management contracts and compensatory plans or arrangements required to be filed as exhibits. |
ITEM 16. FORM 10-K SUMMARY
None.
SIGNATURES
Pursuant to the requirements of Section 13 or 15(d) of the Securities Exchange Act of 1934, the registrant has duly caused this report to be signed on its behalf by the undersigned, thereunto duly authorized.
| | | | | | | | |
| CHIPOTLE MEXICAN GRILL, INC. | |
| | |
| By: | /s/ Jamie McConnell | |
| Name: | Jamie McConnell | |
| Title: | Chief Accounting and Administrative Officer | |
Date: February 5, 2025
Pursuant to the requirements of the Securities Exchange Act of 1934, this report has been signed below by the following persons on behalf of the registrant and in the capacities and on the dates indicated.
| | | | | | | | | | | | | | |
| Signature | | Date | | Title |
| | | | |
| /s/ SCOTT BOATWRIGHT | | February 5, 2025 | | Chief Executive Officer (principal executive officer) |
| Scott Boatwright | | | | |
| | | | |
| /s/ ADAM RYMER | | February 5, 2025 | | Chief Financial Officer (principal financial officer) |
| Adam Rymer | | | | |
| | | | |
| /s/ JAMIE MCCONNELL | | February 5, 2025 | | Chief Accounting and Administrative Officer (principal accounting officer) |
| Jamie McConnell | | | | |
| | | | |
| /s/ SCOTT MAW | | February 5, 2025 | | Chairman of the Board and Director |
| Scott Maw | | | | |
| | | | |
| /s/ ALBERT BALDOCCHI | | February 5, 2025 | | Director |
| Albert S. Baldocchi | | | | |
| | | | |
| /s/ MATTHEW CAREY | | February 5, 2025 | | Director |
| Matthew Carey | | | | |
| | | | |
| /s/ GREGG ENGLES | | February 5, 2025 | | Director |
| Gregg Engles | | | | |
| | | | |
| /s/ PATRICIA FILI-KRUSHEL | | February 5, 2025 | | Director |
| Patricia Fili-Krushel | | | | |
| | | | |
| /s/ LAURA FUENTES | | February 5, 2025 | | Director |
| Laura Fuentes | | | | |
| | | | |
| /s/ MAURICIO GUTIERREZ | | February 5, 2025 | | Director |
| Mauricio Gutierrez | | | | |
| | | | |
| /s/ ROBIN HICKENLOOPER | | February 5, 2025 | | Director |
| Robin Hickenlooper | | | | |
| | | | |
/s/ MARY WINSTON | | February 5, 2025 | | Director |
| Mary Winston | | | | |
CHIPOTLE MEXICAN GRILL, INC.
DESCRIPTION OF CAPITAL STOCK
The following description is a summary of the terms of our capital stock is qualified in its entirety by reference to our Restated Certificate of Incorporation (“Certificate”) and Amended and Restated Bylaws (“Bylaws”), each of which is incorporated by reference as an exhibit to this Annual Report on Form 10-K, and certain applicable provisions of Delaware law.
Authorized Capital Shares
Chipotle’s authorized capital stock consists of eleven billion five hundred million (11,500,000,000) shares of common stock, $0.01 par value per share (“Common Stock”), and six hundred million (600,000,000) shares of preferred stock, $0.001 par value per share (“Preferred Stock”). As of December 31, 2024, no shares of Preferred Stock are outstanding. All outstanding shares of our Common Stock are fully paid and nonassessable.
Voting Rights
Holders of Common Stock are entitled to one vote per share on all matters voted on by the shareholders, including the election of directors. Our Common Stock does not have cumulative voting rights.
Dividend Rights
Subject to the rights of holders of outstanding shares of Preferred Stock, if any, the holders of Common Stock are entitled to receive dividends, if any, that may be declared from time to time by the Board of Directors in its discretion out of funds legally available for the payment of dividends.
Liquidation Rights
Subject to the rights of holders of outstanding shares of Preferred Stock, if any, holders of Common Stock will share ratably in all assets legally available for distribution to our shareholders in the event of dissolution.
Other Rights and Preferences
Our Common Stock has no sinking fund or redemption provisions or preemptive, conversion or exchange rights.
Provisions that Could Delay or Defer a Change in Control
Our Certificate and Bylaws contain provisions that may make the acquisition of control of Chipotle without the approval of our Board of Directors more difficult, including provisions relating to the nomination, election and removal of directors and limitations on our shareholders taking action by written consent.
In addition, we have elected to be governed by the provisions of Section 203 of the General Corporation Law of the State of Delaware, which generally prohibits a public Delaware corporation from engaging in a “business combination” with an “interested stockholder” for a period of three years following the time that the person became an interested stockholder, unless:
•prior to the time that the person became an interested stockholder the corporation’s board of directors approved either the business combination or the transaction that resulted in the stockholder’s becoming an interested stockholder;
•upon consummation of the transaction which resulted in the stockholder’s becoming an interested stockholder, the stockholder owned at least 85% of the outstanding voting stock of the corporation at the time the transaction commenced, excluding for the purpose of determining the number of shares outstanding those shares owned by the corporation’s officers and directors and by employee stock plans in which employee participants do not have the right to determine confidentially whether shares held subject to the plan will be tendered in a tender or exchange offer; or
•at or subsequent to the time, the business combination is approved by the corporation’s board of directors and authorized at an annual or special meeting of its stockholders, and not by written consent, by the affirmative vote of at least 66 2/3% of its outstanding voting stock that is not owned by the interested stockholder.
A “business combination” includes mergers, asset sales or other transactions resulting in a financial benefit to the stockholder. An “interested stockholder” is a person who, together with affiliates and associates, owns (or within three years did own) 15% or more of the corporation’s voting stock.
Listing
The Common Stock is traded on the New York Stock Exchange under the trading symbol “CMG.”
Chipotle Mexican Grill, Inc.
Director Compensation Program and Stock Ownership Guidelines
Effective August 19, 2024
Set forth below is the compensation program for non-employee directors of Chipotle Mexican Grill, Inc. Members of Chipotle’s Board of Directors who are employees of Chipotle do not receive compensation for their services as directors.
| | | | | | | | |
| Retainer Type | Cash | Restricted Stock Units (RSUs) |
| Annual Director Retainer | $110,000 | $215,000 |
| Chairman of the Board (non-employee) | $200,000 | |
| Lead Independent Director | $50,000 | |
| Committee Chair Retainers: | | |
| Audit | $42,500 | |
| Compensation | $37,500 | |
| Nominating and Corporate Governance | $30,000 | |
| Committee Member Retainers (excluding Committee Chair): | | |
| Audit | $15,000 | |
| Compensation | $15,000 | |
| Nominating and Corporate Governance | $10,000 | |
In addition to the above cash retainers, if a Committee holds more than eight (8) formal meetings during the compensation year (defined below), each Committee member (including the Committee Chair) will receive a $2,000/meeting fee for each formal meeting in excess of eight (8) formal meetings in which the Committee member participates. To qualify as a “formal meeting,” the meeting must have been scheduled in advance, follow a defined agenda circulated in advance, be attended by a quorum of the Committee members, and be documented with minutes. A Committee member must attend at least 2/3rds of the meeting to qualify for the meeting fee.
Compensation Period and Payments
Director compensation will be paid based on the directors’ one-year term of service to align with each annual meeting of shareholders (i.e., from May 31 to May 31) (the “compensation year”).
All cash retainers will be paid in arrears, on a pro rata basis, at the end of November and May. No Committee Chair can simultaneously receive a Committee Chair retainer and a Committee Member retainer for service on the Committee for which he or she serves as Chair.
The number of RSU’s granted to a director will be determined by dividing $215,000 by the Fair Market Value (as defined in the 2022 Stock Incentive Plan) of Chipotle common stock on the grant date, which (unless the Board determines otherwise) is the closing stock price on the grant date. RSUs are granted to non-employee directors on the date of Chipotle’s annual meeting of shareholders meeting each year and vest 100% on the grant date.
Changes During a Compensation Year
If a director is elected to the Board on a date that is between annual meetings, the newly elected director will receive (i) a prorated RSU award, granted on the date that is three (3) business days after the date of election, and (ii) prorated cash compensation, which will be paid in accordance with the regular director pay schedule. Both the total grant value of the RSU and the amount of cash compensation will be prorated based on the date of the director’s election to the Board and the number of days elapsed since the annual meeting of shareholders that most recently occurred (e.g., if the annual meeting is on May 31 and a director joins on October 1, that director will receive 243/365th of the annual compensation amount).
If a director is appointed to or leaves a Committee or assumes or relinquishes a Chair or Lead Independent Director position, on a date that is between annual meetings, his or her cash compensation will be prorated based on the effective date of the change in service and the number of days elapsed since the annual meeting of shareholders that most recently occurred.
Deferral Election
A director may elect to defer the receipt of cash compensation or defer the receipt of shares of common stock that otherwise would be issuable upon vesting of an RSU by submitting to Chipotle a deferral election in the form provided by Chipotle. The deferral form must be received by Chipotle before the end of the calendar year immediately prior to the compensation year in which the cash compensation or RSU relates (for example, the deferral election is due before December 31, 2023 for director compensation payable for the compensation year May 2024 – May 2025).
Expense Reimbursement
Directors will be reimbursed for reasonable expenses directly incurred in connection with their service as directors, including travel and lodging expenses for meetings. Reimbursement is subject to a director providing timely substantiation of expenses pursuant to Chipotle’s expense policy.
Stock Ownership Guidelines
Directors are expected to own, within five years after being elected to the Board, shares of Chipotle common stock having a total value of five (5) times the annual cash retainer payable to non-employee directors (excluding Committee, Chair and Lead Independent Director retainers).
The following forms of equity count towards the required stock ownership guidelines:
•shares of Chipotle common stock owned outright (including shares received upon vesting of restricted stock units)
•unvested restricted stock
•unvested restricted stock units
•any cash or restricted stock units that have been deferred
The following forms of equity do not count towards the required stock ownership guidelines:
•shares of Chipotle common stock transferred to any individual, other than the director’s spouse
•unvested and vested stock options
•unvested and vested stock appreciation rights
•unearned performance shares/units
| | | | | |
| |
 Policy Title: Policy Title: | Insider Trading Policy |
Last Revised: | October 2023 |
Policy Owner: | Legal |
Scope: | Applies to Chipotle Executive Officers, members of the Board of Directors and employees designated as “insiders” |
Background
Federal law prohibits “insider trading,” which is the purchase or sale of securities by a person aware of material, nonpublic information, as well as the disclosure of material, nonpublic information by a person to someone else who then trades in securities based on that information (called “tipping”). These insider trading violations are pursued vigorously by the Securities and Exchange Commission (the “SEC”) and U.S. Attorneys. Punishment for insider trading violations is severe and could result in significant fines and imprisonment. The federal securities laws impose potential liability on companies if they fail to take reasonable steps to prevent insider trading by their directors, executive officers and employees.
Scope
This Insider Trading Policy (this “Policy”) is intended to promote compliance with federal securities laws that prohibit persons who are aware of material, nonpublic information about a company from:
•trading in securities of that company; or
•providing material, nonpublic information to other persons who may trade on the basis of that information.
This Policy applies to you if you are:
•a member of Chipotle’s Board of Directors (a “Director”);
•an executive officer of Chipotle (an “Executive Officer”); or
•a Chipotle employee who has been notified that you are an “insider” because you regularly receive or have access to material, nonpublic information as part of your employment (“Other Financial Insider”).
This Policy also applies to transactions by your family members who reside with you, anyone else who lives in your household, and family members who do not live in your household but whose transactions in Chipotle securities are managed or directed by you, or subject to your influence or control. It also applies to any entities you control (including corporations, partnerships or trusts). This Policy will continue to apply to any Director, Executive Officer and Other Financial Insider whose employment or other relationship with the Company terminates for so long as he or she is aware of material, nonpublic information gained during the tenure of that employment or relationship.
This Policy covers all transactions in Chipotle securities, including Chipotle’s common stock or any other type of securities that Chipotle may issue (including preferred stock), as well
as derivative securities that are not issued by Chipotle, such as exchange-traded put or call options or swaps relating to securities of Chipotle. It is also Chipotle’s policy that Chipotle will not engage in transactions in its own securities while aware of material nonpublic information relating to Chipotle or its securities.
Statement of Policy
It is Chipotle’s policy that if, and for so long as, you are aware of material, nonpublic information relating to Chipotle, you may not:
•trade, directly or indirectly, in any securities of Chipotle;
•recommend the purchase or sale of any securities of Chipotle to any other person; or
•disclose material, nonpublic information to persons within Chipotle whose jobs do not require them to have that information, or outside Chipotle to other persons, unless any such disclosure is made in accordance with Chipotle’s policies regarding the protection or authorized external disclosure of information regarding Chipotle.
In addition, it is Chipotle’s policy that if you learn of material, nonpublic information about a company with which Chipotle does business (including a vendor or consultant of Chipotle), you may not trade in that company’s securities until the information becomes public or is no longer material.
Information is considered “material” if a reasonable investor would consider it important in deciding whether to buy, hold or sell securities. Any information that could be expected to affect Chipotle’s stock price, whether it is positive or negative, should be considered material. There is no bright-line standard for assessing materiality; rather, materiality is based on an assessment of all the facts and circumstances and is often evaluated by enforcement authorities with the benefit of hindsight. Information deemed material could relate to, among other things, financial results; a change in earnings or in forecasted earnings that is higher or lower than the forecast; company-wide sales trends or significant changes in comparable restaurant sales; launch or acquire a new business or close a business; a significant food safety concern; a potential data breach or other cyber security concerns; major litigation or regulatory actions; the gain or loss of a substantial supplier; and changes in senior management or a potential change in control of Chipotle. These examples are not intended to be exhaustive, but merely illustrative of the types of information that would be considered “material.”
Information is considered “nonpublic” if it has not been disclosed to the public and widely disseminated. Information generally is considered widely disseminated if it has been disclosed through a company press release issued on the Business Wire newswire service, published in a widely available newspaper, magazine or news website, or publicly disclosed in a document filed with the SEC that is available on the SEC’s website. By contrast, information would likely not be considered widely disseminated if it is available only to Chipotle’s employees, or if it is only available to a select group of analysts, brokers and institutional investors. Once information is widely disseminated, it is still necessary to afford the investing public sufficient time to absorb the information.
Trading Procedures
Chipotle has established certain procedures to assist in the administration of this Policy, to facilitate compliance with laws prohibiting insider trading and to avoid the appearance of any impropriety.
1. Pre-Clearance of Trades by Directors and Executive Officers. Directors and Executive Officers may not engage in any transaction in securities of Chipotle without first
obtaining pre-clearance of the transaction from Chipotle’s legal department. This requirement applies to all proposed transactions, including, for example:
•purchases and sales in the open market, including selling shares from exercise of a stock only stock appreciation right (“SOSAR”),
•gifts, and
•fund switching or reallocation transactions into or out of Chipotle stock fund in Chipotle’s 401(k) Savings Plan (if the Plan contains a Chipotle stock fund).
Your request for pre-clearance should be submitted at least two (2) business days in advance of the proposed transaction to ensure there is adequate time for us to help you analyze the proposed transaction and comply with your obligations under the federal securities laws. When you request pre-clearance of a transaction, you should carefully consider whether you may be aware of any material, nonpublic information about Chipotle and should describe fully those circumstances. You may have information about Chipotle that the legal department or others involved in the pre-clearance process do not have, and receipt of pre-clearance will not insulate you from liability if you are aware of material, nonpublic information when you trade.
When you request pre-clearance, you also should indicate whether you have affected any other trades recently and should be prepared to report the proposed transaction on a Form 4 with our assistance. You also should be prepared to comply with SEC Rule 144 and file Form 144 at the time of any sale with the assistance of your broker.
2. Trading Procedures for Other Financial Insiders. Other Financial Insiders (who are not Directors or Executive Officers) are not required to pre-clear transactions with the legal department; however, you are still required to comply with this Policy and refrain from trading while you are aware of material, nonpublic information. In other words, you are held to the same standard as Directors and Executive Officers, even though you do not need to obtain pre-clearance. Before you effect any trade in Chipotle securities, you should carefully consider whether you are aware of any material, nonpublic information about Chipotle. If you would like assistance in evaluating whether the information of which you are aware is material or nonpublic, please contact Chipotle’s legal department.
3. Quarterly No-Trade Periods. To prevent the appearance of impropriety and minimize any concern that you might possess material, nonpublic information at the time of a transaction, Chipotle imposes a quarterly “No-Trade Period” at the end of every quarter. Each No-Trade Period –
•begins at the close of business on the 15th day of the last month of each quarter (i.e., March 15, June 15, September 15 and December 15), and
•ends at the start of trading on the second business day after financial results for the most recently completed quarter have been disclosed to the public (for example, if financial results are disclosed after close of trading on Tuesday, the no-trade period will end at the start of trading on Thursday).
Chipotle retains discretion to extend the No-Trade Period or impose it at an earlier date. We will notify all Directors, Executive Officers and Other Financial Insiders if the No-Trade Period begins or ends at a different time.
During a No-Trade Period, you may not trade, directly or indirectly, in Chipotle securities except as described below under “Transactions Exempt from this Policy.”
4. Event-Specific No-Trade Periods. From time to time, an event may occur that is material to Chipotle and is known by only some Directors, Executive Officers and/or employees. So long as the event remains material and nonpublic, you should not trade in securities of Chipotle. If that situation occurs, we will notify you that you should not trade in securities of Chipotle, but we may not disclose the reason for the restriction. The existence of an event-specific No-Trade Period will not be announced to Chipotle as a whole and you should not communicate the existence of the restriction to any other person or speculate about the reason for the restriction.
Transactions Exempt from this Policy
The transactions below involving Chipotle securities are exempt from this Policy; however, all Directors and Executive Officers still are required to obtain pre-clearance of the transaction. Even if a transaction is exempt from this Policy, it still may be subject to reporting under Section 16(a) of the Exchange Act.
1. Rule 10b5-1 Plans. Exchange Act Rule 10b5‑1 provides an affirmative defense from insider trading liability under the federal securities laws for purchases and sales of securities that are made pursuant to a written plan that meets the conditions contained in Rule 10b5-1 (such a plan, a “10b5‑1 Plan”). To comply with this Policy, a 10b5-1 Plan must meet all the following requirements:
(a) The 10b5-1 Plan (and any modification) must be approved by Chipotle’s legal department before signing, and the person implementing the 10b5-1 Plan (the “Covered Person”) should allow at least two business days for that approval before the Plan will become effective.
(b) The 10b5-1 Plan provides that no purchases or sales will be made under the Plan until the applicable “cooling off” period has expired, which is:
(i) Directors and Executive Officers: 90 days after adoption or modification of the 10b5-1 Plan (or, if later, two business days after Chipotle files its Form 10-Q/Form 10-K for the quarter in which the plan was adopted), but in no event later than 120 days after the Plan was adopted.
(ii) Other Financial Insiders: 30 days after adoption or modification of the 10b5-1 Plan.
(c) The 10b5-1 Plan (and any modification to an executed Plan) was executed in good faith at a time when the Covered Person was not subject to a No-Trade Period and was not in possession of material, non-public information about Chipotle. In addition, for a Director or Executive Officer, the 10b5-1 Plan must include a representation in the Plan certifying that, on the date of adoption of the Plan (or the date of modification of an executed Plan): (i) the Covered Person is not aware of any material, non-pubic information about Chipotle, and (ii) the Covered Person is adopting the 10b5-1 Plan in good faith and not as part of a plan or scheme to shield trades that would otherwise be considered violations of the insider trading laws.
(d) The 10b5-1 Plan (i) gives a third party discretionary authority to execute specified purchases and sales, outside the control of the Covered Person, so long as such third party does not possess any material, nonpublic information about Chipotle, (ii) explicitly specifies the security or securities to be traded, the number of securities to be traded and the prices at which and dates on which the securities are to be traded, and/or (iii) includes a formula specifying the information in clause (ii).
(e) If the 10b5-1 Plan is terminated, the Covered Person (i) must wait at least 14 days before executing a trade outside of the Plan (which trade must comply with this Policy), and (ii) cannot implement a new 10b5-1 Plan until at least 30 days after the date the prior 10b5-1
Plan was terminated (and the new 10b5-1 Plan must comply with these provisions, including the cooling off period).
(f) The Covered Person must act in good faith with respect to the 10b5-1 Plan for its duration.
(g) The Covered Person may not have more than one 10b5-1 Plan in effect at any time, unless the later-commencing 10b5-1 Plan does not authorize trading to begin until after all trades under the earlier-commencing 10b5-1 Plan are completed or expire and the other conditions of Rule 10b5-1 are satisfied.
(h) The Covered Person may have only one “single-trade” 10b5-1 Plan during any 12-month period (other than “sell-to-cover” plans, which instruct the broker to sell only such number of securities as is necessary to satisfy tax withholding obligations arising exclusively from the vesting of a compensatory equity award).
Chipotle will disclose in its Form 10-Q and/or Form 10-K the adoption, modification and/or termination of any 10b5-1 Plan adopted by its Directors or Executive Officers and the material terms of such Plan.
2. Employee Stock Purchase Plan. Executive Officers and Other Financial Insiders who are enrolled in Chipotle’s Employee Stock Purchase Plan (“ESPP”) are not subject to pre-clearance requirements and may purchase Chipotle common stock through the ESPP using periodic payroll deductions. However, Executive Officers and Other Financial Insiders may only (i) enroll in the ESPP, make elections regarding payroll deductions and make changes in their ESPP payroll deductions, and (ii) sell shares of Chipotle common stock purchased through the ESPP, outside a No-Trade Period. Sales of shares purchased through the ESPP also are subject to all other provisions of this Policy, including pre-clearance requirements.
3. Cash Exercise of a SOSAR but No Sale of Shares. Directors, Executive Officers and Other Financial Insiders may exercise Chipotle stock appreciation rights/SOSARs during a No-Trade Period, but only if he or she pays the exercise price in cash and does not sell any shares of common stock. Although the exercise of a stock appreciation right/SOSAR during a No-Trade Period is permissible, the sale of the Chipotle shares received from the exercise is not; therefore, a “broker-assisted cashless exercise” or any other type of exercise that results in the contemporaneous exercise and sale of shares from the exercise of the award is not permitted.
Other SEC Legal Restrictions and Obligations Imposed on Directors and Executive Officers
In addition to making it illegal for persons to trade in securities while in possession of material, nonpublic information, the federal securities laws impose other restrictions and obligations on Directors and Executive Officers (i.e., these do not apply to Other Financial Insiders).
1. Short Swing Profits. Under Section 16(b) of the Securities Exchange Act of 1934 (the “Exchange Act”), all profit realized by you from any purchase and sale (or any sale and purchase) of Chipotle securities within a period of less than six months must be paid to Chipotle. For example, if you purchased Chipotle common stock on March 1 and then sell Chipotle common stock (whether it is the same shares you purchased on March 1 or other shares) on June 10, you will be liable for short swing profits, and the calculation of “profit” under the SEC rules may be more than you actually received from the transactions. Section 16(b) applies regardless of whether you actually were aware of material, nonpublic information at the time of
the transaction. Therefore, from a practical standpoint, SEC rules prohibit you from buying and selling (or vice versa) Chipotle’s securities within a period of six months.
2. Reporting Transactions in Chipotle Common Stock. The reporting requirements of Section 16(a) of the Exchange Act are designed to disclose whether directors and officers of public companies have complied with Section 16(b). Section 16(a) requires you to file a report with the SEC initially disclosing the securities of Chipotle owned by you (Form 3) and thereafter to report promptly any changes in these holdings, including purchases, sales and gifts/charitable donations (Form 4). A Form 4 must be filed by the second day following the date of a transaction in Chipotle securities. Certain transactions exempt from the operation of Section 16(b) of the Exchange Act may be reported annually on Form 5. Chipotle will assist you in preparing and filing any Form 3, 4 or 5.
3. Short Sales. Short sales of securities of Chipotle (i.e., the sale of a security that the seller does not own) may evidence an expectation on the part of the seller that the securities will decline in value, and therefore may be perceived as signaling to the market that the seller lacks confidence in Chipotle’s prospects. Section 16(c) of the Exchange Act prohibits you from engaging in short sales.
4. Rule 144. All Company securities that you sell in the public market must be sold in accordance with the technical requirements of SEC Rule 144 (including the filing of a Form 144 with the SEC prior to or concurrently with the trade). A knowledgeable broker can assist you with the necessary Rule 144 paperwork; however, as discussed above, you should pre-clear with us any proposed sale of Chipotle’s securities to expedite the sale process, resolve any securities law issues and avoid any Rule 144 violations.
Other Legal Restrictions and Obligations Imposed by Chipotle
Chipotle has determined that there is a heightened legal risk or the appearance of improper or inappropriate conduct if its Directors, Executive Officers or Other Financial Insiders engage in certain types of transactions. It therefore is Chipotle’s policy that you may not engage in any of the following transactions:
1. Gifts/ Charitable Donations of Chipotle Shares During a No-Trade Period. Directors, Executive Officers and Other Financial Insiders may make gifts and charitable donations of Chipotle securities (regardless of type, including bona fide donations to non-profit organizations) only outside a No-Trade Period and while not in possession of material, nonpublic information.
2. Publicly Traded Options. Given the relatively short term of publicly traded options, transactions in options may create the appearance that you are trading based on material, nonpublic information and focusing your attention on Chipotle’s short-term performance at the expense of Chipotle’s long-term objectives. Accordingly, you are prohibited from engaging in put options, call options, covered call options or other derivative securities in Chipotle common stock, on an exchange or in any other organized market.
3. Hedging Transactions. Hedging or monetization transactions can be accomplished through several possible mechanisms, including the use of financial instruments such as prepaid variable forward sale contracts, equity swaps, collars and exchange funds. Such
hedging transactions may permit you to continue to own securities of Chipotle, but without the full risks and rewards of ownership. When this situation occurs, you may no longer have the same objectives as Chipotle’s other shareholders. Therefore, you are prohibited from engaging in any such hedging transactions.
4. Margin Accounts and Pledged Securities. Securities held in a margin account as collateral for a margin loan may be sold by the broker without the customer’s consent if the customer fails to meet a margin call. Similarly, securities pledged as collateral for a loan may be sold in foreclosure if the borrower defaults on the loan. Because a margin sale or foreclosure sale may occur at a time when the pledgor is aware of material, nonpublic information or otherwise is not permitted to trade in securities of Chipotle, you are prohibited from holding securities of Chipotle in a margin account or otherwise pledging Chipotle’s securities as collateral for a loan.
Questions and Assistance
Contact Chipotle’s legal department – Helen Kaminski or Roger Theodoredis – with any questions about this Policy or its application.
Last Revised: October 2023
Chipotle Mexican Grill, Inc.
Insider Trading Policy
Acknowledgment
The undersigned hereby acknowledges that he/she has read, understands, and agrees to comply with Chipotle’s Insider Trading Policy.
| | |
|
|
| Signature |
|
| Printed Name |
|
| Date |
SIGNIFICANT SUBSIDIARIES OF CHIPOTLE MEXICAN GRILL, INC.
Following is a list of subsidiaries of Chipotle Mexican Grill, Inc., excluding certain subsidiaries that, in the aggregate as a single subsidiary, do not constitute a significant subsidiary.
| | | | | |
Subsidiary Name | Jurisdiction of Formation |
Chipotle Mexican Grill Canada Corp. | Nova Scotia, Canada |
Chipotle Mexican Grill France SAS | France |
Chipotle Mexican Grill Germany GMBH | Germany |
Chipotle Mexican Grill of Berwyn Heights, LLC | Maryland |
Chipotle Mexican Grill of Colorado, LLC | Colorado |
Chipotle Mexican Grill of Kansas, LLC | Kansas |
Chipotle Mexican Grill of Maryland, LLC | Maryland |
Chipotle Mexican Grill Texas Holdings, LLC | Colorado |
Chipotle Mexican Grill U.S. Finance Co., LLC | Colorado |
Chipotle Mexican Grill UK Limited | United Kingdom |
Chipotle Services, LLC | Colorado |
Chipotle Ventures, LLC | Delaware |
CMG Concessions, LLC | Colorado |
CMG Licensing, LLC | Delaware |
CMG of Prince Georges, LLC | Maryland |
CMG Pepper, LLC | Colorado |
CMG Strategy Co., LLC | Colorado |
CMGGC, LLC | Florida |
EMEA Tortilla, Ltd. | United Kingdom |
N793WF Lease, LLC | New Jersey |
PL Restaurant LLC | Colorado |
Consent of Independent Registered Public Accounting Firm
We consent to the incorporation by reference in the following Registration Statements:
(1)Registration Statement (Form S-8 No. 333-204380) pertaining to the Amended and Restated Chipotle Mexican Grill, Inc. 2011 Stock Incentive Plan, and
(2)Registration Statement (Form S-8 No. 333-226376) pertaining to the Amended and Restated Chipotle Mexican Grill, Inc. 2011 Stock Incentive Plan, and
(3)Registration Statement (Form S-8 No. 333-265047) pertaining to the Chipotle Mexican Grill, Inc. 2022 Stock Incentive Plan, and
(4)Registration Statement (Form S-8 No. 333-265048) pertaining to the Chipotle Mexican Grill, Inc. Employee Stock Purchase Plan;
of our reports dated February 5, 2025, with respect to the consolidated financial statements of Chipotle Mexican Grill, Inc. and the effectiveness of internal control over financial reporting of Chipotle Mexican Grill, Inc. included in this Annual Report (Form 10-K) of Chipotle Mexican Grill, Inc. for the year ended December 31, 2024.
/s/ Ernst & Young LLP
Irvine, California
February 5, 2025
CERTIFICATION
I, Scott Boatwright, certify that:
1.I have reviewed this annual report on Form 10-K of Chipotle Mexican Grill, Inc.;
2.Based on my knowledge, this report does not contain any untrue statement of a material fact or omit to state a material fact necessary to make the statements made, in light of the circumstances under which such statements were made, not misleading with respect to the period covered by this report;
3.Based on my knowledge, the financial statements, and other financial information included in this report, fairly present in all material respects the financial condition, results of operations and cash flows of the registrant as of, and for, the periods presented in this report;
4.The registrant’s other certifying officers and I are responsible for establishing and maintaining disclosure controls and procedures (as defined in Exchange Act Rules 13a-15(e) and 15d-15(e)) and internal control over financial reporting (as defined in Exchange Act Rules 13a-15(f) and 15d-15(f)) for the registrant and have:
(a)Designed such disclosure controls and procedures, or caused such disclosure controls and procedures to be designed under our supervision, to ensure that material information relating to the registrant, including its consolidated subsidiaries, is made known to us by others within those entities, particularly during the period in which this report is being prepared;
(b)Designed such internal control over financial reporting, or caused such internal control over financial reporting to be designed under our supervision, to provide reasonable assurance regarding the reliability of financial reporting and the preparation of financial statements for external purposes in accordance with generally accepted accounting principles;
(c)Evaluated the effectiveness of the registrant’s disclosure controls and procedures and presented in this report our conclusions about the effectiveness of the disclosure controls and procedures, as of the end of the period covered by this report based on such evaluation; and
(d)Disclosed in this report any change in the registrant’s internal control over financial reporting that occurred during the registrant’s most recent fiscal quarter (the registrant’s fourth fiscal quarter in the case of an annual report) that has materially affected, or is reasonably likely to materially affect, the registrant’s internal control over financial reporting; and
5.The registrant’s other certifying officers and I have disclosed, based on our most recent evaluation of internal control over financial reporting, to the registrant’s auditors and the audit committee of the registrant’s board of directors (or persons performing the equivalent functions):
(a)All significant deficiencies and material weaknesses in the design or operation of internal control over financial reporting which are reasonably likely to adversely affect the registrant’s ability to record, process, summarize and report financial information; and
(b)Any fraud, whether or not material, that involves management or other employees who have a significant role in the registrant’s internal control over financial reporting.
Date: February 5, 2025
| | |
| Scott Boatwright |
| /s/ Scott Boatwright |
Chief Executive Officer (Principal Executive Officer) |
CERTIFICATION
I, Adam Rymer, certify that:
1.I have reviewed this annual report on Form 10-K of Chipotle Mexican Grill, Inc.;
2.Based on my knowledge, this report does not contain any untrue statement of a material fact or omit to state a material fact necessary to make the statements made, in light of the circumstances under which such statements were made, not misleading with respect to the period covered by this report;
3.Based on my knowledge, the financial statements, and other financial information included in this report, fairly present in all material respects the financial condition, results of operations and cash flows of the registrant as of, and for, the periods presented in this report;
4.The registrant’s other certifying officers and I are responsible for establishing and maintaining disclosure controls and procedures (as defined in Exchange Act Rules 13a-15(e) and 15d-15(e)) and internal control over financial reporting (as defined in Exchange Act Rules 13a-15(f) and 15d-15(f)) for the registrant and have:
(a)Designed such disclosure controls and procedures, or caused such disclosure controls and procedures to be designed under our supervision, to ensure that material information relating to the registrant, including its consolidated subsidiaries, is made known to us by others within those entities, particularly during the period in which this report is being prepared;
(b)Designed such internal control over financial reporting, or caused such internal control over financial reporting to be designed under our supervision, to provide reasonable assurance regarding the reliability of financial reporting and the preparation of financial statements for external purposes in accordance with generally accepted accounting principles;
(c)Evaluated the effectiveness of the registrant’s disclosure controls and procedures and presented in this report our conclusions about the effectiveness of the disclosure controls and procedures, as of the end of the period covered by this report based on such evaluation; and
(d)Disclosed in this report any change in the registrant’s internal control over financial reporting that occurred during the registrant’s most recent fiscal quarter (the registrant’s fourth fiscal quarter in the case of an annual report) that has materially affected, or is reasonably likely to materially affect, the registrant’s internal control over financial reporting; and
5.The registrant’s other certifying officers and I have disclosed, based on our most recent evaluation of internal control over financial reporting, to the registrant’s auditors and the audit committee of the registrant’s board of directors (or persons performing the equivalent functions):
(a)All significant deficiencies and material weaknesses in the design or operation of internal control over financial reporting which are reasonably likely to adversely affect the registrant’s ability to record, process, summarize and report financial information; and
(b)Any fraud, whether or not material, that involves management or other employees who have a significant role in the registrant’s internal control over financial reporting.
Date: February 5, 2025
| | |
| /s/ Adam Rymer |
| Adam Rymer |
Chief Financial Officer (Principal Financial Officer) |
CERTIFICATION PURSUANT TO
18 U.S.C. SECTION 1350,
AS ADOPTED PURSUANT TO
SECTION 906 OF THE SARBANES-OXLEY ACT OF 2002
In accordance with 18 U.S.C. 1350, as adopted pursuant to Section 906 of the Sarbanes-Oxley Act of 2002, Scott Boatwright, the Chief Executive Officer of Chipotle Mexican Grill, Inc. (the “Registrant”) and Adam Rymer, the Chief Financial Officer of the Registrant, each hereby certifies that, to the best of their knowledge:
1.The Registrant’s Annual Report on Form 10-K for the period ended December 31, 2024, to which this Certification is attached as Exhibit 32.1 (the “Periodic Report”), fully complies with the requirements of Section 13(a) or Section 15(d) of the Securities Exchange Act of 1934, as amended; and
2.The information contained in the Periodic Report fairly presents, in all material respects, the financial condition of the Registrant at the end of the period covered by the Periodic Report and results of operations of the Registrant for the periods covered by the Periodic Report.
Date: February 5, 2025
| | | | | | | | | | | |
/s/ Scott Boatwright | | /s/ Adam Rymer | |
Scott Boatwright | | Adam Rymer | |
Chief Executive Officer (Principal Executive Officer) | | Chief Financial Officer (Principal Financial Officer) | |
Cover - USD ($)
$ in Millions |
12 Months Ended |
|
|
Dec. 31, 2024 |
Jan. 31, 2025 |
Jun. 30, 2024 |
| Cover [Abstract] |
|
|
|
| Document Type |
10-K
|
|
|
| Document Annual Report |
true
|
|
|
| Document Period End Date |
Dec. 31, 2024
|
|
|
| Current Fiscal Year End Date |
--12-31
|
|
|
| Document Transition Report |
false
|
|
|
| Entity File Number |
1-32731
|
|
|
| Entity Registrant Name |
CHIPOTLE MEXICAN GRILL, INC.
|
|
|
| Entity Incorporation, State or Country Code |
DE
|
|
|
| Entity Tax Identification Number |
84-1219301
|
|
|
| Entity Address, Address Line One |
610 Newport Center Drive
|
|
|
| Entity Address, Address Line Two |
Suite 1100
|
|
|
| Entity Address, City or Town |
Newport Beach
|
|
|
| Entity Address, State or Province |
CA
|
|
|
| Entity Address, Postal Zip Code |
92660
|
|
|
| City Area Code |
949
|
|
|
| Local Phone Number |
524-4000
|
|
|
| Title of 12(b) Security |
Common stock, par value $0.01 per share
|
|
|
| Trading Symbol |
CMG
|
|
|
| Security Exchange Name |
NYSE
|
|
|
| Entity Well-known Seasoned Issuer |
Yes
|
|
|
| Entity Voluntary Filers |
No
|
|
|
| Entity Current Reporting Status |
Yes
|
|
|
| Entity Interactive Data Current |
Yes
|
|
|
| Entity Filer Category |
Large Accelerated Filer
|
|
|
| Entity Small Business |
false
|
|
|
| Entity Emerging Growth Company |
false
|
|
|
| Auditor Attestation Flag |
true
|
|
|
| Document Financial Statement Error Correction [Flag] |
false
|
|
|
| Entity Shell Company |
false
|
|
|
| Entity Public Float |
|
|
$ 72,256
|
| Entity Common Stock, Shares Outstanding |
|
1,355,337,000
|
|
| Documents Incorporated by Reference |
Part III incorporates certain information by reference from the registrant’s definitive proxy statement for the 2025 annual meeting of shareholders, which will be filed no later than 120 days after the close of the registrant’s fiscal year ended December 31, 2024.
|
|
|
| Entity Central Index Key |
0001058090
|
|
|
| Document Fiscal Year Focus |
2024
|
|
|
| Document Fiscal Period Focus |
FY
|
|
|
| Amendment Flag |
false
|
|
|
| X |
- DefinitionBoolean flag that is true when the XBRL content amends previously-filed or accepted submission.
| Name: |
dei_AmendmentFlag |
| Namespace Prefix: |
dei_ |
| Data Type: |
xbrli:booleanItemType |
| Balance Type: |
na |
| Period Type: |
duration |
|
| X |
- DefinitionEnd date of current fiscal year in the format --MM-DD.
| Name: |
dei_CurrentFiscalYearEndDate |
| Namespace Prefix: |
dei_ |
| Data Type: |
xbrli:gMonthDayItemType |
| Balance Type: |
na |
| Period Type: |
duration |
|
| X |
- DefinitionBoolean flag that is true only for a form used as an annual report. Reference 1: http://www.xbrl.org/2003/role/presentationRef
-Publisher SEC
-Name Form 10-K
-Number 249
-Section 310
Reference 2: http://www.xbrl.org/2003/role/presentationRef
-Publisher SEC
-Name Form 20-F
-Number 249
-Section 220
-Subsection f
Reference 3: http://www.xbrl.org/2003/role/presentationRef
-Publisher SEC
-Name Form 40-F
-Number 249
-Section 240
-Subsection f
| Name: |
dei_DocumentAnnualReport |
| Namespace Prefix: |
dei_ |
| Data Type: |
xbrli:booleanItemType |
| Balance Type: |
na |
| Period Type: |
duration |
|
| X |
- DefinitionIndicates whether any of the financial statement period in the filing include a restatement due to error correction. Reference 1: http://www.xbrl.org/2003/role/presentationRef
-Publisher SEC
-Name Regulation S-K
-Number 229
-Section 402
-Subsection w
Reference 2: http://www.xbrl.org/2003/role/presentationRef
-Publisher SEC
-Name Form 10-K
-Number 249
-Section 310
Reference 3: http://www.xbrl.org/2003/role/presentationRef
-Publisher SEC
-Name Form 20-F
-Number 249
-Section 220
-Subsection f
Reference 4: http://www.xbrl.org/2003/role/presentationRef
-Publisher SEC
-Name Form 40-F
-Number 249
-Section 240
-Subsection f
| Name: |
dei_DocumentFinStmtErrorCorrectionFlag |
| Namespace Prefix: |
dei_ |
| Data Type: |
xbrli:booleanItemType |
| Balance Type: |
na |
| Period Type: |
duration |
|
| X |
- DefinitionFiscal period values are FY, Q1, Q2, and Q3. 1st, 2nd and 3rd quarter 10-Q or 10-QT statements have value Q1, Q2, and Q3 respectively, with 10-K, 10-KT or other fiscal year statements having FY.
| Name: |
dei_DocumentFiscalPeriodFocus |
| Namespace Prefix: |
dei_ |
| Data Type: |
dei:fiscalPeriodItemType |
| Balance Type: |
na |
| Period Type: |
duration |
|
| X |
- DefinitionThis is focus fiscal year of the document report in YYYY format. For a 2006 annual report, which may also provide financial information from prior periods, fiscal 2006 should be given as the fiscal year focus. Example: 2006.
| Name: |
dei_DocumentFiscalYearFocus |
| Namespace Prefix: |
dei_ |
| Data Type: |
xbrli:gYearItemType |
| Balance Type: |
na |
| Period Type: |
duration |
|
| X |
- DefinitionFor the EDGAR submission types of Form 8-K: the date of the report, the date of the earliest event reported; for the EDGAR submission types of Form N-1A: the filing date; for all other submission types: the end of the reporting or transition period. The format of the date is YYYY-MM-DD.
| Name: |
dei_DocumentPeriodEndDate |
| Namespace Prefix: |
dei_ |
| Data Type: |
xbrli:dateItemType |
| Balance Type: |
na |
| Period Type: |
duration |
|
| X |
- DefinitionBoolean flag that is true only for a form used as a transition report. Reference 1: http://www.xbrl.org/2003/role/presentationRef
-Publisher SEC
-Name Forms 10-K, 10-Q, 20-F
-Number 240
-Section 13
-Subsection a-1
| Name: |
dei_DocumentTransitionReport |
| Namespace Prefix: |
dei_ |
| Data Type: |
xbrli:booleanItemType |
| Balance Type: |
na |
| Period Type: |
duration |
|
| X |
- DefinitionThe type of document being provided (such as 10-K, 10-Q, 485BPOS, etc). The document type is limited to the same value as the supporting SEC submission type, or the word 'Other'.
| Name: |
dei_DocumentType |
| Namespace Prefix: |
dei_ |
| Data Type: |
dei:submissionTypeItemType |
| Balance Type: |
na |
| Period Type: |
duration |
|
| X |
- DefinitionDocuments incorporated by reference. Reference 1: http://www.xbrl.org/2003/role/presentationRef
-Publisher SEC
-Name Exchange Act
-Number 240
-Section 12
-Subsection b-23
| Name: |
dei_DocumentsIncorporatedByReferenceTextBlock |
| Namespace Prefix: |
dei_ |
| Data Type: |
dtr-types:textBlockItemType |
| Balance Type: |
na |
| Period Type: |
duration |
|
| X |
- DefinitionAddress Line 1 such as Attn, Building Name, Street Name
| Name: |
dei_EntityAddressAddressLine1 |
| Namespace Prefix: |
dei_ |
| Data Type: |
xbrli:normalizedStringItemType |
| Balance Type: |
na |
| Period Type: |
duration |
|
| X |
- DefinitionAddress Line 2 such as Street or Suite number
| Name: |
dei_EntityAddressAddressLine2 |
| Namespace Prefix: |
dei_ |
| Data Type: |
xbrli:normalizedStringItemType |
| Balance Type: |
na |
| Period Type: |
duration |
|
| X |
- Definition
+ References
+ Details
| Name: |
dei_EntityAddressCityOrTown |
| Namespace Prefix: |
dei_ |
| Data Type: |
xbrli:normalizedStringItemType |
| Balance Type: |
na |
| Period Type: |
duration |
|
| X |
- DefinitionCode for the postal or zip code
| Name: |
dei_EntityAddressPostalZipCode |
| Namespace Prefix: |
dei_ |
| Data Type: |
xbrli:normalizedStringItemType |
| Balance Type: |
na |
| Period Type: |
duration |
|
| X |
- DefinitionName of the state or province.
| Name: |
dei_EntityAddressStateOrProvince |
| Namespace Prefix: |
dei_ |
| Data Type: |
dei:stateOrProvinceItemType |
| Balance Type: |
na |
| Period Type: |
duration |
|
| X |
- DefinitionA unique 10-digit SEC-issued value to identify entities that have filed disclosures with the SEC. It is commonly abbreviated as CIK. Reference 1: http://www.xbrl.org/2003/role/presentationRef
-Publisher SEC
-Name Exchange Act
-Number 240
-Section 12
-Subsection b-2
| Name: |
dei_EntityCentralIndexKey |
| Namespace Prefix: |
dei_ |
| Data Type: |
dei:centralIndexKeyItemType |
| Balance Type: |
na |
| Period Type: |
duration |
|
| X |
- DefinitionIndicate number of shares or other units outstanding of each of registrant's classes of capital or common stock or other ownership interests, if and as stated on cover of related periodic report. Where multiple classes or units exist define each class/interest by adding class of stock items such as Common Class A [Member], Common Class B [Member] or Partnership Interest [Member] onto the Instrument [Domain] of the Entity Listings, Instrument.
| Name: |
dei_EntityCommonStockSharesOutstanding |
| Namespace Prefix: |
dei_ |
| Data Type: |
xbrli:sharesItemType |
| Balance Type: |
na |
| Period Type: |
instant |
|
| X |
- DefinitionIndicate 'Yes' or 'No' whether registrants (1) have filed all reports required to be filed by Section 13 or 15(d) of the Securities Exchange Act of 1934 during the preceding 12 months (or for such shorter period that registrants were required to file such reports), and (2) have been subject to such filing requirements for the past 90 days. This information should be based on the registrant's current or most recent filing containing the related disclosure.
| Name: |
dei_EntityCurrentReportingStatus |
| Namespace Prefix: |
dei_ |
| Data Type: |
dei:yesNoItemType |
| Balance Type: |
na |
| Period Type: |
duration |
|
| X |
- DefinitionIndicate if registrant meets the emerging growth company criteria. Reference 1: http://www.xbrl.org/2003/role/presentationRef
-Publisher SEC
-Name Exchange Act
-Number 240
-Section 12
-Subsection b-2
| Name: |
dei_EntityEmergingGrowthCompany |
| Namespace Prefix: |
dei_ |
| Data Type: |
xbrli:booleanItemType |
| Balance Type: |
na |
| Period Type: |
duration |
|
| X |
- DefinitionCommission file number. The field allows up to 17 characters. The prefix may contain 1-3 digits, the sequence number may contain 1-8 digits, the optional suffix may contain 1-4 characters, and the fields are separated with a hyphen.
| Name: |
dei_EntityFileNumber |
| Namespace Prefix: |
dei_ |
| Data Type: |
dei:fileNumberItemType |
| Balance Type: |
na |
| Period Type: |
duration |
|
| X |
- DefinitionIndicate whether the registrant is one of the following: Large Accelerated Filer, Accelerated Filer, Non-accelerated Filer. Definitions of these categories are stated in Rule 12b-2 of the Exchange Act. This information should be based on the registrant's current or most recent filing containing the related disclosure. Reference 1: http://www.xbrl.org/2003/role/presentationRef
-Publisher SEC
-Name Exchange Act
-Number 240
-Section 12
-Subsection b-2
| Name: |
dei_EntityFilerCategory |
| Namespace Prefix: |
dei_ |
| Data Type: |
dei:filerCategoryItemType |
| Balance Type: |
na |
| Period Type: |
duration |
|
| X |
- DefinitionTwo-character EDGAR code representing the state or country of incorporation.
| Name: |
dei_EntityIncorporationStateCountryCode |
| Namespace Prefix: |
dei_ |
| Data Type: |
dei:edgarStateCountryItemType |
| Balance Type: |
na |
| Period Type: |
duration |
|
| X |
- DefinitionBoolean flag that is true when the registrant has submitted electronically every Interactive Data File required to be submitted pursuant to Rule 405 of Regulation S-T during the preceding 12 months (or for such shorter period that the registrant was required to submit such files). Reference 1: http://www.xbrl.org/2003/role/presentationRef
-Publisher SEC
-Name Regulation S-T
-Number 232
-Section 405
| Name: |
dei_EntityInteractiveDataCurrent |
| Namespace Prefix: |
dei_ |
| Data Type: |
dei:yesNoItemType |
| Balance Type: |
na |
| Period Type: |
duration |
|
| X |
- DefinitionThe aggregate market value of the voting and non-voting common equity held by non-affiliates computed by reference to the price at which the common equity was last sold, or the average bid and asked price of such common equity, as of the last business day of the registrant's most recently completed second fiscal quarter.
| Name: |
dei_EntityPublicFloat |
| Namespace Prefix: |
dei_ |
| Data Type: |
xbrli:monetaryItemType |
| Balance Type: |
credit |
| Period Type: |
instant |
|
| X |
- DefinitionThe exact name of the entity filing the report as specified in its charter, which is required by forms filed with the SEC. Reference 1: http://www.xbrl.org/2003/role/presentationRef
-Publisher SEC
-Name Exchange Act
-Number 240
-Section 12
-Subsection b-2
| Name: |
dei_EntityRegistrantName |
| Namespace Prefix: |
dei_ |
| Data Type: |
xbrli:normalizedStringItemType |
| Balance Type: |
na |
| Period Type: |
duration |
|
| X |
- DefinitionBoolean flag that is true when the registrant is a shell company as defined in Rule 12b-2 of the Exchange Act. Reference 1: http://www.xbrl.org/2003/role/presentationRef
-Publisher SEC
-Name Exchange Act
-Number 240
-Section 12
-Subsection b-2
| Name: |
dei_EntityShellCompany |
| Namespace Prefix: |
dei_ |
| Data Type: |
xbrli:booleanItemType |
| Balance Type: |
na |
| Period Type: |
duration |
|
| X |
- DefinitionIndicates that the company is a Smaller Reporting Company (SRC). Reference 1: http://www.xbrl.org/2003/role/presentationRef
-Publisher SEC
-Name Exchange Act
-Number 240
-Section 12
-Subsection b-2
| Name: |
dei_EntitySmallBusiness |
| Namespace Prefix: |
dei_ |
| Data Type: |
xbrli:booleanItemType |
| Balance Type: |
na |
| Period Type: |
duration |
|
| X |
- DefinitionThe Tax Identification Number (TIN), also known as an Employer Identification Number (EIN), is a unique 9-digit value assigned by the IRS. Reference 1: http://www.xbrl.org/2003/role/presentationRef
-Publisher SEC
-Name Exchange Act
-Number 240
-Section 12
-Subsection b-2
| Name: |
dei_EntityTaxIdentificationNumber |
| Namespace Prefix: |
dei_ |
| Data Type: |
dei:employerIdItemType |
| Balance Type: |
na |
| Period Type: |
duration |
|
| X |
- DefinitionIndicate 'Yes' or 'No' if the registrant is not required to file reports pursuant to Section 13 or Section 15(d) of the Act.
| Name: |
dei_EntityVoluntaryFilers |
| Namespace Prefix: |
dei_ |
| Data Type: |
dei:yesNoItemType |
| Balance Type: |
na |
| Period Type: |
duration |
|
| X |
- DefinitionIndicate 'Yes' or 'No' if the registrant is a well-known seasoned issuer, as defined in Rule 405 of the Securities Act. Is used on Form Type: 10-K, 10-Q, 8-K, 20-F, 6-K, 10-K/A, 10-Q/A, 20-F/A, 6-K/A, N-CSR, N-Q, N-1A. Reference 1: http://www.xbrl.org/2003/role/presentationRef
-Publisher SEC
-Name Securities Act
-Number 230
-Section 405
| Name: |
dei_EntityWellKnownSeasonedIssuer |
| Namespace Prefix: |
dei_ |
| Data Type: |
dei:yesNoItemType |
| Balance Type: |
na |
| Period Type: |
duration |
|
| X |
- ReferencesReference 1: http://www.xbrl.org/2003/role/presentationRef
-Publisher SEC
-Name Form 10-K
-Number 249
-Section 310
Reference 2: http://www.xbrl.org/2003/role/presentationRef
-Publisher SEC
-Name Form 20-F
-Number 249
-Section 220
-Subsection f
Reference 3: http://www.xbrl.org/2003/role/presentationRef
-Publisher SEC
-Name Form 40-F
-Number 249
-Section 240
-Subsection f
| Name: |
dei_IcfrAuditorAttestationFlag |
| Namespace Prefix: |
dei_ |
| Data Type: |
xbrli:booleanItemType |
| Balance Type: |
na |
| Period Type: |
duration |
|
| X |
- DefinitionLocal phone number for entity.
| Name: |
dei_LocalPhoneNumber |
| Namespace Prefix: |
dei_ |
| Data Type: |
xbrli:normalizedStringItemType |
| Balance Type: |
na |
| Period Type: |
duration |
|
| X |
- DefinitionTitle of a 12(b) registered security. Reference 1: http://www.xbrl.org/2003/role/presentationRef
-Publisher SEC
-Name Exchange Act
-Number 240
-Section 12
-Subsection b
| Name: |
dei_Security12bTitle |
| Namespace Prefix: |
dei_ |
| Data Type: |
dei:securityTitleItemType |
| Balance Type: |
na |
| Period Type: |
duration |
|
| X |
- DefinitionName of the Exchange on which a security is registered. Reference 1: http://www.xbrl.org/2003/role/presentationRef
-Publisher SEC
-Name Exchange Act
-Number 240
-Section 12
-Subsection d1-1
| Name: |
dei_SecurityExchangeName |
| Namespace Prefix: |
dei_ |
| Data Type: |
dei:edgarExchangeCodeItemType |
| Balance Type: |
na |
| Period Type: |
duration |
|
| X |
- DefinitionTrading symbol of an instrument as listed on an exchange.
| Name: |
dei_TradingSymbol |
| Namespace Prefix: |
dei_ |
| Data Type: |
dei:tradingSymbolItemType |
| Balance Type: |
na |
| Period Type: |
duration |
|
v3.25.0.1
| X |
- DefinitionPCAOB issued Audit Firm Identifier Reference 1: http://www.xbrl.org/2003/role/presentationRef
-Publisher SEC
-Name Form 10-K
-Number 249
-Section 310
Reference 2: http://www.xbrl.org/2003/role/presentationRef
-Publisher SEC
-Name Form 20-F
-Number 249
-Section 220
-Subsection f
Reference 3: http://www.xbrl.org/2003/role/presentationRef
-Publisher SEC
-Name Form 40-F
-Number 249
-Section 240
-Subsection f
| Name: |
dei_AuditorFirmId |
| Namespace Prefix: |
dei_ |
| Data Type: |
dei:nonemptySequenceNumberItemType |
| Balance Type: |
na |
| Period Type: |
duration |
|
| X |
- ReferencesReference 1: http://www.xbrl.org/2003/role/presentationRef
-Publisher SEC
-Name Form 10-K
-Number 249
-Section 310
Reference 2: http://www.xbrl.org/2003/role/presentationRef
-Publisher SEC
-Name Form 20-F
-Number 249
-Section 220
-Subsection f
Reference 3: http://www.xbrl.org/2003/role/presentationRef
-Publisher SEC
-Name Form 40-F
-Number 249
-Section 240
-Subsection f
| Name: |
dei_AuditorLocation |
| Namespace Prefix: |
dei_ |
| Data Type: |
dei:internationalNameItemType |
| Balance Type: |
na |
| Period Type: |
duration |
|
| X |
- ReferencesReference 1: http://www.xbrl.org/2003/role/presentationRef
-Publisher SEC
-Name Form 10-K
-Number 249
-Section 310
Reference 2: http://www.xbrl.org/2003/role/presentationRef
-Publisher SEC
-Name Form 20-F
-Number 249
-Section 220
-Subsection f
Reference 3: http://www.xbrl.org/2003/role/presentationRef
-Publisher SEC
-Name Form 40-F
-Number 249
-Section 240
-Subsection f
| Name: |
dei_AuditorName |
| Namespace Prefix: |
dei_ |
| Data Type: |
dei:internationalNameItemType |
| Balance Type: |
na |
| Period Type: |
duration |
|
v3.25.0.1
CONSOLIDATED BALANCE SHEETS - USD ($)
$ in Thousands |
Dec. 31, 2024 |
Dec. 31, 2023 |
| Current assets: |
|
|
| Cash and cash equivalents |
$ 748,537
|
$ 560,609
|
| Accounts receivable, net |
143,963
|
115,535
|
| Inventory |
48,942
|
39,309
|
| Prepaid expenses and other current assets |
97,538
|
117,462
|
| Income tax receivable |
67,229
|
52,960
|
| Investments |
674,378
|
734,838
|
| Total current assets |
1,780,587
|
1,620,713
|
| Leasehold improvements, property and equipment, net |
2,390,126
|
2,170,038
|
| Long-term investments |
868,025
|
564,488
|
| Restricted cash |
29,842
|
25,554
|
| Operating lease assets |
4,000,127
|
3,578,548
|
| Other assets |
113,728
|
63,082
|
| Goodwill |
21,939
|
21,939
|
| Total assets |
9,204,374
|
8,044,362
|
| Current liabilities: |
|
|
| Accounts payable |
210,695
|
197,646
|
| Accrued payroll and benefits |
261,913
|
227,537
|
| Accrued liabilities |
179,747
|
147,688
|
| Unearned revenue |
238,577
|
209,680
|
| Current operating lease liabilities |
277,836
|
248,074
|
| Total current liabilities |
1,168,768
|
1,030,625
|
| Commitments and contingencies (Note 11) |
|
|
| Long-term operating lease liabilities |
4,262,782
|
3,803,551
|
| Deferred income tax liabilities |
46,208
|
89,109
|
| Other liabilities |
71,070
|
58,870
|
| Total liabilities |
5,548,828
|
4,982,155
|
| Shareholders' equity: |
|
|
| Preferred stock, $0.01 par value, 600,000 shares authorized, no shares issued as of December 31, 2024 and December 31, 2023, respectively |
0
|
0
|
| Common stock, $0.01 par value, 11,500,000 shares authorized, 1,358,751 and 1,874,139 shares issued as of December 31, 2024 and December 31, 2023, respectively |
13,586
|
18,741
|
| Additional paid-in capital |
2,078,010
|
1,937,794
|
| Treasury stock, at cost, 0 and 502,843 common shares as of December 31, 2024 and December 31, 2023, respectively |
0
|
(4,944,656)
|
| Accumulated other comprehensive loss |
(10,282)
|
(6,657)
|
| Retained earnings |
1,574,232
|
6,056,985
|
| Total shareholders' equity |
3,655,546
|
3,062,207
|
| Total liabilities and shareholders' equity |
$ 9,204,374
|
$ 8,044,362
|
| X |
- DefinitionCarrying value as of the balance sheet date of liabilities incurred (and for which invoices have typically been received) and payable to vendors for goods and services received that are used in an entity's business. Used to reflect the current portion of the liabilities (due within one year or within the normal operating cycle if longer). Reference 1: http://fasb.org/us-gaap/role/ref/legacyRef
-Topic 210
-SubTopic 10
-Name Accounting Standards Codification
-Section S99
-Paragraph 1
-Subparagraph (SX 210.5-02(19)(a))
-Publisher FASB
-URI https://asc.fasb.org/1943274/2147480566/210-10-S99-1
Reference 2: http://www.xbrl.org/2003/role/exampleRef
-Topic 852
-SubTopic 10
-Name Accounting Standards Codification
-Section 55
-Paragraph 10
-Publisher FASB
-URI https://asc.fasb.org/1943274/2147481372/852-10-55-10
| Name: |
us-gaap_AccountsPayableCurrent |
| Namespace Prefix: |
us-gaap_ |
| Data Type: |
xbrli:monetaryItemType |
| Balance Type: |
credit |
| Period Type: |
instant |
|
| X |
- DefinitionAmount, after allowance for credit loss, of right to consideration from customer for product sold and service rendered in normal course of business, classified as current. Reference 1: http://www.xbrl.org/2009/role/commonPracticeRef
-Topic 310
-SubTopic 10
-Name Accounting Standards Codification
-Section 45
-Paragraph 2
-Publisher FASB
-URI https://asc.fasb.org/1943274/2147481990/310-10-45-2
| Name: |
us-gaap_AccountsReceivableNetCurrent |
| Namespace Prefix: |
us-gaap_ |
| Data Type: |
xbrli:monetaryItemType |
| Balance Type: |
debit |
| Period Type: |
instant |
|
| X |
- DefinitionCarrying value as of the balance sheet date of obligations incurred and payable, pertaining to costs that are statutory in nature, are incurred on contractual obligations, or accumulate over time and for which invoices have not yet been received or will not be rendered. Examples include taxes, interest, rent and utilities. Used to reflect the current portion of the liabilities (due within one year or within the normal operating cycle if longer). Reference 1: http://fasb.org/us-gaap/role/ref/legacyRef
-Topic 210
-SubTopic 10
-Name Accounting Standards Codification
-Section S99
-Paragraph 1
-Subparagraph (SX 210.5-02(20))
-Publisher FASB
-URI https://asc.fasb.org/1943274/2147480566/210-10-S99-1
| Name: |
us-gaap_AccruedLiabilitiesCurrent |
| Namespace Prefix: |
us-gaap_ |
| Data Type: |
xbrli:monetaryItemType |
| Balance Type: |
credit |
| Period Type: |
instant |
|
| X |
- DefinitionAmount, after tax, of accumulated increase (decrease) in equity from transaction and other event and circumstance from nonowner source. Reference 1: http://fasb.org/us-gaap/role/ref/legacyRef
-Name Accounting Standards Codification
-Topic 220
-SubTopic 10
-Section 45
-Paragraph 14A
-Publisher FASB
-URI https://asc.fasb.org/1943274/2147482790/220-10-45-14A
Reference 2: http://fasb.org/us-gaap/role/ref/legacyRef
-Topic 220
-SubTopic 10
-Name Accounting Standards Codification
-Section 45
-Paragraph 11
-Publisher FASB
-URI https://asc.fasb.org/1943274/2147482790/220-10-45-11
Reference 3: http://www.xbrl.org/2003/role/disclosureRef
-Topic 944
-SubTopic 40
-Name Accounting Standards Codification
-Section 65
-Paragraph 2
-Subparagraph (g)(2)(ii)
-Publisher FASB
-URI https://asc.fasb.org/1943274/2147480016/944-40-65-2
Reference 4: http://www.xbrl.org/2003/role/disclosureRef
-Topic 944
-SubTopic 40
-Name Accounting Standards Codification
-Section 65
-Paragraph 2
-Subparagraph (h)(2)
-Publisher FASB
-URI https://asc.fasb.org/1943274/2147480016/944-40-65-2
Reference 5: http://www.xbrl.org/2003/role/disclosureRef
-Topic 210
-SubTopic 10
-Name Accounting Standards Codification
-Section S99
-Paragraph 1
-Subparagraph (SX 210.5-02(30)(a)(4))
-Publisher FASB
-URI https://asc.fasb.org/1943274/2147480566/210-10-S99-1
Reference 6: http://www.xbrl.org/2003/role/disclosureRef
-Topic 944
-SubTopic 210
-Name Accounting Standards Codification
-Section S99
-Paragraph 1
-Subparagraph (SX 210.7-03(a)(23)(a)(3))
-Publisher FASB
-URI https://asc.fasb.org/1943274/2147478777/944-210-S99-1
Reference 7: http://fasb.org/us-gaap/role/ref/legacyRef
-Name Accounting Standards Codification
-Topic 220
-SubTopic 10
-Section 45
-Paragraph 14
-Publisher FASB
-URI https://asc.fasb.org/1943274/2147482790/220-10-45-14
| Name: |
us-gaap_AccumulatedOtherComprehensiveIncomeLossNetOfTax |
| Namespace Prefix: |
us-gaap_ |
| Data Type: |
xbrli:monetaryItemType |
| Balance Type: |
credit |
| Period Type: |
instant |
|
| X |
- DefinitionValue received from shareholders in common stock-related transactions that are in excess of par value or stated value and amounts received from other stock-related transactions. Includes only common stock transactions (excludes preferred stock transactions). May be called contributed capital, capital in excess of par, capital surplus, or paid-in capital. Reference 1: http://fasb.org/us-gaap/role/ref/legacyRef
-Topic 210
-SubTopic 10
-Name Accounting Standards Codification
-Section S99
-Paragraph 1
-Subparagraph (SX 210.5-02(30)(a)(1))
-Publisher FASB
-URI https://asc.fasb.org/1943274/2147480566/210-10-S99-1
| Name: |
us-gaap_AdditionalPaidInCapitalCommonStock |
| Namespace Prefix: |
us-gaap_ |
| Data Type: |
xbrli:monetaryItemType |
| Balance Type: |
credit |
| Period Type: |
instant |
|
| X |
- DefinitionAmount of asset recognized for present right to economic benefit. Reference 1: http://www.xbrl.org/2003/role/exampleRef
-Topic 280
-SubTopic 10
-Name Accounting Standards Codification
-Section 55
-Paragraph 48
-Publisher FASB
-URI https://asc.fasb.org/1943274/2147482785/280-10-55-48
Reference 2: http://www.xbrl.org/2003/role/exampleRef
-Topic 280
-SubTopic 10
-Name Accounting Standards Codification
-Section 55
-Paragraph 49
-Publisher FASB
-URI https://asc.fasb.org/1943274/2147482785/280-10-55-49
Reference 3: http://www.xbrl.org/2003/role/disclosureRef
-Topic 270
-SubTopic 10
-Name Accounting Standards Codification
-Section 50
-Paragraph 1
-Subparagraph (i)
-Publisher FASB
-URI https://asc.fasb.org/1943274/2147482964/270-10-50-1
Reference 4: http://www.xbrl.org/2003/role/disclosureRef
-Topic 280
-SubTopic 10
-Name Accounting Standards Codification
-Section 50
-Paragraph 32
-Subparagraph (ee)
-Publisher FASB
-URI https://asc.fasb.org/1943274/2147482810/280-10-50-32
Reference 5: http://fasb.org/us-gaap/role/ref/otherTransitionRef
-Topic 280
-SubTopic 10
-Name Accounting Standards Codification
-Section 50
-Paragraph 32
-Subparagraph (d)
-Publisher FASB
-URI https://asc.fasb.org/1943274/2147482810/280-10-50-32
Reference 6: http://www.xbrl.org/2003/role/disclosureRef
-Topic 280
-SubTopic 10
-Name Accounting Standards Codification
-Section 50
-Paragraph 22
-Publisher FASB
-URI https://asc.fasb.org/1943274/2147482810/280-10-50-22
Reference 7: http://www.xbrl.org/2003/role/disclosureRef
-Topic 810
-SubTopic 10
-Name Accounting Standards Codification
-Section 50
-Paragraph 3
-Subparagraph (bb)
-Publisher FASB
-URI https://asc.fasb.org/1943274/2147481203/810-10-50-3
Reference 8: http://www.xbrl.org/2003/role/disclosureRef
-Topic 810
-SubTopic 10
-Name Accounting Standards Codification
-Section 45
-Paragraph 25
-Subparagraph (a)
-Publisher FASB
-URI https://asc.fasb.org/1943274/2147481231/810-10-45-25
Reference 9: http://www.xbrl.org/2003/role/disclosureRef
-Topic 235
-SubTopic 10
-Name Accounting Standards Codification
-Section S99
-Paragraph 1
-Subparagraph (SX 210.4-08(g)(1)(ii))
-Publisher FASB
-URI https://asc.fasb.org/1943274/2147480678/235-10-S99-1
Reference 10: http://www.xbrl.org/2003/role/disclosureRef
-Topic 323
-SubTopic 10
-Name Accounting Standards Codification
-Section 50
-Paragraph 3
-Subparagraph (c)
-Publisher FASB
-URI https://asc.fasb.org/1943274/2147481687/323-10-50-3
Reference 11: http://www.xbrl.org/2003/role/disclosureRef
-Topic 825
-SubTopic 10
-Name Accounting Standards Codification
-Section 50
-Paragraph 28
-Subparagraph (f)
-Publisher FASB
-URI https://asc.fasb.org/1943274/2147482907/825-10-50-28
Reference 12: http://www.xbrl.org/2003/role/exampleRef
-Topic 852
-SubTopic 10
-Name Accounting Standards Codification
-Section 55
-Paragraph 10
-Publisher FASB
-URI https://asc.fasb.org/1943274/2147481372/852-10-55-10
Reference 13: http://www.xbrl.org/2003/role/exampleRef
-Topic 946
-SubTopic 830
-Name Accounting Standards Codification
-Section 55
-Paragraph 12
-Publisher FASB
-URI https://asc.fasb.org/1943274/2147479168/946-830-55-12
Reference 14: http://www.xbrl.org/2003/role/disclosureRef
-Topic 944
-SubTopic 210
-Name Accounting Standards Codification
-Section S99
-Paragraph 1
-Subparagraph (SX 210.7-03(a)(12))
-Publisher FASB
-URI https://asc.fasb.org/1943274/2147478777/944-210-S99-1
Reference 15: http://www.xbrl.org/2003/role/disclosureRef
-Topic 946
-SubTopic 210
-Name Accounting Standards Codification
-Section S99
-Paragraph 1
-Subparagraph (SX 210.6-04(8))
-Publisher FASB
-URI https://asc.fasb.org/1943274/2147479170/946-210-S99-1
Reference 16: http://www.xbrl.org/2003/role/disclosureRef
-Topic 210
-SubTopic 10
-Name Accounting Standards Codification
-Section S99
-Paragraph 1
-Subparagraph (SX 210.5-02(18))
-Publisher FASB
-URI https://asc.fasb.org/1943274/2147480566/210-10-S99-1
Reference 17: http://www.xbrl.org/2003/role/disclosureRef
-Topic 470
-SubTopic 10
-Name Accounting Standards Codification
-Section S99
-Paragraph 1A
-Subparagraph (SX 210.13-01(a)(4)(i))
-Publisher FASB
-URI https://asc.fasb.org/1943274/2147480097/470-10-S99-1A
Reference 18: http://www.xbrl.org/2009/role/commonPracticeRef
-Topic 470
-SubTopic 10
-Name Accounting Standards Codification
-Section S99
-Paragraph 1A
-Subparagraph (SX 210.13-01(a)(4)(ii))
-Publisher FASB
-URI https://asc.fasb.org/1943274/2147480097/470-10-S99-1A
Reference 19: http://www.xbrl.org/2009/role/commonPracticeRef
-Topic 470
-SubTopic 10
-Name Accounting Standards Codification
-Section S99
-Paragraph 1A
-Subparagraph (SX 210.13-01(a)(4)(iii))
-Publisher FASB
-URI https://asc.fasb.org/1943274/2147480097/470-10-S99-1A
Reference 20: http://www.xbrl.org/2003/role/disclosureRef
-Topic 470
-SubTopic 10
-Name Accounting Standards Codification
-Section S99
-Paragraph 1A
-Subparagraph (SX 210.13-01(a)(4)(iii)(A))
-Publisher FASB
-URI https://asc.fasb.org/1943274/2147480097/470-10-S99-1A
Reference 21: http://www.xbrl.org/2003/role/disclosureRef
-Topic 470
-SubTopic 10
-Name Accounting Standards Codification
-Section S99
-Paragraph 1A
-Subparagraph (SX 210.13-01(a)(4)(iv))
-Publisher FASB
-URI https://asc.fasb.org/1943274/2147480097/470-10-S99-1A
Reference 22: http://www.xbrl.org/2003/role/disclosureRef
-Topic 470
-SubTopic 10
-Name Accounting Standards Codification
-Section S99
-Paragraph 1A
-Subparagraph (SX 210.13-01(a)(5))
-Publisher FASB
-URI https://asc.fasb.org/1943274/2147480097/470-10-S99-1A
Reference 23: http://www.xbrl.org/2003/role/disclosureRef
-Topic 470
-SubTopic 10
-Name Accounting Standards Codification
-Section S99
-Paragraph 1B
-Subparagraph (SX 210.13-02(a)(4)(i))
-Publisher FASB
-URI https://asc.fasb.org/1943274/2147480097/470-10-S99-1B
Reference 24: http://www.xbrl.org/2003/role/disclosureRef
-Topic 470
-SubTopic 10
-Name Accounting Standards Codification
-Section S99
-Paragraph 1B
-Subparagraph (SX 210.13-02(a)(4)(iii)(A))
-Publisher FASB
-URI https://asc.fasb.org/1943274/2147480097/470-10-S99-1B
Reference 25: http://www.xbrl.org/2003/role/disclosureRef
-Topic 470
-SubTopic 10
-Name Accounting Standards Codification
-Section S99
-Paragraph 1B
-Subparagraph (SX 210.13-02(a)(4)(iii)(B))
-Publisher FASB
-URI https://asc.fasb.org/1943274/2147480097/470-10-S99-1B
Reference 26: http://www.xbrl.org/2003/role/disclosureRef
-Topic 470
-SubTopic 10
-Name Accounting Standards Codification
-Section S99
-Paragraph 1B
-Subparagraph (SX 210.13-02(a)(4)(iv))
-Publisher FASB
-URI https://asc.fasb.org/1943274/2147480097/470-10-S99-1B
Reference 27: http://www.xbrl.org/2003/role/disclosureRef
-Topic 470
-SubTopic 10
-Name Accounting Standards Codification
-Section S99
-Paragraph 1B
-Subparagraph (SX 210.13-02(a)(5))
-Publisher FASB
-URI https://asc.fasb.org/1943274/2147480097/470-10-S99-1B
Reference 28: http://www.xbrl.org/2009/role/commonPracticeRef
-Topic 852
-SubTopic 10
-Name Accounting Standards Codification
-Section 50
-Paragraph 7
-Subparagraph (a)
-Publisher FASB
-URI https://asc.fasb.org/1943274/2147481404/852-10-50-7
Reference 29: http://www.xbrl.org/2003/role/disclosureRef
-Topic 280
-SubTopic 10
-Name Accounting Standards Codification
-Section 50
-Paragraph 30
-Subparagraph (c)
-Publisher FASB
-URI https://asc.fasb.org/1943274/2147482810/280-10-50-30
Reference 30: http://fasb.org/us-gaap/role/ref/legacyRef
-Topic 942
-SubTopic 210
-Name Accounting Standards Codification
-Section S99
-Paragraph 1
-Subparagraph (SX 210.9-03(11))
-Publisher FASB
-URI https://asc.fasb.org/1943274/2147478546/942-210-S99-1
| Name: |
us-gaap_Assets |
| Namespace Prefix: |
us-gaap_ |
| Data Type: |
xbrli:monetaryItemType |
| Balance Type: |
debit |
| Period Type: |
instant |
|
| X |
- DefinitionAmount of asset recognized for present right to economic benefit, classified as current. Reference 1: http://www.xbrl.org/2003/role/disclosureRef
-Topic 810
-SubTopic 10
-Name Accounting Standards Codification
-Section 50
-Paragraph 3
-Subparagraph (bb)
-Publisher FASB
-URI https://asc.fasb.org/1943274/2147481203/810-10-50-3
Reference 2: http://www.xbrl.org/2003/role/disclosureRef
-Topic 810
-SubTopic 10
-Name Accounting Standards Codification
-Section 45
-Paragraph 25
-Subparagraph (a)
-Publisher FASB
-URI https://asc.fasb.org/1943274/2147481231/810-10-45-25
Reference 3: http://www.xbrl.org/2003/role/disclosureRef
-Topic 235
-SubTopic 10
-Name Accounting Standards Codification
-Section S99
-Paragraph 1
-Subparagraph (SX 210.4-08(g)(1)(ii))
-Publisher FASB
-URI https://asc.fasb.org/1943274/2147480678/235-10-S99-1
Reference 4: http://www.xbrl.org/2003/role/disclosureRef
-Topic 323
-SubTopic 10
-Name Accounting Standards Codification
-Section 50
-Paragraph 3
-Subparagraph (c)
-Publisher FASB
-URI https://asc.fasb.org/1943274/2147481687/323-10-50-3
Reference 5: http://www.xbrl.org/2003/role/disclosureRef
-Topic 825
-SubTopic 10
-Name Accounting Standards Codification
-Section 50
-Paragraph 28
-Subparagraph (f)
-Publisher FASB
-URI https://asc.fasb.org/1943274/2147482907/825-10-50-28
Reference 6: http://www.xbrl.org/2003/role/exampleRef
-Topic 852
-SubTopic 10
-Name Accounting Standards Codification
-Section 55
-Paragraph 10
-Publisher FASB
-URI https://asc.fasb.org/1943274/2147481372/852-10-55-10
Reference 7: http://www.xbrl.org/2003/role/disclosureRef
-Topic 210
-SubTopic 10
-Name Accounting Standards Codification
-Section 45
-Paragraph 1
-Publisher FASB
-URI https://asc.fasb.org/1943274/2147483467/210-10-45-1
Reference 8: http://www.xbrl.org/2003/role/disclosureRef
-Topic 210
-SubTopic 10
-Name Accounting Standards Codification
-Section S99
-Paragraph 1
-Subparagraph (SX 210.5-02(9))
-Publisher FASB
-URI https://asc.fasb.org/1943274/2147480566/210-10-S99-1
Reference 9: http://www.xbrl.org/2003/role/disclosureRef
-Topic 470
-SubTopic 10
-Name Accounting Standards Codification
-Section S99
-Paragraph 1A
-Subparagraph (SX 210.13-01(a)(4)(i))
-Publisher FASB
-URI https://asc.fasb.org/1943274/2147480097/470-10-S99-1A
Reference 10: http://www.xbrl.org/2009/role/commonPracticeRef
-Topic 470
-SubTopic 10
-Name Accounting Standards Codification
-Section S99
-Paragraph 1A
-Subparagraph (SX 210.13-01(a)(4)(ii))
-Publisher FASB
-URI https://asc.fasb.org/1943274/2147480097/470-10-S99-1A
Reference 11: http://www.xbrl.org/2009/role/commonPracticeRef
-Topic 470
-SubTopic 10
-Name Accounting Standards Codification
-Section S99
-Paragraph 1A
-Subparagraph (SX 210.13-01(a)(4)(iii))
-Publisher FASB
-URI https://asc.fasb.org/1943274/2147480097/470-10-S99-1A
Reference 12: http://www.xbrl.org/2003/role/disclosureRef
-Topic 470
-SubTopic 10
-Name Accounting Standards Codification
-Section S99
-Paragraph 1A
-Subparagraph (SX 210.13-01(a)(4)(iii)(A))
-Publisher FASB
-URI https://asc.fasb.org/1943274/2147480097/470-10-S99-1A
Reference 13: http://www.xbrl.org/2003/role/disclosureRef
-Topic 470
-SubTopic 10
-Name Accounting Standards Codification
-Section S99
-Paragraph 1A
-Subparagraph (SX 210.13-01(a)(4)(iv))
-Publisher FASB
-URI https://asc.fasb.org/1943274/2147480097/470-10-S99-1A
Reference 14: http://www.xbrl.org/2003/role/disclosureRef
-Topic 470
-SubTopic 10
-Name Accounting Standards Codification
-Section S99
-Paragraph 1A
-Subparagraph (SX 210.13-01(a)(5))
-Publisher FASB
-URI https://asc.fasb.org/1943274/2147480097/470-10-S99-1A
Reference 15: http://www.xbrl.org/2003/role/disclosureRef
-Topic 470
-SubTopic 10
-Name Accounting Standards Codification
-Section S99
-Paragraph 1B
-Subparagraph (SX 210.13-02(a)(4)(i))
-Publisher FASB
-URI https://asc.fasb.org/1943274/2147480097/470-10-S99-1B
Reference 16: http://www.xbrl.org/2003/role/disclosureRef
-Topic 470
-SubTopic 10
-Name Accounting Standards Codification
-Section S99
-Paragraph 1B
-Subparagraph (SX 210.13-02(a)(4)(iii)(A))
-Publisher FASB
-URI https://asc.fasb.org/1943274/2147480097/470-10-S99-1B
Reference 17: http://www.xbrl.org/2003/role/disclosureRef
-Topic 470
-SubTopic 10
-Name Accounting Standards Codification
-Section S99
-Paragraph 1B
-Subparagraph (SX 210.13-02(a)(4)(iii)(B))
-Publisher FASB
-URI https://asc.fasb.org/1943274/2147480097/470-10-S99-1B
Reference 18: http://www.xbrl.org/2003/role/disclosureRef
-Topic 470
-SubTopic 10
-Name Accounting Standards Codification
-Section S99
-Paragraph 1B
-Subparagraph (SX 210.13-02(a)(4)(iv))
-Publisher FASB
-URI https://asc.fasb.org/1943274/2147480097/470-10-S99-1B
Reference 19: http://www.xbrl.org/2003/role/disclosureRef
-Topic 470
-SubTopic 10
-Name Accounting Standards Codification
-Section S99
-Paragraph 1B
-Subparagraph (SX 210.13-02(a)(5))
-Publisher FASB
-URI https://asc.fasb.org/1943274/2147480097/470-10-S99-1B
Reference 20: http://www.xbrl.org/2009/role/commonPracticeRef
-Topic 852
-SubTopic 10
-Name Accounting Standards Codification
-Section 50
-Paragraph 7
-Subparagraph (a)
-Publisher FASB
-URI https://asc.fasb.org/1943274/2147481404/852-10-50-7
| Name: |
us-gaap_AssetsCurrent |
| Namespace Prefix: |
us-gaap_ |
| Data Type: |
xbrli:monetaryItemType |
| Balance Type: |
debit |
| Period Type: |
instant |
|
| X |
- References
+ Details
| Name: |
us-gaap_AssetsCurrentAbstract |
| Namespace Prefix: |
us-gaap_ |
| Data Type: |
xbrli:stringItemType |
| Balance Type: |
na |
| Period Type: |
duration |
|
| X |
- DefinitionAmount of currency on hand as well as demand deposits with banks or financial institutions. Includes other kinds of accounts that have the general characteristics of demand deposits. Also includes short-term, highly liquid investments that are both readily convertible to known amounts of cash and so near their maturity that they present insignificant risk of changes in value because of changes in interest rates. Excludes cash and cash equivalents within disposal group and discontinued operation. Reference 1: http://www.xbrl.org/2003/role/disclosureRef
-Topic 210
-SubTopic 10
-Name Accounting Standards Codification
-Section S99
-Paragraph 1
-Subparagraph (SX 210.5-02(1))
-Publisher FASB
-URI https://asc.fasb.org/1943274/2147480566/210-10-S99-1
Reference 2: http://www.xbrl.org/2003/role/exampleRef
-Topic 210
-SubTopic 10
-Name Accounting Standards Codification
-Section 45
-Paragraph 1
-Subparagraph (a)
-Publisher FASB
-URI https://asc.fasb.org/1943274/2147483467/210-10-45-1
Reference 3: http://fasb.org/us-gaap/role/ref/legacyRef
-Name Accounting Standards Codification
-Topic 230
-SubTopic 10
-Section 45
-Paragraph 4
-Publisher FASB
-URI https://asc.fasb.org/1943274/2147482740/230-10-45-4
| Name: |
us-gaap_CashAndCashEquivalentsAtCarryingValue |
| Namespace Prefix: |
us-gaap_ |
| Data Type: |
xbrli:monetaryItemType |
| Balance Type: |
debit |
| Period Type: |
instant |
|
| X |
- DefinitionRepresents the caption on the face of the balance sheet to indicate that the entity has entered into (1) purchase or supply arrangements that will require expending a portion of its resources to meet the terms thereof, and (2) is exposed to potential losses or, less frequently, gains, arising from (a) possible claims against a company's resources due to future performance under contract terms, and (b) possible losses or likely gains from uncertainties that will ultimately be resolved when one or more future events that are deemed likely to occur do occur or fail to occur. Reference 1: http://fasb.org/us-gaap/role/ref/legacyRef
-Topic 942
-SubTopic 210
-Name Accounting Standards Codification
-Section S99
-Paragraph 1
-Subparagraph (SX 210.9-03(17))
-Publisher FASB
-URI https://asc.fasb.org/1943274/2147478546/942-210-S99-1
Reference 2: http://fasb.org/us-gaap/role/ref/legacyRef
-Topic 210
-SubTopic 10
-Name Accounting Standards Codification
-Section S99
-Paragraph 1
-Subparagraph (SX 210.5-02(25))
-Publisher FASB
-URI https://asc.fasb.org/1943274/2147480566/210-10-S99-1
Reference 3: http://www.xbrl.org/2003/role/disclosureRef
-Topic 944
-SubTopic 210
-Name Accounting Standards Codification
-Section S99
-Paragraph 1
-Subparagraph (SX 210.7-03(a)(19))
-Publisher FASB
-URI https://asc.fasb.org/1943274/2147478777/944-210-S99-1
Reference 4: http://www.xbrl.org/2003/role/disclosureRef
-Topic 946
-SubTopic 210
-Name Accounting Standards Codification
-Section S99
-Paragraph 1
-Subparagraph (SX 210.6-04(15))
-Publisher FASB
-URI https://asc.fasb.org/1943274/2147479170/946-210-S99-1
| Name: |
us-gaap_CommitmentsAndContingencies |
| Namespace Prefix: |
us-gaap_ |
| Data Type: |
xbrli:monetaryItemType |
| Balance Type: |
credit |
| Period Type: |
instant |
|
| X |
- DefinitionAggregate par or stated value of issued nonredeemable common stock (or common stock redeemable solely at the option of the issuer). This item includes treasury stock repurchased by the entity. Note: elements for number of nonredeemable common shares, par value and other disclosure concepts are in another section within stockholders' equity. Reference 1: http://fasb.org/us-gaap/role/ref/legacyRef
-Topic 210
-SubTopic 10
-Name Accounting Standards Codification
-Section S99
-Paragraph 1
-Subparagraph (SX 210.5-02(29))
-Publisher FASB
-URI https://asc.fasb.org/1943274/2147480566/210-10-S99-1
Reference 2: http://www.xbrl.org/2003/role/exampleRef
-Topic 852
-SubTopic 10
-Name Accounting Standards Codification
-Section 55
-Paragraph 10
-Publisher FASB
-URI https://asc.fasb.org/1943274/2147481372/852-10-55-10
Reference 3: http://www.xbrl.org/2003/role/disclosureRef
-Topic 944
-SubTopic 210
-Name Accounting Standards Codification
-Section S99
-Paragraph 1
-Subparagraph (SX 210.7-03(a)(22))
-Publisher FASB
-URI https://asc.fasb.org/1943274/2147478777/944-210-S99-1
| Name: |
us-gaap_CommonStockValue |
| Namespace Prefix: |
us-gaap_ |
| Data Type: |
xbrli:monetaryItemType |
| Balance Type: |
credit |
| Period Type: |
instant |
|
| X |
- DefinitionAmount of obligation to transfer good or service to customer for which consideration has been received or is receivable, classified as current. Reference 1: http://www.xbrl.org/2003/role/disclosureRef
-Topic 606
-SubTopic 10
-Name Accounting Standards Codification
-Section 45
-Paragraph 1
-Publisher FASB
-URI https://asc.fasb.org/1943274/2147479837/606-10-45-1
Reference 2: http://www.xbrl.org/2003/role/disclosureRef
-Topic 606
-SubTopic 10
-Name Accounting Standards Codification
-Section 50
-Paragraph 8
-Subparagraph (a)
-Publisher FASB
-URI https://asc.fasb.org/1943274/2147479806/606-10-50-8
Reference 3: http://www.xbrl.org/2003/role/disclosureRef
-Topic 606
-SubTopic 10
-Name Accounting Standards Codification
-Section 45
-Paragraph 2
-Publisher FASB
-URI https://asc.fasb.org/1943274/2147479837/606-10-45-2
| Name: |
us-gaap_ContractWithCustomerLiabilityCurrent |
| Namespace Prefix: |
us-gaap_ |
| Data Type: |
xbrli:monetaryItemType |
| Balance Type: |
credit |
| Period Type: |
instant |
|
| X |
- DefinitionAmount, after accumulated impairment loss, of asset representing future economic benefit arising from other asset acquired in business combination or from joint venture formation or both, that is not individually identified and separately recognized. Reference 1: http://www.xbrl.org/2003/role/exampleRef
-Topic 280
-SubTopic 10
-Name Accounting Standards Codification
-Section 55
-Paragraph 49
-Publisher FASB
-URI https://asc.fasb.org/1943274/2147482785/280-10-55-49
Reference 2: http://www.xbrl.org/2003/role/exampleRef
-Topic 350
-SubTopic 20
-Name Accounting Standards Codification
-Section 55
-Paragraph 24
-Publisher FASB
-URI https://asc.fasb.org/1943274/2147482548/350-20-55-24
Reference 3: http://www.xbrl.org/2003/role/exampleRef
-Topic 820
-SubTopic 10
-Name Accounting Standards Codification
-Section 55
-Paragraph 100
-Subparagraph (d)
-Publisher FASB
-URI https://asc.fasb.org/1943274/2147482078/820-10-55-100
Reference 4: http://www.xbrl.org/2003/role/exampleRef
-Topic 852
-SubTopic 10
-Name Accounting Standards Codification
-Section 55
-Paragraph 10
-Publisher FASB
-URI https://asc.fasb.org/1943274/2147481372/852-10-55-10
Reference 5: http://www.xbrl.org/2003/role/disclosureRef
-Topic 210
-SubTopic 10
-Name Accounting Standards Codification
-Section S99
-Paragraph 1
-Subparagraph (SX 210.5-02(15))
-Publisher FASB
-URI https://asc.fasb.org/1943274/2147480566/210-10-S99-1
Reference 6: http://www.xbrl.org/2003/role/disclosureRef
-Topic 350
-SubTopic 20
-Name Accounting Standards Codification
-Section 45
-Paragraph 1
-Publisher FASB
-URI https://asc.fasb.org/1943274/2147482598/350-20-45-1
Reference 7: http://www.xbrl.org/2009/role/commonPracticeRef
-Topic 350
-SubTopic 20
-Name Accounting Standards Codification
-Section 50
-Paragraph 1
-Subparagraph (a)
-Publisher FASB
-URI https://asc.fasb.org/1943274/2147482573/350-20-50-1
Reference 8: http://www.xbrl.org/2009/role/commonPracticeRef
-Topic 350
-SubTopic 20
-Name Accounting Standards Codification
-Section 50
-Paragraph 1
-Subparagraph (h)
-Publisher FASB
-URI https://asc.fasb.org/1943274/2147482573/350-20-50-1
Reference 9: http://www.xbrl.org/2003/role/disclosureRef
-Topic 942
-SubTopic 210
-Name Accounting Standards Codification
-Section S99
-Paragraph 1
-Subparagraph (SX 210.9-03(10)(1))
-Publisher FASB
-URI https://asc.fasb.org/1943274/2147478546/942-210-S99-1
| Name: |
us-gaap_Goodwill |
| Namespace Prefix: |
us-gaap_ |
| Data Type: |
xbrli:monetaryItemType |
| Balance Type: |
debit |
| Period Type: |
instant |
|
| X |
- DefinitionAmount after valuation and LIFO reserves of inventory expected to be sold, or consumed within one year or operating cycle, if longer. Reference 1: http://www.xbrl.org/2003/role/exampleRef
-Topic 852
-SubTopic 10
-Name Accounting Standards Codification
-Section 55
-Paragraph 10
-Publisher FASB
-URI https://asc.fasb.org/1943274/2147481372/852-10-55-10
Reference 2: http://www.xbrl.org/2003/role/exampleRef
-Topic 210
-SubTopic 10
-Name Accounting Standards Codification
-Section 45
-Paragraph 1
-Subparagraph (b)
-Publisher FASB
-URI https://asc.fasb.org/1943274/2147483467/210-10-45-1
Reference 3: http://www.xbrl.org/2003/role/disclosureRef
-Topic 210
-SubTopic 10
-Name Accounting Standards Codification
-Section S99
-Paragraph 1
-Subparagraph (SX 210.5-02(6))
-Publisher FASB
-URI https://asc.fasb.org/1943274/2147480566/210-10-S99-1
| Name: |
us-gaap_InventoryNet |
| Namespace Prefix: |
us-gaap_ |
| Data Type: |
xbrli:monetaryItemType |
| Balance Type: |
debit |
| Period Type: |
instant |
|
| X |
- DefinitionAmount of liability recognized for present obligation requiring transfer or otherwise providing economic benefit to others. Reference 1: http://fasb.org/us-gaap/role/ref/legacyRef
-Name Accounting Standards Codification
-Section S99
-Paragraph 1
-Subparagraph (SX 210.5-02(22))
-SubTopic 10
-Topic 210
-Publisher FASB
-URI https://asc.fasb.org/1943274/2147480566/210-10-S99-1
Reference 2: http://fasb.org/us-gaap/role/ref/legacyRef
-Topic 210
-SubTopic 10
-Name Accounting Standards Codification
-Section S99
-Paragraph 1
-Subparagraph (SX 210.5-02(20))
-Publisher FASB
-URI https://asc.fasb.org/1943274/2147480566/210-10-S99-1
Reference 3: http://fasb.org/us-gaap/role/ref/legacyRef
-Topic 210
-SubTopic 10
-Name Accounting Standards Codification
-Section S99
-Paragraph 1
-Subparagraph (SX 210.5-02(24))
-Publisher FASB
-URI https://asc.fasb.org/1943274/2147480566/210-10-S99-1
Reference 4: http://fasb.org/us-gaap/role/ref/legacyRef
-Topic 210
-SubTopic 10
-Name Accounting Standards Codification
-Section S99
-Paragraph 1
-Subparagraph (SX 210.5-02(19))
-Publisher FASB
-URI https://asc.fasb.org/1943274/2147480566/210-10-S99-1
Reference 5: http://fasb.org/us-gaap/role/ref/legacyRef
-Topic 210
-SubTopic 10
-Name Accounting Standards Codification
-Section S99
-Paragraph 1
-Subparagraph (SX 210.5-02(25))
-Publisher FASB
-URI https://asc.fasb.org/1943274/2147480566/210-10-S99-1
Reference 6: http://fasb.org/us-gaap/role/ref/legacyRef
-Topic 210
-SubTopic 10
-Name Accounting Standards Codification
-Section S99
-Paragraph 1
-Subparagraph (SX 210.5-02(26))
-Publisher FASB
-URI https://asc.fasb.org/1943274/2147480566/210-10-S99-1
Reference 7: http://fasb.org/us-gaap/role/ref/legacyRef
-Topic 210
-SubTopic 10
-Name Accounting Standards Codification
-Section S99
-Paragraph 1
-Subparagraph (SX 210.5-02(23))
-Publisher FASB
-URI https://asc.fasb.org/1943274/2147480566/210-10-S99-1
Reference 8: http://fasb.org/us-gaap/role/ref/legacyRef
-Topic 210
-SubTopic 10
-Name Accounting Standards Codification
-Section S99
-Paragraph 1
-Subparagraph (SX 210.5-02(21))
-Publisher FASB
-URI https://asc.fasb.org/1943274/2147480566/210-10-S99-1
Reference 9: http://www.xbrl.org/2003/role/disclosureRef
-Topic 810
-SubTopic 10
-Name Accounting Standards Codification
-Section 50
-Paragraph 3
-Subparagraph (c)
-Publisher FASB
-URI https://asc.fasb.org/1943274/2147481203/810-10-50-3
Reference 10: http://www.xbrl.org/2003/role/disclosureRef
-Topic 810
-SubTopic 10
-Name Accounting Standards Codification
-Section 45
-Paragraph 25
-Subparagraph (b)
-Publisher FASB
-URI https://asc.fasb.org/1943274/2147481231/810-10-45-25
Reference 11: http://www.xbrl.org/2003/role/disclosureRef
-Topic 810
-SubTopic 10
-Name Accounting Standards Codification
-Section 50
-Paragraph 3
-Subparagraph (bb)
-Publisher FASB
-URI https://asc.fasb.org/1943274/2147481203/810-10-50-3
Reference 12: http://www.xbrl.org/2003/role/disclosureRef
-Topic 235
-SubTopic 10
-Name Accounting Standards Codification
-Section S99
-Paragraph 1
-Subparagraph (SX 210.4-08(g)(1)(ii))
-Publisher FASB
-URI https://asc.fasb.org/1943274/2147480678/235-10-S99-1
Reference 13: http://www.xbrl.org/2003/role/disclosureRef
-Topic 323
-SubTopic 10
-Name Accounting Standards Codification
-Section 50
-Paragraph 3
-Subparagraph (c)
-Publisher FASB
-URI https://asc.fasb.org/1943274/2147481687/323-10-50-3
Reference 14: http://www.xbrl.org/2003/role/disclosureRef
-Topic 825
-SubTopic 10
-Name Accounting Standards Codification
-Section 50
-Paragraph 28
-Subparagraph (f)
-Publisher FASB
-URI https://asc.fasb.org/1943274/2147482907/825-10-50-28
Reference 15: http://www.xbrl.org/2003/role/exampleRef
-Topic 946
-SubTopic 830
-Name Accounting Standards Codification
-Section 55
-Paragraph 12
-Publisher FASB
-URI https://asc.fasb.org/1943274/2147479168/946-830-55-12
Reference 16: http://www.xbrl.org/2003/role/disclosureRef
-Topic 946
-SubTopic 210
-Name Accounting Standards Codification
-Section S99
-Paragraph 1
-Subparagraph (SX 210.6-04(14))
-Publisher FASB
-URI https://asc.fasb.org/1943274/2147479170/946-210-S99-1
Reference 17: http://www.xbrl.org/2003/role/disclosureRef
-Topic 470
-SubTopic 10
-Name Accounting Standards Codification
-Section S99
-Paragraph 1A
-Subparagraph (SX 210.13-01(a)(4)(i))
-Publisher FASB
-URI https://asc.fasb.org/1943274/2147480097/470-10-S99-1A
Reference 18: http://www.xbrl.org/2009/role/commonPracticeRef
-Topic 470
-SubTopic 10
-Name Accounting Standards Codification
-Section S99
-Paragraph 1A
-Subparagraph (SX 210.13-01(a)(4)(ii))
-Publisher FASB
-URI https://asc.fasb.org/1943274/2147480097/470-10-S99-1A
Reference 19: http://www.xbrl.org/2003/role/disclosureRef
-Topic 470
-SubTopic 10
-Name Accounting Standards Codification
-Section S99
-Paragraph 1A
-Subparagraph (SX 210.13-01(a)(4)(iii)(A))
-Publisher FASB
-URI https://asc.fasb.org/1943274/2147480097/470-10-S99-1A
Reference 20: http://www.xbrl.org/2003/role/disclosureRef
-Topic 470
-SubTopic 10
-Name Accounting Standards Codification
-Section S99
-Paragraph 1A
-Subparagraph (SX 210.13-01(a)(4)(iv))
-Publisher FASB
-URI https://asc.fasb.org/1943274/2147480097/470-10-S99-1A
Reference 21: http://www.xbrl.org/2003/role/disclosureRef
-Topic 470
-SubTopic 10
-Name Accounting Standards Codification
-Section S99
-Paragraph 1A
-Subparagraph (SX 210.13-01(a)(5))
-Publisher FASB
-URI https://asc.fasb.org/1943274/2147480097/470-10-S99-1A
Reference 22: http://www.xbrl.org/2003/role/disclosureRef
-Topic 470
-SubTopic 10
-Name Accounting Standards Codification
-Section S99
-Paragraph 1B
-Subparagraph (SX 210.13-02(a)(4)(i))
-Publisher FASB
-URI https://asc.fasb.org/1943274/2147480097/470-10-S99-1B
Reference 23: http://www.xbrl.org/2003/role/disclosureRef
-Topic 470
-SubTopic 10
-Name Accounting Standards Codification
-Section S99
-Paragraph 1B
-Subparagraph (SX 210.13-02(a)(4)(iii)(A))
-Publisher FASB
-URI https://asc.fasb.org/1943274/2147480097/470-10-S99-1B
Reference 24: http://www.xbrl.org/2003/role/disclosureRef
-Topic 470
-SubTopic 10
-Name Accounting Standards Codification
-Section S99
-Paragraph 1B
-Subparagraph (SX 210.13-02(a)(4)(iii)(B))
-Publisher FASB
-URI https://asc.fasb.org/1943274/2147480097/470-10-S99-1B
Reference 25: http://www.xbrl.org/2003/role/disclosureRef
-Topic 470
-SubTopic 10
-Name Accounting Standards Codification
-Section S99
-Paragraph 1B
-Subparagraph (SX 210.13-02(a)(4)(iv))
-Publisher FASB
-URI https://asc.fasb.org/1943274/2147480097/470-10-S99-1B
Reference 26: http://www.xbrl.org/2003/role/disclosureRef
-Topic 470
-SubTopic 10
-Name Accounting Standards Codification
-Section S99
-Paragraph 1B
-Subparagraph (SX 210.13-02(a)(5))
-Publisher FASB
-URI https://asc.fasb.org/1943274/2147480097/470-10-S99-1B
Reference 27: http://www.xbrl.org/2009/role/commonPracticeRef
-Topic 852
-SubTopic 10
-Name Accounting Standards Codification
-Section 50
-Paragraph 7
-Subparagraph (a)
-Publisher FASB
-URI https://asc.fasb.org/1943274/2147481404/852-10-50-7
Reference 28: http://www.xbrl.org/2009/role/commonPracticeRef
-Topic 852
-SubTopic 10
-Name Accounting Standards Codification
-Section 50
-Paragraph 7
-Subparagraph (b)
-Publisher FASB
-URI https://asc.fasb.org/1943274/2147481404/852-10-50-7
Reference 29: http://www.xbrl.org/2003/role/exampleRef
-Topic 280
-SubTopic 10
-Name Accounting Standards Codification
-Section 50
-Paragraph 30
-Subparagraph (d)
-Publisher FASB
-URI https://asc.fasb.org/1943274/2147482810/280-10-50-30
| Name: |
us-gaap_Liabilities |
| Namespace Prefix: |
us-gaap_ |
| Data Type: |
xbrli:monetaryItemType |
| Balance Type: |
credit |
| Period Type: |
instant |
|
| X |
- DefinitionAmount of liabilities and equity items, including the portion of equity attributable to noncontrolling interests, if any. Reference 1: http://www.xbrl.org/2003/role/exampleRef
-Topic 852
-SubTopic 10
-Name Accounting Standards Codification
-Section 55
-Paragraph 10
-Publisher FASB
-URI https://asc.fasb.org/1943274/2147481372/852-10-55-10
Reference 2: http://www.xbrl.org/2003/role/disclosureRef
-Topic 944
-SubTopic 210
-Name Accounting Standards Codification
-Section S99
-Paragraph 1
-Subparagraph (SX 210.7-03(a)(25))
-Publisher FASB
-URI https://asc.fasb.org/1943274/2147478777/944-210-S99-1
Reference 3: http://www.xbrl.org/2009/role/commonPracticeRef
-Topic 235
-SubTopic 10
-Name Accounting Standards Codification
-Section S99
-Paragraph 1
-Subparagraph (SX 210.4-08(g)(1)(ii))
-Publisher FASB
-URI https://asc.fasb.org/1943274/2147480678/235-10-S99-1
Reference 4: http://www.xbrl.org/2009/role/commonPracticeRef
-Topic 323
-SubTopic 10
-Name Accounting Standards Codification
-Section 50
-Paragraph 3
-Subparagraph (c)
-Publisher FASB
-URI https://asc.fasb.org/1943274/2147481687/323-10-50-3
Reference 5: http://www.xbrl.org/2009/role/commonPracticeRef
-Topic 825
-SubTopic 10
-Name Accounting Standards Codification
-Section 50
-Paragraph 28
-Subparagraph (f)
-Publisher FASB
-URI https://asc.fasb.org/1943274/2147482907/825-10-50-28
Reference 6: http://fasb.org/us-gaap/role/ref/legacyRef
-Topic 942
-SubTopic 210
-Name Accounting Standards Codification
-Section S99
-Paragraph 1
-Subparagraph (SX 210.9-03(23))
-Publisher FASB
-URI https://asc.fasb.org/1943274/2147478546/942-210-S99-1
Reference 7: http://fasb.org/us-gaap/role/ref/legacyRef
-Topic 210
-SubTopic 10
-Name Accounting Standards Codification
-Section S99
-Paragraph 1
-Subparagraph (SX 210.5-02(32))
-Publisher FASB
-URI https://asc.fasb.org/1943274/2147480566/210-10-S99-1
| Name: |
us-gaap_LiabilitiesAndStockholdersEquity |
| Namespace Prefix: |
us-gaap_ |
| Data Type: |
xbrli:monetaryItemType |
| Balance Type: |
credit |
| Period Type: |
instant |
|
| X |
- DefinitionTotal obligations incurred as part of normal operations that are expected to be paid during the following twelve months or within one business cycle, if longer. Reference 1: http://fasb.org/us-gaap/role/ref/legacyRef
-Topic 210
-SubTopic 10
-Name Accounting Standards Codification
-Section S99
-Paragraph 1
-Subparagraph (SX 210.5-02(21))
-Publisher FASB
-URI https://asc.fasb.org/1943274/2147480566/210-10-S99-1
Reference 2: http://www.xbrl.org/2003/role/disclosureRef
-Topic 810
-SubTopic 10
-Name Accounting Standards Codification
-Section 50
-Paragraph 3
-Subparagraph (c)
-Publisher FASB
-URI https://asc.fasb.org/1943274/2147481203/810-10-50-3
Reference 3: http://www.xbrl.org/2003/role/disclosureRef
-Topic 810
-SubTopic 10
-Name Accounting Standards Codification
-Section 45
-Paragraph 25
-Subparagraph (b)
-Publisher FASB
-URI https://asc.fasb.org/1943274/2147481231/810-10-45-25
Reference 4: http://www.xbrl.org/2003/role/disclosureRef
-Topic 810
-SubTopic 10
-Name Accounting Standards Codification
-Section 50
-Paragraph 3
-Subparagraph (bb)
-Publisher FASB
-URI https://asc.fasb.org/1943274/2147481203/810-10-50-3
Reference 5: http://www.xbrl.org/2003/role/disclosureRef
-Topic 235
-SubTopic 10
-Name Accounting Standards Codification
-Section S99
-Paragraph 1
-Subparagraph (SX 210.4-08(g)(1)(ii))
-Publisher FASB
-URI https://asc.fasb.org/1943274/2147480678/235-10-S99-1
Reference 6: http://www.xbrl.org/2003/role/disclosureRef
-Topic 323
-SubTopic 10
-Name Accounting Standards Codification
-Section 50
-Paragraph 3
-Subparagraph (c)
-Publisher FASB
-URI https://asc.fasb.org/1943274/2147481687/323-10-50-3
Reference 7: http://www.xbrl.org/2003/role/disclosureRef
-Topic 825
-SubTopic 10
-Name Accounting Standards Codification
-Section 50
-Paragraph 28
-Subparagraph (f)
-Publisher FASB
-URI https://asc.fasb.org/1943274/2147482907/825-10-50-28
Reference 8: http://www.xbrl.org/2003/role/exampleRef
-Topic 852
-SubTopic 10
-Name Accounting Standards Codification
-Section 55
-Paragraph 10
-Publisher FASB
-URI https://asc.fasb.org/1943274/2147481372/852-10-55-10
Reference 9: http://www.xbrl.org/2003/role/disclosureRef
-Topic 210
-SubTopic 10
-Name Accounting Standards Codification
-Section 45
-Paragraph 5
-Publisher FASB
-URI https://asc.fasb.org/1943274/2147483467/210-10-45-5
Reference 10: http://www.xbrl.org/2003/role/disclosureRef
-Topic 470
-SubTopic 10
-Name Accounting Standards Codification
-Section S99
-Paragraph 1A
-Subparagraph (SX 210.13-01(a)(4)(i))
-Publisher FASB
-URI https://asc.fasb.org/1943274/2147480097/470-10-S99-1A
Reference 11: http://www.xbrl.org/2009/role/commonPracticeRef
-Topic 470
-SubTopic 10
-Name Accounting Standards Codification
-Section S99
-Paragraph 1A
-Subparagraph (SX 210.13-01(a)(4)(ii))
-Publisher FASB
-URI https://asc.fasb.org/1943274/2147480097/470-10-S99-1A
Reference 12: http://www.xbrl.org/2003/role/disclosureRef
-Topic 470
-SubTopic 10
-Name Accounting Standards Codification
-Section S99
-Paragraph 1A
-Subparagraph (SX 210.13-01(a)(4)(iii)(A))
-Publisher FASB
-URI https://asc.fasb.org/1943274/2147480097/470-10-S99-1A
Reference 13: http://www.xbrl.org/2003/role/disclosureRef
-Topic 470
-SubTopic 10
-Name Accounting Standards Codification
-Section S99
-Paragraph 1A
-Subparagraph (SX 210.13-01(a)(4)(iv))
-Publisher FASB
-URI https://asc.fasb.org/1943274/2147480097/470-10-S99-1A
Reference 14: http://www.xbrl.org/2003/role/disclosureRef
-Topic 470
-SubTopic 10
-Name Accounting Standards Codification
-Section S99
-Paragraph 1A
-Subparagraph (SX 210.13-01(a)(5))
-Publisher FASB
-URI https://asc.fasb.org/1943274/2147480097/470-10-S99-1A
Reference 15: http://www.xbrl.org/2003/role/disclosureRef
-Topic 470
-SubTopic 10
-Name Accounting Standards Codification
-Section S99
-Paragraph 1B
-Subparagraph (SX 210.13-02(a)(4)(i))
-Publisher FASB
-URI https://asc.fasb.org/1943274/2147480097/470-10-S99-1B
Reference 16: http://www.xbrl.org/2003/role/disclosureRef
-Topic 470
-SubTopic 10
-Name Accounting Standards Codification
-Section S99
-Paragraph 1B
-Subparagraph (SX 210.13-02(a)(4)(iii)(A))
-Publisher FASB
-URI https://asc.fasb.org/1943274/2147480097/470-10-S99-1B
Reference 17: http://www.xbrl.org/2003/role/disclosureRef
-Topic 470
-SubTopic 10
-Name Accounting Standards Codification
-Section S99
-Paragraph 1B
-Subparagraph (SX 210.13-02(a)(4)(iii)(B))
-Publisher FASB
-URI https://asc.fasb.org/1943274/2147480097/470-10-S99-1B
Reference 18: http://www.xbrl.org/2003/role/disclosureRef
-Topic 470
-SubTopic 10
-Name Accounting Standards Codification
-Section S99
-Paragraph 1B
-Subparagraph (SX 210.13-02(a)(4)(iv))
-Publisher FASB
-URI https://asc.fasb.org/1943274/2147480097/470-10-S99-1B
Reference 19: http://www.xbrl.org/2003/role/disclosureRef
-Topic 470
-SubTopic 10
-Name Accounting Standards Codification
-Section S99
-Paragraph 1B
-Subparagraph (SX 210.13-02(a)(5))
-Publisher FASB
-URI https://asc.fasb.org/1943274/2147480097/470-10-S99-1B
Reference 20: http://www.xbrl.org/2009/role/commonPracticeRef
-Topic 852
-SubTopic 10
-Name Accounting Standards Codification
-Section 50
-Paragraph 7
-Subparagraph (a)
-Publisher FASB
-URI https://asc.fasb.org/1943274/2147481404/852-10-50-7
Reference 21: http://www.xbrl.org/2009/role/commonPracticeRef
-Topic 852
-SubTopic 10
-Name Accounting Standards Codification
-Section 50
-Paragraph 7
-Subparagraph (b)
-Publisher FASB
-URI https://asc.fasb.org/1943274/2147481404/852-10-50-7
| Name: |
us-gaap_LiabilitiesCurrent |
| Namespace Prefix: |
us-gaap_ |
| Data Type: |
xbrli:monetaryItemType |
| Balance Type: |
credit |
| Period Type: |
instant |
|
| X |
- References
+ Details
| Name: |
us-gaap_LiabilitiesCurrentAbstract |
| Namespace Prefix: |
us-gaap_ |
| Data Type: |
xbrli:stringItemType |
| Balance Type: |
na |
| Period Type: |
duration |
|
| X |
- DefinitionThe total amount of investments that are intended to be held for an extended period of time (longer than one operating cycle). Reference 1: http://www.xbrl.org/2003/role/disclosureRef
-Topic 210
-SubTopic 10
-Name Accounting Standards Codification
-Section S99
-Paragraph 1
-Subparagraph (SX 210.5-02(12))
-Publisher FASB
-URI https://asc.fasb.org/1943274/2147480566/210-10-S99-1
| Name: |
us-gaap_LongTermInvestments |
| Namespace Prefix: |
us-gaap_ |
| Data Type: |
xbrli:monetaryItemType |
| Balance Type: |
debit |
| Period Type: |
instant |
|
| X |
- DefinitionAmount of investment in marketable security, classified as current. Reference 1: http://www.xbrl.org/2009/role/commonPracticeRef
-Topic 210
-SubTopic 10
-Name Accounting Standards Codification
-Section S99
-Paragraph 1
-Subparagraph (SX 210.5-02(2))
-Publisher FASB
-URI https://asc.fasb.org/1943274/2147480566/210-10-S99-1
| Name: |
us-gaap_MarketableSecuritiesCurrent |
| Namespace Prefix: |
us-gaap_ |
| Data Type: |
xbrli:monetaryItemType |
| Balance Type: |
debit |
| Period Type: |
instant |
|
| X |
- DefinitionPresent value of lessee's discounted obligation for lease payments from operating lease, classified as current. Reference 1: http://www.xbrl.org/2003/role/disclosureRef
-Topic 842
-SubTopic 20
-Name Accounting Standards Codification
-Section 45
-Paragraph 1
-Subparagraph (b)
-Publisher FASB
-URI https://asc.fasb.org/1943274/2147479041/842-20-45-1
| Name: |
us-gaap_OperatingLeaseLiabilityCurrent |
| Namespace Prefix: |
us-gaap_ |
| Data Type: |
xbrli:monetaryItemType |
| Balance Type: |
credit |
| Period Type: |
instant |
|
| X |
- DefinitionPresent value of lessee's discounted obligation for lease payments from operating lease, classified as noncurrent. Reference 1: http://www.xbrl.org/2003/role/disclosureRef
-Topic 842
-SubTopic 20
-Name Accounting Standards Codification
-Section 45
-Paragraph 1
-Subparagraph (b)
-Publisher FASB
-URI https://asc.fasb.org/1943274/2147479041/842-20-45-1
| Name: |
us-gaap_OperatingLeaseLiabilityNoncurrent |
| Namespace Prefix: |
us-gaap_ |
| Data Type: |
xbrli:monetaryItemType |
| Balance Type: |
credit |
| Period Type: |
instant |
|
| X |
- DefinitionAmount of lessee's right to use underlying asset under operating lease. Reference 1: http://www.xbrl.org/2003/role/disclosureRef
-Topic 842
-SubTopic 20
-Name Accounting Standards Codification
-Section 45
-Paragraph 1
-Subparagraph (a)
-Publisher FASB
-URI https://asc.fasb.org/1943274/2147479041/842-20-45-1
| Name: |
us-gaap_OperatingLeaseRightOfUseAsset |
| Namespace Prefix: |
us-gaap_ |
| Data Type: |
xbrli:monetaryItemType |
| Balance Type: |
debit |
| Period Type: |
instant |
|
| X |
- DefinitionAmount of noncurrent assets classified as other. Reference 1: http://www.xbrl.org/2003/role/disclosureRef
-Topic 210
-SubTopic 10
-Name Accounting Standards Codification
-Section S99
-Paragraph 1
-Subparagraph (SX 210.5-02(17))
-Publisher FASB
-URI https://asc.fasb.org/1943274/2147480566/210-10-S99-1
| Name: |
us-gaap_OtherAssetsNoncurrent |
| Namespace Prefix: |
us-gaap_ |
| Data Type: |
xbrli:monetaryItemType |
| Balance Type: |
debit |
| Period Type: |
instant |
|
| X |
- DefinitionAmount of liabilities classified as other, due after one year or the normal operating cycle, if longer. Reference 1: http://fasb.org/us-gaap/role/ref/legacyRef
-Topic 210
-SubTopic 10
-Name Accounting Standards Codification
-Section S99
-Paragraph 1
-Subparagraph (SX 210.5-02(24))
-Publisher FASB
-URI https://asc.fasb.org/1943274/2147480566/210-10-S99-1
| Name: |
us-gaap_OtherLiabilitiesNoncurrent |
| Namespace Prefix: |
us-gaap_ |
| Data Type: |
xbrli:monetaryItemType |
| Balance Type: |
credit |
| Period Type: |
instant |
|
| X |
- DefinitionAggregate par or stated value of issued nonredeemable preferred stock (or preferred stock redeemable solely at the option of the issuer). This item includes treasury stock repurchased by the entity. Note: elements for number of nonredeemable preferred shares, par value and other disclosure concepts are in another section within stockholders' equity. Reference 1: http://fasb.org/us-gaap/role/ref/legacyRef
-Topic 210
-SubTopic 10
-Name Accounting Standards Codification
-Section S99
-Paragraph 1
-Subparagraph (SX 210.5-02(28))
-Publisher FASB
-URI https://asc.fasb.org/1943274/2147480566/210-10-S99-1
Reference 2: http://www.xbrl.org/2003/role/exampleRef
-Topic 852
-SubTopic 10
-Name Accounting Standards Codification
-Section 55
-Paragraph 10
-Publisher FASB
-URI https://asc.fasb.org/1943274/2147481372/852-10-55-10
Reference 3: http://www.xbrl.org/2003/role/disclosureRef
-Topic 944
-SubTopic 210
-Name Accounting Standards Codification
-Section S99
-Paragraph 1
-Subparagraph (SX 210.7-03(a)(21))
-Publisher FASB
-URI https://asc.fasb.org/1943274/2147478777/944-210-S99-1
| Name: |
us-gaap_PreferredStockValue |
| Namespace Prefix: |
us-gaap_ |
| Data Type: |
xbrli:monetaryItemType |
| Balance Type: |
credit |
| Period Type: |
instant |
|
| X |
- DefinitionAmount of asset related to consideration paid in advance for costs that provide economic benefits in future periods, and amount of other assets that are expected to be realized or consumed within one year or the normal operating cycle, if longer. Reference 1: http://www.xbrl.org/2009/role/commonPracticeRef
-Topic 210
-SubTopic 10
-Name Accounting Standards Codification
-Section S99
-Paragraph 1
-Subparagraph (SX 210.5-02(9))
-Publisher FASB
-URI https://asc.fasb.org/1943274/2147480566/210-10-S99-1
| Name: |
us-gaap_PrepaidExpenseAndOtherAssetsCurrent |
| Namespace Prefix: |
us-gaap_ |
| Data Type: |
xbrli:monetaryItemType |
| Balance Type: |
debit |
| Period Type: |
instant |
|
| X |
- DefinitionAmount after accumulated depreciation, depletion and amortization of physical assets used in the normal conduct of business to produce goods and services and not intended for resale. Examples include, but are not limited to, land, buildings, machinery and equipment, office equipment, and furniture and fixtures. Reference 1: http://fasb.org/us-gaap/role/ref/legacyRef
-Name Accounting Standards Codification
-Section 50
-Paragraph 1
-SubTopic 10
-Topic 360
-Publisher FASB
-URI https://asc.fasb.org/1943274/2147482099/360-10-50-1
Reference 2: http://www.xbrl.org/2003/role/disclosureRef
-Topic 842
-SubTopic 20
-Name Accounting Standards Codification
-Section 50
-Paragraph 7A
-Subparagraph (a)
-Publisher FASB
-URI https://asc.fasb.org/1943274/2147478964/842-20-50-7A
Reference 3: http://www.xbrl.org/2003/role/exampleRef
-Topic 852
-SubTopic 10
-Name Accounting Standards Codification
-Section 55
-Paragraph 10
-Publisher FASB
-URI https://asc.fasb.org/1943274/2147481372/852-10-55-10
Reference 4: http://www.xbrl.org/2003/role/disclosureRef
-Topic 944
-SubTopic 210
-Name Accounting Standards Codification
-Section S99
-Paragraph 1
-Subparagraph (SX 210.7-03(a)(8))
-Publisher FASB
-URI https://asc.fasb.org/1943274/2147478777/944-210-S99-1
Reference 5: http://www.xbrl.org/2003/role/disclosureRef
-Topic 942
-SubTopic 360
-Name Accounting Standards Codification
-Section 50
-Paragraph 1
-Publisher FASB
-URI https://asc.fasb.org/1943274/2147478451/942-360-50-1
| Name: |
us-gaap_PropertyPlantAndEquipmentNet |
| Namespace Prefix: |
us-gaap_ |
| Data Type: |
xbrli:monetaryItemType |
| Balance Type: |
debit |
| Period Type: |
instant |
|
| X |
- DefinitionAmount of cash restricted as to withdrawal or usage, classified as noncurrent. Cash includes, but is not limited to, currency on hand, demand deposits with banks or financial institutions, and other accounts with general characteristics of demand deposits. Reference 1: http://www.xbrl.org/2009/role/commonPracticeRef
-Topic 210
-SubTopic 10
-Name Accounting Standards Codification
-Section S99
-Paragraph 1
-Subparagraph (SX 210.5-02(17))
-Publisher FASB
-URI https://asc.fasb.org/1943274/2147480566/210-10-S99-1
Reference 2: http://www.xbrl.org/2003/role/disclosureRef
-Name Accounting Standards Codification
-Section 45
-Paragraph 5
-SubTopic 210
-Topic 954
-Publisher FASB
-URI https://asc.fasb.org/1943274/2147477220/954-210-45-5
Reference 3: http://www.xbrl.org/2009/role/commonPracticeRef
-Topic 230
-SubTopic 10
-Name Accounting Standards Codification
-Section 50
-Paragraph 8
-Publisher FASB
-URI https://asc.fasb.org/1943274/2147482913/230-10-50-8
| Name: |
us-gaap_RestrictedCashNoncurrent |
| Namespace Prefix: |
us-gaap_ |
| Data Type: |
xbrli:monetaryItemType |
| Balance Type: |
debit |
| Period Type: |
instant |
|
| X |
- DefinitionAmount of accumulated undistributed earnings (deficit). Reference 1: http://fasb.org/us-gaap/role/ref/legacyRef
-Topic 210
-SubTopic 10
-Name Accounting Standards Codification
-Section S99
-Paragraph 1
-Subparagraph (SX 210.5-02(30)(a)(3))
-Publisher FASB
-URI https://asc.fasb.org/1943274/2147480566/210-10-S99-1
Reference 2: http://www.xbrl.org/2003/role/exampleRef
-Topic 852
-SubTopic 10
-Name Accounting Standards Codification
-Section 55
-Paragraph 10
-Publisher FASB
-URI https://asc.fasb.org/1943274/2147481372/852-10-55-10
Reference 3: http://www.xbrl.org/2003/role/disclosureRef
-Topic 944
-SubTopic 40
-Name Accounting Standards Codification
-Section 65
-Paragraph 2
-Subparagraph (g)(2)(i)
-Publisher FASB
-URI https://asc.fasb.org/1943274/2147480016/944-40-65-2
Reference 4: http://www.xbrl.org/2003/role/disclosureRef
-Topic 944
-SubTopic 40
-Name Accounting Standards Codification
-Section 65
-Paragraph 2
-Subparagraph (h)(2)
-Publisher FASB
-URI https://asc.fasb.org/1943274/2147480016/944-40-65-2
Reference 5: http://www.xbrl.org/2003/role/disclosureRef
-Topic 946
-SubTopic 20
-Name Accounting Standards Codification
-Section 50
-Paragraph 11
-Publisher FASB
-URI https://asc.fasb.org/1943274/2147480990/946-20-50-11
Reference 6: http://www.xbrl.org/2003/role/disclosureRef
-Topic 944
-SubTopic 210
-Name Accounting Standards Codification
-Section S99
-Paragraph 1
-Subparagraph (SX 210.7-03(a)(23)(a)(4))
-Publisher FASB
-URI https://asc.fasb.org/1943274/2147478777/944-210-S99-1
Reference 7: http://www.xbrl.org/2003/role/disclosureRef
-Topic 946
-SubTopic 210
-Name Accounting Standards Codification
-Section S99
-Paragraph 1
-Subparagraph (SX 210.6-04(17))
-Publisher FASB
-URI https://asc.fasb.org/1943274/2147479170/946-210-S99-1
Reference 8: http://fasb.org/us-gaap/role/ref/legacyRef
-Topic 505
-SubTopic 10
-Name Accounting Standards Codification
-Section S99
-Paragraph 1
-Subparagraph (SX 210.3-04)
-Publisher FASB
-URI https://asc.fasb.org/1943274/2147480008/505-10-S99-1
| Name: |
us-gaap_RetainedEarningsAccumulatedDeficit |
| Namespace Prefix: |
us-gaap_ |
| Data Type: |
xbrli:monetaryItemType |
| Balance Type: |
credit |
| Period Type: |
instant |
|
| X |
- DefinitionAmount of equity (deficit) attributable to parent. Excludes temporary equity and equity attributable to noncontrolling interest. Reference 1: http://fasb.org/us-gaap/role/ref/legacyRef
-Topic 210
-SubTopic 10
-Name Accounting Standards Codification
-Section S99
-Paragraph 1
-Subparagraph (SX 210.5-02(29))
-Publisher FASB
-URI https://asc.fasb.org/1943274/2147480566/210-10-S99-1
Reference 2: http://fasb.org/us-gaap/role/ref/legacyRef
-Topic 210
-SubTopic 10
-Name Accounting Standards Codification
-Section S99
-Paragraph 1
-Subparagraph (SX 210.5-02(30))
-Publisher FASB
-URI https://asc.fasb.org/1943274/2147480566/210-10-S99-1
Reference 3: http://fasb.org/us-gaap/role/ref/legacyRef
-Topic 210
-SubTopic 10
-Name Accounting Standards Codification
-Section S99
-Paragraph 1
-Subparagraph (SX 210.5-02(31))
-Publisher FASB
-URI https://asc.fasb.org/1943274/2147480566/210-10-S99-1
Reference 4: http://www.xbrl.org/2003/role/exampleRef
-Topic 852
-SubTopic 10
-Name Accounting Standards Codification
-Section 55
-Paragraph 10
-Publisher FASB
-URI https://asc.fasb.org/1943274/2147481372/852-10-55-10
Reference 5: http://www.xbrl.org/2003/role/exampleRef
-Topic 946
-SubTopic 830
-Name Accounting Standards Codification
-Section 55
-Paragraph 12
-Publisher FASB
-URI https://asc.fasb.org/1943274/2147479168/946-830-55-12
Reference 6: http://www.xbrl.org/2003/role/disclosureRef
-Topic 946
-SubTopic 210
-Name Accounting Standards Codification
-Section S99
-Paragraph 1
-Subparagraph (SX 210.6-04(19))
-Publisher FASB
-URI https://asc.fasb.org/1943274/2147479170/946-210-S99-1
Reference 7: http://www.xbrl.org/2003/role/disclosureRef
-Topic 946
-SubTopic 210
-Name Accounting Standards Codification
-Section S99
-Paragraph 2
-Subparagraph (SX 210.6-05(4))
-Publisher FASB
-URI https://asc.fasb.org/1943274/2147479170/946-210-S99-2
Reference 8: http://www.xbrl.org/2009/role/commonPracticeRef
-Topic 946
-SubTopic 220
-Name Accounting Standards Codification
-Section S99
-Paragraph 3
-Subparagraph (SX 210.6-09(4)(b))
-Publisher FASB
-URI https://asc.fasb.org/1943274/2147479134/946-220-S99-3
Reference 9: http://www.xbrl.org/2003/role/disclosureRef
-Topic 946
-SubTopic 220
-Name Accounting Standards Codification
-Section S99
-Paragraph 3
-Subparagraph (SX 210.6-09(6))
-Publisher FASB
-URI https://asc.fasb.org/1943274/2147479134/946-220-S99-3
Reference 10: http://www.xbrl.org/2003/role/disclosureRef
-Topic 946
-SubTopic 220
-Name Accounting Standards Codification
-Section S99
-Paragraph 3
-Subparagraph (SX 210.6-09(7))
-Publisher FASB
-URI https://asc.fasb.org/1943274/2147479134/946-220-S99-3
Reference 11: http://www.xbrl.org/2009/role/commonPracticeRef
-Topic 235
-SubTopic 10
-Name Accounting Standards Codification
-Section S99
-Paragraph 1
-Subparagraph (SX 210.4-08(g)(1)(ii))
-Publisher FASB
-URI https://asc.fasb.org/1943274/2147480678/235-10-S99-1
Reference 12: http://www.xbrl.org/2009/role/commonPracticeRef
-Topic 323
-SubTopic 10
-Name Accounting Standards Codification
-Section 50
-Paragraph 3
-Subparagraph (c)
-Publisher FASB
-URI https://asc.fasb.org/1943274/2147481687/323-10-50-3
Reference 13: http://www.xbrl.org/2009/role/commonPracticeRef
-Topic 825
-SubTopic 10
-Name Accounting Standards Codification
-Section 50
-Paragraph 28
-Subparagraph (f)
-Publisher FASB
-URI https://asc.fasb.org/1943274/2147482907/825-10-50-28
Reference 14: http://fasb.org/us-gaap/role/ref/legacyRef
-Topic 310
-SubTopic 10
-Name Accounting Standards Codification
-Section S99
-Paragraph 2
-Subparagraph (SAB Topic 4.E)
-Publisher FASB
-URI https://asc.fasb.org/1943274/2147480418/310-10-S99-2
| Name: |
us-gaap_StockholdersEquity |
| Namespace Prefix: |
us-gaap_ |
| Data Type: |
xbrli:monetaryItemType |
| Balance Type: |
credit |
| Period Type: |
instant |
|
| X |
- References
+ Details
| Name: |
us-gaap_StockholdersEquityAbstract |
| Namespace Prefix: |
us-gaap_ |
| Data Type: |
xbrli:stringItemType |
| Balance Type: |
na |
| Period Type: |
duration |
|
| X |
- DefinitionAmount allocated to previously issued common shares repurchased by the issuing entity and held in treasury. Reference 1: http://fasb.org/us-gaap/role/ref/legacyRef
-Topic 210
-SubTopic 10
-Name Accounting Standards Codification
-Section S99
-Paragraph 1
-Subparagraph (SX 210.5-02(30))
-Publisher FASB
-URI https://asc.fasb.org/1943274/2147480566/210-10-S99-1
Reference 2: http://fasb.org/us-gaap/role/ref/legacyRef
-Name Accounting Standards Codification
-Topic 505
-SubTopic 30
-Section 50
-Paragraph 4
-Publisher FASB
-URI https://asc.fasb.org/1943274/2147481520/505-30-50-4
Reference 3: http://fasb.org/us-gaap/role/ref/legacyRef
-Name Accounting Standards Codification
-Topic 505
-SubTopic 30
-Section 45
-Paragraph 1
-Publisher FASB
-URI https://asc.fasb.org/1943274/2147481549/505-30-45-1
| Name: |
us-gaap_TreasuryStockCommonValue |
| Namespace Prefix: |
us-gaap_ |
| Data Type: |
xbrli:monetaryItemType |
| Balance Type: |
debit |
| Period Type: |
instant |
|
v3.25.0.1
CONSOLIDATED BALANCE SHEETS (Parenthetical) - $ / shares
|
Dec. 31, 2024 |
Dec. 31, 2023 |
| Statement of Financial Position [Abstract] |
|
|
| Preferred stock, par value (in usd per share) |
$ 0.01
|
$ 0.01
|
| Preferred stock, authorized (in shares) |
600,000,000
|
600,000,000
|
| Preferred stock, issued (in shares) |
0
|
0
|
| Common stock, par value (in usd per share) |
$ 0.01
|
$ 0.01
|
| Common stock, authorized (in shares) |
11,500,000,000
|
11,500,000,000
|
| Common stock, issued (in shares) |
1,358,751,000
|
1,874,139,000
|
| Ending balance (in shares) |
0
|
502,843,000
|
| X |
- DefinitionFace amount or stated value per share of common stock. Reference 1: http://fasb.org/us-gaap/role/ref/legacyRef
-Topic 210
-SubTopic 10
-Name Accounting Standards Codification
-Section S99
-Paragraph 1
-Subparagraph (SX 210.5-02(29))
-Publisher FASB
-URI https://asc.fasb.org/1943274/2147480566/210-10-S99-1
| Name: |
us-gaap_CommonStockParOrStatedValuePerShare |
| Namespace Prefix: |
us-gaap_ |
| Data Type: |
dtr-types:perShareItemType |
| Balance Type: |
na |
| Period Type: |
instant |
|
| X |
- DefinitionThe maximum number of common shares permitted to be issued by an entity's charter and bylaws. Reference 1: http://fasb.org/us-gaap/role/ref/legacyRef
-Topic 210
-SubTopic 10
-Name Accounting Standards Codification
-Section S99
-Paragraph 1
-Subparagraph (SX 210.5-02(29))
-Publisher FASB
-URI https://asc.fasb.org/1943274/2147480566/210-10-S99-1
Reference 2: http://www.xbrl.org/2003/role/disclosureRef
-Topic 946
-SubTopic 210
-Name Accounting Standards Codification
-Section S99
-Paragraph 1
-Subparagraph (SX 210.6-04(16)(a))
-Publisher FASB
-URI https://asc.fasb.org/1943274/2147479170/946-210-S99-1
| Name: |
us-gaap_CommonStockSharesAuthorized |
| Namespace Prefix: |
us-gaap_ |
| Data Type: |
xbrli:sharesItemType |
| Balance Type: |
na |
| Period Type: |
instant |
|
| X |
- DefinitionTotal number of common shares of an entity that have been sold or granted to shareholders (includes common shares that were issued, repurchased and remain in the treasury). These shares represent capital invested by the firm's shareholders and owners, and may be all or only a portion of the number of shares authorized. Shares issued include shares outstanding and shares held in the treasury. Reference 1: http://fasb.org/us-gaap/role/ref/legacyRef
-Topic 210
-SubTopic 10
-Name Accounting Standards Codification
-Section S99
-Paragraph 1
-Subparagraph (SX 210.5-02(29))
-Publisher FASB
-URI https://asc.fasb.org/1943274/2147480566/210-10-S99-1
| Name: |
us-gaap_CommonStockSharesIssued |
| Namespace Prefix: |
us-gaap_ |
| Data Type: |
xbrli:sharesItemType |
| Balance Type: |
na |
| Period Type: |
instant |
|
| X |
- DefinitionFace amount or stated value per share of preferred stock nonredeemable or redeemable solely at the option of the issuer. Reference 1: http://fasb.org/us-gaap/role/ref/legacyRef
-Topic 210
-SubTopic 10
-Name Accounting Standards Codification
-Section S99
-Paragraph 1
-Subparagraph (SX 210.5-02(28))
-Publisher FASB
-URI https://asc.fasb.org/1943274/2147480566/210-10-S99-1
Reference 2: http://www.xbrl.org/2003/role/disclosureRef
-Topic 505
-SubTopic 10
-Name Accounting Standards Codification
-Section 50
-Paragraph 13
-Subparagraph (a)
-Publisher FASB
-URI https://asc.fasb.org/1943274/2147481112/505-10-50-13
| Name: |
us-gaap_PreferredStockParOrStatedValuePerShare |
| Namespace Prefix: |
us-gaap_ |
| Data Type: |
dtr-types:perShareItemType |
| Balance Type: |
na |
| Period Type: |
instant |
|
| X |
- DefinitionThe maximum number of nonredeemable preferred shares (or preferred stock redeemable solely at the option of the issuer) permitted to be issued by an entity's charter and bylaws. Reference 1: http://fasb.org/us-gaap/role/ref/legacyRef
-Topic 210
-SubTopic 10
-Name Accounting Standards Codification
-Section S99
-Paragraph 1
-Subparagraph (SX 210.5-02(28))
-Publisher FASB
-URI https://asc.fasb.org/1943274/2147480566/210-10-S99-1
Reference 2: http://www.xbrl.org/2003/role/disclosureRef
-Topic 946
-SubTopic 210
-Name Accounting Standards Codification
-Section S99
-Paragraph 1
-Subparagraph (SX 210.6-04(16)(a))
-Publisher FASB
-URI https://asc.fasb.org/1943274/2147479170/946-210-S99-1
| Name: |
us-gaap_PreferredStockSharesAuthorized |
| Namespace Prefix: |
us-gaap_ |
| Data Type: |
xbrli:sharesItemType |
| Balance Type: |
na |
| Period Type: |
instant |
|
| X |
- DefinitionNumber of shares issued for nonredeemable preferred shares and preferred shares redeemable solely at option of issuer. Includes, but is not limited to, preferred shares issued, repurchased, and held as treasury shares. Excludes preferred shares classified as debt. Reference 1: http://fasb.org/us-gaap/role/ref/legacyRef
-Topic 210
-SubTopic 10
-Name Accounting Standards Codification
-Section S99
-Paragraph 1
-Subparagraph (SX 210.5-02(28))
-Publisher FASB
-URI https://asc.fasb.org/1943274/2147480566/210-10-S99-1
Reference 2: http://www.xbrl.org/2003/role/disclosureRef
-Topic 505
-SubTopic 10
-Name Accounting Standards Codification
-Section 50
-Paragraph 13
-Subparagraph (a)
-Publisher FASB
-URI https://asc.fasb.org/1943274/2147481112/505-10-50-13
| Name: |
us-gaap_PreferredStockSharesIssued |
| Namespace Prefix: |
us-gaap_ |
| Data Type: |
xbrli:sharesItemType |
| Balance Type: |
na |
| Period Type: |
instant |
|
| X |
- References
+ Details
| Name: |
us-gaap_StatementOfFinancialPositionAbstract |
| Namespace Prefix: |
us-gaap_ |
| Data Type: |
xbrli:stringItemType |
| Balance Type: |
na |
| Period Type: |
duration |
|
| X |
- DefinitionNumber of previously issued common shares repurchased by the issuing entity and held in treasury. Reference 1: http://fasb.org/us-gaap/role/ref/legacyRef
-Name Accounting Standards Codification
-Topic 505
-SubTopic 30
-Section 45
-Paragraph 1
-Publisher FASB
-URI https://asc.fasb.org/1943274/2147481549/505-30-45-1
| Name: |
us-gaap_TreasuryStockCommonShares |
| Namespace Prefix: |
us-gaap_ |
| Data Type: |
xbrli:sharesItemType |
| Balance Type: |
na |
| Period Type: |
instant |
|
v3.25.0.1
CONSOLIDATED STATEMENTS OF INCOME AND COMPREHENSIVE INCOME - USD ($)
shares in Thousands, $ in Thousands |
12 Months Ended |
Dec. 31, 2024 |
Dec. 31, 2023 |
Dec. 31, 2022 |
| Total revenue |
$ 11,313,853
|
$ 9,871,649
|
$ 8,634,652
|
| Restaurant operating costs (exclusive of depreciation and amortization shown separately below): |
|
|
|
| Food, beverage and packaging |
3,374,516
|
2,912,564
|
2,602,245
|
| Labor |
2,789,789
|
2,440,982
|
2,197,958
|
| Occupancy |
563,374
|
503,264
|
460,425
|
| Other operating costs |
1,568,482
|
1,428,747
|
1,311,905
|
| General and administrative expenses |
697,483
|
633,584
|
564,191
|
| Depreciation and amortization |
335,030
|
319,394
|
286,826
|
| Pre-opening costs |
41,897
|
36,931
|
29,560
|
| Impairment, closure costs, and asset disposals |
26,949
|
38,370
|
21,139
|
| Total operating expenses |
9,397,520
|
8,313,836
|
7,474,249
|
| Income from operations |
1,916,333
|
1,557,813
|
1,160,403
|
| Interest and other income, net |
93,897
|
62,693
|
21,128
|
| Income before income taxes |
2,010,230
|
1,620,506
|
1,181,531
|
| Provision for income taxes |
476,120
|
391,769
|
282,430
|
| Net income |
$ 1,534,110
|
$ 1,228,737
|
$ 899,101
|
| Earnings per share: |
|
|
|
| Basic (in usd per share) |
$ 1.12
|
$ 0.89
|
$ 0.65
|
| Diluted (in usd per share) |
$ 1.11
|
$ 0.89
|
$ 0.64
|
| Weighted-average common shares outstanding: |
|
|
|
| Basic (in shares) |
1,368,343
|
1,377,768
|
1,392,543
|
| Diluted (in shares) |
1,376,555
|
1,385,500
|
1,403,077
|
| Other comprehensive income/(loss), net of income taxes: |
|
|
|
| Foreign currency translation adjustments |
$ (3,625)
|
$ 1,231
|
$ (2,534)
|
| Comprehensive income |
1,530,485
|
1,229,968
|
896,567
|
| Food and beverage revenue |
|
|
|
| Total revenue |
11,247,384
|
9,804,124
|
8,558,001
|
| Delivery service revenue |
|
|
|
| Total revenue |
$ 66,469
|
$ 67,525
|
$ 76,651
|
| X |
- DefinitionAmount after tax of increase (decrease) in equity from transactions and other events and circumstances from net income and other comprehensive income, attributable to parent entity. Excludes changes in equity resulting from investments by owners and distributions to owners. Reference 1: http://www.xbrl.org/2003/role/disclosureRef
-Topic 220
-SubTopic 10
-Name Accounting Standards Codification
-Section S99
-Paragraph 2
-Subparagraph (SX 210.5-03(24))
-Publisher FASB
-URI https://asc.fasb.org/1943274/2147483621/220-10-S99-2
Reference 2: http://www.xbrl.org/2003/role/disclosureRef
-Topic 942
-SubTopic 220
-Name Accounting Standards Codification
-Section S99
-Paragraph 1
-Subparagraph (SX 210.9-04(26))
-Publisher FASB
-URI https://asc.fasb.org/1943274/2147478524/942-220-S99-1
Reference 3: http://www.xbrl.org/2003/role/disclosureRef
-Topic 944
-SubTopic 220
-Name Accounting Standards Codification
-Section S99
-Paragraph 1
-Subparagraph (SX 210.7-04(22))
-Publisher FASB
-URI https://asc.fasb.org/1943274/2147477250/944-220-S99-1
Reference 4: http://www.xbrl.org/2003/role/disclosureRef
-Topic 220
-SubTopic 10
-Name Accounting Standards Codification
-Section 45
-Paragraph 1A
-Subparagraph (c)
-Publisher FASB
-URI https://asc.fasb.org/1943274/2147482790/220-10-45-1A
Reference 5: http://www.xbrl.org/2003/role/disclosureRef
-Topic 220
-SubTopic 10
-Name Accounting Standards Codification
-Section 45
-Paragraph 1B
-Subparagraph (b)
-Publisher FASB
-URI https://asc.fasb.org/1943274/2147482790/220-10-45-1B
Reference 6: http://www.xbrl.org/2003/role/disclosureRef
-Topic 944
-SubTopic 220
-Name Accounting Standards Codification
-Section S99
-Paragraph 1
-Subparagraph (SX 210.7-04(20))
-Publisher FASB
-URI https://asc.fasb.org/1943274/2147477250/944-220-S99-1
Reference 7: http://fasb.org/us-gaap/role/ref/legacyRef
-Name Accounting Standards Codification
-Topic 220
-SubTopic 10
-Section 45
-Paragraph 5
-Publisher FASB
-URI https://asc.fasb.org/1943274/2147482790/220-10-45-5
| Name: |
us-gaap_ComprehensiveIncomeNetOfTax |
| Namespace Prefix: |
us-gaap_ |
| Data Type: |
xbrli:monetaryItemType |
| Balance Type: |
credit |
| Period Type: |
duration |
|
| X |
- DefinitionCost of labor directly related to good produced and service rendered. Includes, but is not limited to, payroll cost and equity-based compensation. Reference 1: http://www.xbrl.org/2009/role/commonPracticeRef
-Topic 220
-SubTopic 10
-Name Accounting Standards Codification
-Section S99
-Paragraph 2
-Subparagraph (SX 210.5-03(2))
-Publisher FASB
-URI https://asc.fasb.org/1943274/2147483621/220-10-S99-2
| Name: |
us-gaap_CostDirectLabor |
| Namespace Prefix: |
us-gaap_ |
| Data Type: |
xbrli:monetaryItemType |
| Balance Type: |
debit |
| Period Type: |
duration |
|
| X |
- DefinitionCost of material used for good produced and service rendered. Reference 1: http://www.xbrl.org/2009/role/commonPracticeRef
-Topic 220
-SubTopic 10
-Name Accounting Standards Codification
-Section S99
-Paragraph 2
-Subparagraph (SX 210.5-03(2))
-Publisher FASB
-URI https://asc.fasb.org/1943274/2147483621/220-10-S99-2
| Name: |
us-gaap_CostDirectMaterial |
| Namespace Prefix: |
us-gaap_ |
| Data Type: |
xbrli:monetaryItemType |
| Balance Type: |
debit |
| Period Type: |
duration |
|
| X |
- DefinitionTotal costs of sales and operating expenses for the period. Reference 1: http://fasb.org/us-gaap/role/ref/legacyRef
-Topic 220
-SubTopic 10
-Name Accounting Standards Codification
-Section S99
-Paragraph 2
-Subparagraph (SX 210.5-03)
-Publisher FASB
-URI https://asc.fasb.org/1943274/2147483621/220-10-S99-2
| Name: |
us-gaap_CostsAndExpenses |
| Namespace Prefix: |
us-gaap_ |
| Data Type: |
xbrli:monetaryItemType |
| Balance Type: |
debit |
| Period Type: |
duration |
|
| X |
- DefinitionThe aggregate expense recognized in the current period that allocates the cost of tangible assets, intangible assets, or depleting assets to periods that benefit from use of the assets. Reference 1: http://fasb.org/us-gaap/role/ref/legacyRef
-Name Accounting Standards Codification
-Section 45
-Paragraph 28
-Subparagraph (b)
-SubTopic 10
-Topic 230
-Publisher FASB
-URI https://asc.fasb.org/1943274/2147482740/230-10-45-28
Reference 2: http://www.xbrl.org/2003/role/exampleRef
-Topic 280
-SubTopic 10
-Name Accounting Standards Codification
-Section 55
-Paragraph 48
-Publisher FASB
-URI https://asc.fasb.org/1943274/2147482785/280-10-55-48
Reference 3: http://www.xbrl.org/2003/role/exampleRef
-Topic 280
-SubTopic 10
-Name Accounting Standards Codification
-Section 55
-Paragraph 49
-Publisher FASB
-URI https://asc.fasb.org/1943274/2147482785/280-10-55-49
Reference 4: http://www.xbrl.org/2003/role/disclosureRef
-Topic 270
-SubTopic 10
-Name Accounting Standards Codification
-Section 50
-Paragraph 1
-Subparagraph (i)
-Publisher FASB
-URI https://asc.fasb.org/1943274/2147482964/270-10-50-1
Reference 5: http://www.xbrl.org/2003/role/disclosureRef
-Topic 280
-SubTopic 10
-Name Accounting Standards Codification
-Section 50
-Paragraph 32
-Subparagraph (ee)
-Publisher FASB
-URI https://asc.fasb.org/1943274/2147482810/280-10-50-32
Reference 6: http://www.xbrl.org/2003/role/disclosureRef
-Topic 280
-SubTopic 10
-Name Accounting Standards Codification
-Section 50
-Paragraph 22
-Subparagraph (e)
-Publisher FASB
-URI https://asc.fasb.org/1943274/2147482810/280-10-50-22
| Name: |
us-gaap_DepreciationDepletionAndAmortization |
| Namespace Prefix: |
us-gaap_ |
| Data Type: |
xbrli:monetaryItemType |
| Balance Type: |
debit |
| Period Type: |
duration |
|
| X |
- References
+ Details
| Name: |
us-gaap_EarningsPerShareAbstract |
| Namespace Prefix: |
us-gaap_ |
| Data Type: |
xbrli:stringItemType |
| Balance Type: |
na |
| Period Type: |
duration |
|
| X |
- DefinitionThe amount of net income (loss) for the period per each share of common stock or unit outstanding during the reporting period. Reference 1: http://www.xbrl.org/2003/role/disclosureRef
-Topic 250
-SubTopic 10
-Name Accounting Standards Codification
-Section 50
-Paragraph 6
-Publisher FASB
-URI https://asc.fasb.org/1943274/2147483443/250-10-50-6
Reference 2: http://www.xbrl.org/2003/role/exampleRef
-Topic 260
-SubTopic 10
-Name Accounting Standards Codification
-Section 55
-Paragraph 52
-Publisher FASB
-URI https://asc.fasb.org/1943274/2147482635/260-10-55-52
Reference 3: http://www.xbrl.org/2003/role/disclosureRef
-Topic 805
-SubTopic 60
-Name Accounting Standards Codification
-Section 65
-Paragraph 1
-Subparagraph (g)
-Publisher FASB
-URI https://asc.fasb.org/1943274/2147476176/805-60-65-1
Reference 4: http://www.xbrl.org/2003/role/disclosureRef
-Topic 740
-SubTopic 323
-Name Accounting Standards Codification
-Section 65
-Paragraph 2
-Subparagraph (g)(3)
-Publisher FASB
-URI https://asc.fasb.org/1943274/2147478666/740-323-65-2
Reference 5: http://www.xbrl.org/2003/role/disclosureRef
-Topic 250
-SubTopic 10
-Name Accounting Standards Codification
-Section 50
-Paragraph 3
-Publisher FASB
-URI https://asc.fasb.org/1943274/2147483443/250-10-50-3
Reference 6: http://www.xbrl.org/2003/role/disclosureRef
-Topic 260
-SubTopic 10
-Name Accounting Standards Codification
-Section 55
-Paragraph 15
-Publisher FASB
-URI https://asc.fasb.org/1943274/2147482635/260-10-55-15
Reference 7: http://www.xbrl.org/2003/role/disclosureRef
-Topic 815
-SubTopic 40
-Name Accounting Standards Codification
-Section 65
-Paragraph 1
-Subparagraph (e)(4)
-Publisher FASB
-URI https://asc.fasb.org/1943274/2147480175/815-40-65-1
Reference 8: http://www.xbrl.org/2003/role/disclosureRef
-Topic 815
-SubTopic 40
-Name Accounting Standards Codification
-Section 65
-Paragraph 1
-Subparagraph (f)
-Publisher FASB
-URI https://asc.fasb.org/1943274/2147480175/815-40-65-1
Reference 9: http://www.xbrl.org/2003/role/disclosureRef
-Topic 250
-SubTopic 10
-Name Accounting Standards Codification
-Section 50
-Paragraph 11
-Subparagraph (a)
-Publisher FASB
-URI https://asc.fasb.org/1943274/2147483443/250-10-50-11
Reference 10: http://www.xbrl.org/2003/role/disclosureRef
-Topic 250
-SubTopic 10
-Name Accounting Standards Codification
-Section 50
-Paragraph 11
-Subparagraph (b)
-Publisher FASB
-URI https://asc.fasb.org/1943274/2147483443/250-10-50-11
Reference 11: http://www.xbrl.org/2003/role/disclosureRef
-Topic 250
-SubTopic 10
-Name Accounting Standards Codification
-Section 50
-Paragraph 7
-Subparagraph (a)
-Publisher FASB
-URI https://asc.fasb.org/1943274/2147483443/250-10-50-7
Reference 12: http://www.xbrl.org/2003/role/disclosureRef
-Topic 260
-SubTopic 10
-Name Accounting Standards Codification
-Section 45
-Paragraph 2
-Publisher FASB
-URI https://asc.fasb.org/1943274/2147482689/260-10-45-2
Reference 13: http://www.xbrl.org/2003/role/disclosureRef
-Topic 260
-SubTopic 10
-Name Accounting Standards Codification
-Section 45
-Paragraph 60B
-Subparagraph (d)
-Publisher FASB
-URI https://asc.fasb.org/1943274/2147482689/260-10-45-60B
Reference 14: http://www.xbrl.org/2003/role/disclosureRef
-Topic 250
-SubTopic 10
-Name Accounting Standards Codification
-Section 50
-Paragraph 4
-Publisher FASB
-URI https://asc.fasb.org/1943274/2147483443/250-10-50-4
Reference 15: http://www.xbrl.org/2003/role/disclosureRef
-Topic 260
-SubTopic 10
-Name Accounting Standards Codification
-Section 50
-Paragraph 1
-Subparagraph (a)
-Publisher FASB
-URI https://asc.fasb.org/1943274/2147482662/260-10-50-1
Reference 16: http://www.xbrl.org/2003/role/disclosureRef
-Topic 260
-SubTopic 10
-Name Accounting Standards Codification
-Section 45
-Paragraph 10
-Publisher FASB
-URI https://asc.fasb.org/1943274/2147482689/260-10-45-10
Reference 17: http://www.xbrl.org/2003/role/disclosureRef
-Topic 220
-SubTopic 10
-Name Accounting Standards Codification
-Section S99
-Paragraph 2
-Subparagraph (SX 210.5-03(25))
-Publisher FASB
-URI https://asc.fasb.org/1943274/2147483621/220-10-S99-2
Reference 18: http://www.xbrl.org/2003/role/disclosureRef
-Topic 942
-SubTopic 220
-Name Accounting Standards Codification
-Section S99
-Paragraph 1
-Subparagraph (SX 210.9-04(27))
-Publisher FASB
-URI https://asc.fasb.org/1943274/2147478524/942-220-S99-1
Reference 19: http://www.xbrl.org/2003/role/disclosureRef
-Topic 944
-SubTopic 220
-Name Accounting Standards Codification
-Section S99
-Paragraph 1
-Subparagraph (SX 210.7-04(23))
-Publisher FASB
-URI https://asc.fasb.org/1943274/2147477250/944-220-S99-1
Reference 20: http://www.xbrl.org/2003/role/disclosureRef
-Topic 260
-SubTopic 10
-Name Accounting Standards Codification
-Section 45
-Paragraph 7
-Publisher FASB
-URI https://asc.fasb.org/1943274/2147482689/260-10-45-7
| Name: |
us-gaap_EarningsPerShareBasic |
| Namespace Prefix: |
us-gaap_ |
| Data Type: |
dtr-types:perShareItemType |
| Balance Type: |
na |
| Period Type: |
duration |
|
| X |
- References
+ Details
| Name: |
us-gaap_EarningsPerShareBasicOtherDisclosuresAbstract |
| Namespace Prefix: |
us-gaap_ |
| Data Type: |
xbrli:stringItemType |
| Balance Type: |
na |
| Period Type: |
duration |
|
| X |
- DefinitionThe amount of net income (loss) for the period available to each share of common stock or common unit outstanding during the reporting period and to each share or unit that would have been outstanding assuming the issuance of common shares or units for all dilutive potential common shares or units outstanding during the reporting period. Reference 1: http://www.xbrl.org/2003/role/disclosureRef
-Topic 250
-SubTopic 10
-Name Accounting Standards Codification
-Section 50
-Paragraph 6
-Publisher FASB
-URI https://asc.fasb.org/1943274/2147483443/250-10-50-6
Reference 2: http://www.xbrl.org/2003/role/exampleRef
-Topic 260
-SubTopic 10
-Name Accounting Standards Codification
-Section 55
-Paragraph 52
-Publisher FASB
-URI https://asc.fasb.org/1943274/2147482635/260-10-55-52
Reference 3: http://www.xbrl.org/2003/role/disclosureRef
-Topic 805
-SubTopic 60
-Name Accounting Standards Codification
-Section 65
-Paragraph 1
-Subparagraph (g)
-Publisher FASB
-URI https://asc.fasb.org/1943274/2147476176/805-60-65-1
Reference 4: http://www.xbrl.org/2003/role/disclosureRef
-Topic 740
-SubTopic 323
-Name Accounting Standards Codification
-Section 65
-Paragraph 2
-Subparagraph (g)(3)
-Publisher FASB
-URI https://asc.fasb.org/1943274/2147478666/740-323-65-2
Reference 5: http://www.xbrl.org/2003/role/disclosureRef
-Topic 250
-SubTopic 10
-Name Accounting Standards Codification
-Section 50
-Paragraph 3
-Publisher FASB
-URI https://asc.fasb.org/1943274/2147483443/250-10-50-3
Reference 6: http://www.xbrl.org/2003/role/disclosureRef
-Topic 260
-SubTopic 10
-Name Accounting Standards Codification
-Section 55
-Paragraph 15
-Publisher FASB
-URI https://asc.fasb.org/1943274/2147482635/260-10-55-15
Reference 7: http://www.xbrl.org/2003/role/disclosureRef
-Topic 815
-SubTopic 40
-Name Accounting Standards Codification
-Section 65
-Paragraph 1
-Subparagraph (e)(4)
-Publisher FASB
-URI https://asc.fasb.org/1943274/2147480175/815-40-65-1
Reference 8: http://www.xbrl.org/2003/role/disclosureRef
-Topic 815
-SubTopic 40
-Name Accounting Standards Codification
-Section 65
-Paragraph 1
-Subparagraph (f)
-Publisher FASB
-URI https://asc.fasb.org/1943274/2147480175/815-40-65-1
Reference 9: http://www.xbrl.org/2003/role/disclosureRef
-Topic 250
-SubTopic 10
-Name Accounting Standards Codification
-Section 50
-Paragraph 11
-Subparagraph (a)
-Publisher FASB
-URI https://asc.fasb.org/1943274/2147483443/250-10-50-11
Reference 10: http://www.xbrl.org/2003/role/disclosureRef
-Topic 250
-SubTopic 10
-Name Accounting Standards Codification
-Section 50
-Paragraph 11
-Subparagraph (b)
-Publisher FASB
-URI https://asc.fasb.org/1943274/2147483443/250-10-50-11
Reference 11: http://www.xbrl.org/2003/role/disclosureRef
-Topic 250
-SubTopic 10
-Name Accounting Standards Codification
-Section 50
-Paragraph 7
-Subparagraph (a)
-Publisher FASB
-URI https://asc.fasb.org/1943274/2147483443/250-10-50-7
Reference 12: http://www.xbrl.org/2003/role/disclosureRef
-Topic 260
-SubTopic 10
-Name Accounting Standards Codification
-Section 45
-Paragraph 2
-Publisher FASB
-URI https://asc.fasb.org/1943274/2147482689/260-10-45-2
Reference 13: http://www.xbrl.org/2003/role/disclosureRef
-Topic 260
-SubTopic 10
-Name Accounting Standards Codification
-Section 45
-Paragraph 60B
-Subparagraph (d)
-Publisher FASB
-URI https://asc.fasb.org/1943274/2147482689/260-10-45-60B
Reference 14: http://www.xbrl.org/2003/role/disclosureRef
-Topic 250
-SubTopic 10
-Name Accounting Standards Codification
-Section 50
-Paragraph 4
-Publisher FASB
-URI https://asc.fasb.org/1943274/2147483443/250-10-50-4
Reference 15: http://www.xbrl.org/2003/role/disclosureRef
-Topic 260
-SubTopic 10
-Name Accounting Standards Codification
-Section 50
-Paragraph 1
-Subparagraph (a)
-Publisher FASB
-URI https://asc.fasb.org/1943274/2147482662/260-10-50-1
Reference 16: http://www.xbrl.org/2003/role/disclosureRef
-Topic 220
-SubTopic 10
-Name Accounting Standards Codification
-Section S99
-Paragraph 2
-Subparagraph (SX 210.5-03(25))
-Publisher FASB
-URI https://asc.fasb.org/1943274/2147483621/220-10-S99-2
Reference 17: http://www.xbrl.org/2003/role/disclosureRef
-Topic 942
-SubTopic 220
-Name Accounting Standards Codification
-Section S99
-Paragraph 1
-Subparagraph (SX 210.9-04(27))
-Publisher FASB
-URI https://asc.fasb.org/1943274/2147478524/942-220-S99-1
Reference 18: http://www.xbrl.org/2003/role/disclosureRef
-Topic 944
-SubTopic 220
-Name Accounting Standards Codification
-Section S99
-Paragraph 1
-Subparagraph (SX 210.7-04(23))
-Publisher FASB
-URI https://asc.fasb.org/1943274/2147477250/944-220-S99-1
Reference 19: http://www.xbrl.org/2003/role/disclosureRef
-Topic 260
-SubTopic 10
-Name Accounting Standards Codification
-Section 45
-Paragraph 7
-Publisher FASB
-URI https://asc.fasb.org/1943274/2147482689/260-10-45-7
| Name: |
us-gaap_EarningsPerShareDiluted |
| Namespace Prefix: |
us-gaap_ |
| Data Type: |
dtr-types:perShareItemType |
| Balance Type: |
na |
| Period Type: |
duration |
|
| X |
- DefinitionAmount of gain (loss) from the difference between the sale price or salvage price and the book value of an asset that was sold or retired, and gain (loss) from the write down of assets from their carrying value to fair value. Reference 1: http://www.xbrl.org/2009/role/commonPracticeRef
-Topic 230
-SubTopic 10
-Name Accounting Standards Codification
-Section 45
-Paragraph 28
-Subparagraph (b)
-Publisher FASB
-URI https://asc.fasb.org/1943274/2147482740/230-10-45-28
| Name: |
us-gaap_GainLossOnSalesOfAssetsAndAssetImpairmentCharges |
| Namespace Prefix: |
us-gaap_ |
| Data Type: |
xbrli:monetaryItemType |
| Balance Type: |
credit |
| Period Type: |
duration |
|
| X |
- DefinitionThe aggregate total of expenses of managing and administering the affairs of an entity, including affiliates of the reporting entity, which are not directly or indirectly associated with the manufacture, sale or creation of a product or product line. Reference 1: http://fasb.org/us-gaap/role/ref/legacyRef
-Topic 220
-SubTopic 10
-Name Accounting Standards Codification
-Section S99
-Paragraph 2
-Subparagraph (SX 210.5-03(4))
-Publisher FASB
-URI https://asc.fasb.org/1943274/2147483621/220-10-S99-2
Reference 2: http://www.xbrl.org/2003/role/disclosureRef
-Topic 946
-SubTopic 220
-Name Accounting Standards Codification
-Section S99
-Paragraph 1
-Subparagraph (SX 210.6-07(2)(a))
-Publisher FASB
-URI https://asc.fasb.org/1943274/2147479134/946-220-S99-1
| Name: |
us-gaap_GeneralAndAdministrativeExpense |
| Namespace Prefix: |
us-gaap_ |
| Data Type: |
xbrli:monetaryItemType |
| Balance Type: |
debit |
| Period Type: |
duration |
|
| X |
- DefinitionThe portion of profit or loss for the period, net of income taxes, which is attributable to the parent. Reference 1: http://www.xbrl.org/2003/role/disclosureRef
-Topic 250
-SubTopic 10
-Name Accounting Standards Codification
-Section 50
-Paragraph 6
-Publisher FASB
-URI https://asc.fasb.org/1943274/2147483443/250-10-50-6
Reference 2: http://www.xbrl.org/2003/role/disclosureRef
-Topic 250
-SubTopic 10
-Name Accounting Standards Codification
-Section 50
-Paragraph 9
-Publisher FASB
-URI https://asc.fasb.org/1943274/2147483443/250-10-50-9
Reference 3: http://www.xbrl.org/2003/role/disclosureRef
-Topic 805
-SubTopic 60
-Name Accounting Standards Codification
-Section 65
-Paragraph 1
-Subparagraph (g)
-Publisher FASB
-URI https://asc.fasb.org/1943274/2147476176/805-60-65-1
Reference 4: http://www.xbrl.org/2003/role/disclosureRef
-Topic 740
-SubTopic 323
-Name Accounting Standards Codification
-Section 65
-Paragraph 2
-Subparagraph (g)(3)
-Publisher FASB
-URI https://asc.fasb.org/1943274/2147478666/740-323-65-2
Reference 5: http://fasb.org/us-gaap/role/ref/legacyRef
-Topic 220
-SubTopic 10
-Name Accounting Standards Codification
-Section S99
-Paragraph 2
-Subparagraph (SX 210.5-03(20))
-Publisher FASB
-URI https://asc.fasb.org/1943274/2147483621/220-10-S99-2
Reference 6: http://www.xbrl.org/2003/role/disclosureRef
-Topic 235
-SubTopic 10
-Name Accounting Standards Codification
-Section S99
-Paragraph 1
-Subparagraph (SX 210.4-08(g)(1)(ii))
-Publisher FASB
-URI https://asc.fasb.org/1943274/2147480678/235-10-S99-1
Reference 7: http://www.xbrl.org/2003/role/disclosureRef
-Topic 323
-SubTopic 10
-Name Accounting Standards Codification
-Section 50
-Paragraph 3
-Subparagraph (c)
-Publisher FASB
-URI https://asc.fasb.org/1943274/2147481687/323-10-50-3
Reference 8: http://www.xbrl.org/2003/role/disclosureRef
-Topic 825
-SubTopic 10
-Name Accounting Standards Codification
-Section 50
-Paragraph 28
-Subparagraph (f)
-Publisher FASB
-URI https://asc.fasb.org/1943274/2147482907/825-10-50-28
Reference 9: http://www.xbrl.org/2003/role/disclosureRef
-Topic 220
-SubTopic 10
-Name Accounting Standards Codification
-Section 50
-Paragraph 6
-Publisher FASB
-URI https://asc.fasb.org/1943274/2147482765/220-10-50-6
Reference 10: http://www.xbrl.org/2003/role/disclosureRef
-Topic 250
-SubTopic 10
-Name Accounting Standards Codification
-Section 50
-Paragraph 3
-Publisher FASB
-URI https://asc.fasb.org/1943274/2147483443/250-10-50-3
Reference 11: http://www.xbrl.org/2003/role/disclosureRef
-Topic 250
-SubTopic 10
-Name Accounting Standards Codification
-Section 50
-Paragraph 1
-Subparagraph (b)(2)
-Publisher FASB
-URI https://asc.fasb.org/1943274/2147483443/250-10-50-1
Reference 12: http://www.xbrl.org/2003/role/disclosureRef
-Topic 815
-SubTopic 40
-Name Accounting Standards Codification
-Section 65
-Paragraph 1
-Subparagraph (f)
-Publisher FASB
-URI https://asc.fasb.org/1943274/2147480175/815-40-65-1
Reference 13: http://www.xbrl.org/2003/role/disclosureRef
-Topic 250
-SubTopic 10
-Name Accounting Standards Codification
-Section 50
-Paragraph 8
-Publisher FASB
-URI https://asc.fasb.org/1943274/2147483443/250-10-50-8
Reference 14: http://www.xbrl.org/2003/role/disclosureRef
-Topic 250
-SubTopic 10
-Name Accounting Standards Codification
-Section 50
-Paragraph 11
-Subparagraph (a)
-Publisher FASB
-URI https://asc.fasb.org/1943274/2147483443/250-10-50-11
Reference 15: http://www.xbrl.org/2003/role/disclosureRef
-Topic 250
-SubTopic 10
-Name Accounting Standards Codification
-Section 50
-Paragraph 11
-Subparagraph (b)
-Publisher FASB
-URI https://asc.fasb.org/1943274/2147483443/250-10-50-11
Reference 16: http://www.xbrl.org/2003/role/disclosureRef
-Topic 250
-SubTopic 10
-Name Accounting Standards Codification
-Section 50
-Paragraph 4
-Publisher FASB
-URI https://asc.fasb.org/1943274/2147483443/250-10-50-4
Reference 17: http://www.xbrl.org/2003/role/exampleRef
-Topic 946
-SubTopic 830
-Name Accounting Standards Codification
-Section 55
-Paragraph 10
-Publisher FASB
-URI https://asc.fasb.org/1943274/2147479168/946-830-55-10
Reference 18: http://www.xbrl.org/2003/role/disclosureRef
-Topic 946
-SubTopic 220
-Name Accounting Standards Codification
-Section 45
-Paragraph 7
-Publisher FASB
-URI https://asc.fasb.org/1943274/2147479105/946-220-45-7
Reference 19: http://www.xbrl.org/2003/role/disclosureRef
-Topic 944
-SubTopic 220
-Name Accounting Standards Codification
-Section S99
-Paragraph 1
-Subparagraph (SX 210.7-04(18))
-Publisher FASB
-URI https://asc.fasb.org/1943274/2147477250/944-220-S99-1
Reference 20: http://www.xbrl.org/2003/role/disclosureRef
-Topic 946
-SubTopic 220
-Name Accounting Standards Codification
-Section S99
-Paragraph 1
-Subparagraph (SX 210.6-07(9))
-Publisher FASB
-URI https://asc.fasb.org/1943274/2147479134/946-220-S99-1
Reference 21: http://www.xbrl.org/2003/role/disclosureRef
-Topic 946
-SubTopic 220
-Name Accounting Standards Codification
-Section S99
-Paragraph 3
-Subparagraph (SX 210.6-09(1)(d))
-Publisher FASB
-URI https://asc.fasb.org/1943274/2147479134/946-220-S99-3
Reference 22: http://www.xbrl.org/2003/role/disclosureRef
-Topic 470
-SubTopic 10
-Name Accounting Standards Codification
-Section S99
-Paragraph 1A
-Subparagraph (SX 210.13-01(a)(4)(i))
-Publisher FASB
-URI https://asc.fasb.org/1943274/2147480097/470-10-S99-1A
Reference 23: http://www.xbrl.org/2009/role/commonPracticeRef
-Topic 470
-SubTopic 10
-Name Accounting Standards Codification
-Section S99
-Paragraph 1A
-Subparagraph (SX 210.13-01(a)(4)(ii))
-Publisher FASB
-URI https://asc.fasb.org/1943274/2147480097/470-10-S99-1A
Reference 24: http://www.xbrl.org/2003/role/disclosureRef
-Topic 470
-SubTopic 10
-Name Accounting Standards Codification
-Section S99
-Paragraph 1A
-Subparagraph (SX 210.13-01(a)(4)(iii)(A))
-Publisher FASB
-URI https://asc.fasb.org/1943274/2147480097/470-10-S99-1A
Reference 25: http://www.xbrl.org/2003/role/disclosureRef
-Topic 470
-SubTopic 10
-Name Accounting Standards Codification
-Section S99
-Paragraph 1A
-Subparagraph (SX 210.13-01(a)(4)(iv))
-Publisher FASB
-URI https://asc.fasb.org/1943274/2147480097/470-10-S99-1A
Reference 26: http://www.xbrl.org/2003/role/disclosureRef
-Topic 470
-SubTopic 10
-Name Accounting Standards Codification
-Section S99
-Paragraph 1A
-Subparagraph (SX 210.13-01(a)(5))
-Publisher FASB
-URI https://asc.fasb.org/1943274/2147480097/470-10-S99-1A
Reference 27: http://www.xbrl.org/2003/role/disclosureRef
-Topic 470
-SubTopic 10
-Name Accounting Standards Codification
-Section S99
-Paragraph 1B
-Subparagraph (SX 210.13-02(a)(4)(i))
-Publisher FASB
-URI https://asc.fasb.org/1943274/2147480097/470-10-S99-1B
Reference 28: http://www.xbrl.org/2003/role/disclosureRef
-Topic 470
-SubTopic 10
-Name Accounting Standards Codification
-Section S99
-Paragraph 1B
-Subparagraph (SX 210.13-02(a)(4)(iii)(A))
-Publisher FASB
-URI https://asc.fasb.org/1943274/2147480097/470-10-S99-1B
Reference 29: http://www.xbrl.org/2003/role/disclosureRef
-Topic 470
-SubTopic 10
-Name Accounting Standards Codification
-Section S99
-Paragraph 1B
-Subparagraph (SX 210.13-02(a)(4)(iii)(B))
-Publisher FASB
-URI https://asc.fasb.org/1943274/2147480097/470-10-S99-1B
Reference 30: http://www.xbrl.org/2003/role/disclosureRef
-Topic 470
-SubTopic 10
-Name Accounting Standards Codification
-Section S99
-Paragraph 1B
-Subparagraph (SX 210.13-02(a)(4)(iv))
-Publisher FASB
-URI https://asc.fasb.org/1943274/2147480097/470-10-S99-1B
Reference 31: http://www.xbrl.org/2003/role/disclosureRef
-Topic 470
-SubTopic 10
-Name Accounting Standards Codification
-Section S99
-Paragraph 1B
-Subparagraph (SX 210.13-02(a)(5))
-Publisher FASB
-URI https://asc.fasb.org/1943274/2147480097/470-10-S99-1B
Reference 32: http://www.xbrl.org/2003/role/disclosureRef
-Topic 260
-SubTopic 10
-Name Accounting Standards Codification
-Section 45
-Paragraph 60B
-Subparagraph (a)
-Publisher FASB
-URI https://asc.fasb.org/1943274/2147482689/260-10-45-60B
Reference 33: http://www.xbrl.org/2003/role/disclosureRef
-Topic 205
-SubTopic 20
-Name Accounting Standards Codification
-Section 50
-Paragraph 7
-Publisher FASB
-URI https://asc.fasb.org/1943274/2147483499/205-20-50-7
Reference 34: http://fasb.org/us-gaap/role/ref/legacyRef
-Topic 230
-SubTopic 10
-Name Accounting Standards Codification
-Section 45
-Paragraph 28
-Publisher FASB
-URI https://asc.fasb.org/1943274/2147482740/230-10-45-28
Reference 35: http://www.xbrl.org/2003/role/disclosureRef
-Topic 220
-SubTopic 10
-Name Accounting Standards Codification
-Section 45
-Paragraph 1A
-Subparagraph (a)
-Publisher FASB
-URI https://asc.fasb.org/1943274/2147482790/220-10-45-1A
Reference 36: http://www.xbrl.org/2003/role/disclosureRef
-Topic 220
-SubTopic 10
-Name Accounting Standards Codification
-Section 45
-Paragraph 1B
-Subparagraph (a)
-Publisher FASB
-URI https://asc.fasb.org/1943274/2147482790/220-10-45-1B
Reference 37: http://fasb.org/us-gaap/role/ref/legacyRef
-Topic 942
-SubTopic 220
-Name Accounting Standards Codification
-Section S99
-Paragraph 1
-Subparagraph (SX 210.9-04(22))
-Publisher FASB
-URI https://asc.fasb.org/1943274/2147478524/942-220-S99-1
| Name: |
us-gaap_NetIncomeLoss |
| Namespace Prefix: |
us-gaap_ |
| Data Type: |
xbrli:monetaryItemType |
| Balance Type: |
credit |
| Period Type: |
duration |
|
| X |
- DefinitionAmount of net occupancy expense that may include items, such as depreciation of facilities and equipment, lease expenses, property taxes and property and casualty insurance expense. Reference 1: http://fasb.org/us-gaap/role/ref/legacyRef
-Topic 220
-SubTopic 10
-Name Accounting Standards Codification
-Section S99
-Paragraph 2
-Subparagraph (SX 210.5-03(6))
-Publisher FASB
-URI https://asc.fasb.org/1943274/2147483621/220-10-S99-2
Reference 2: http://fasb.org/us-gaap/role/ref/legacyRef
-Topic 942
-SubTopic 220
-Name Accounting Standards Codification
-Section S99
-Paragraph 1
-Subparagraph (SX 210.9-04(14)(b))
-Publisher FASB
-URI https://asc.fasb.org/1943274/2147478524/942-220-S99-1
Reference 3: http://fasb.org/us-gaap/role/ref/otherTransitionRef
-Topic 840
-SubTopic 30
-Name Accounting Standards Codification
-Section 50
-Paragraph 1
-Publisher FASB
-URI https://asc.fasb.org/1943274/2147481161/840-30-50-1
| Name: |
us-gaap_OccupancyNet |
| Namespace Prefix: |
us-gaap_ |
| Data Type: |
xbrli:monetaryItemType |
| Balance Type: |
debit |
| Period Type: |
duration |
|
| X |
- References
+ Details
| Name: |
us-gaap_OperatingCostsAndExpensesAbstract |
| Namespace Prefix: |
us-gaap_ |
| Data Type: |
xbrli:stringItemType |
| Balance Type: |
na |
| Period Type: |
duration |
|
| X |
- DefinitionThe net result for the period of deducting operating expenses from operating revenues. Reference 1: http://www.xbrl.org/2009/role/commonPracticeRef
-Topic 280
-SubTopic 10
-Name Accounting Standards Codification
-Section 50
-Paragraph 22
-Publisher FASB
-URI https://asc.fasb.org/1943274/2147482810/280-10-50-22
Reference 2: http://www.xbrl.org/2009/role/commonPracticeRef
-Topic 280
-SubTopic 10
-Name Accounting Standards Codification
-Section 50
-Paragraph 32
-Subparagraph (f)
-Publisher FASB
-URI https://asc.fasb.org/1943274/2147482810/280-10-50-32
Reference 3: http://www.xbrl.org/2009/role/commonPracticeRef
-Topic 280
-SubTopic 10
-Name Accounting Standards Codification
-Section 50
-Paragraph 30
-Subparagraph (b)
-Publisher FASB
-URI https://asc.fasb.org/1943274/2147482810/280-10-50-30
Reference 4: http://www.xbrl.org/2009/role/commonPracticeRef
-Topic 270
-SubTopic 10
-Name Accounting Standards Codification
-Section 50
-Paragraph 1
-Subparagraph (i)
-Publisher FASB
-URI https://asc.fasb.org/1943274/2147482964/270-10-50-1
Reference 5: http://www.xbrl.org/2009/role/commonPracticeRef
-Topic 280
-SubTopic 10
-Name Accounting Standards Codification
-Section 50
-Paragraph 32
-Subparagraph (ee)
-Publisher FASB
-URI https://asc.fasb.org/1943274/2147482810/280-10-50-32
Reference 6: http://fasb.org/us-gaap/role/ref/otherTransitionRef
-Topic 280
-SubTopic 10
-Name Accounting Standards Codification
-Section 50
-Paragraph 32
-Subparagraph (c)
-Publisher FASB
-URI https://asc.fasb.org/1943274/2147482810/280-10-50-32
Reference 7: http://www.xbrl.org/2003/role/exampleRef
-Topic 280
-SubTopic 10
-Name Accounting Standards Codification
-Section 50
-Paragraph 31
-Publisher FASB
-URI https://asc.fasb.org/1943274/2147482810/280-10-50-31
| Name: |
us-gaap_OperatingIncomeLoss |
| Namespace Prefix: |
us-gaap_ |
| Data Type: |
xbrli:monetaryItemType |
| Balance Type: |
credit |
| Period Type: |
duration |
|
| X |
- DefinitionAmount after tax and reclassification adjustments of gain (loss) on foreign currency translation adjustments, foreign currency transactions designated and effective as economic hedges of a net investment in a foreign entity and intra-entity foreign currency transactions that are of a long-term-investment nature, attributable to parent entity. Reference 1: http://fasb.org/us-gaap/role/ref/legacyRef
-Topic 810
-SubTopic 10
-Name Accounting Standards Codification
-Section 45
-Paragraph 19
-Publisher FASB
-URI https://asc.fasb.org/1943274/2147481231/810-10-45-19
Reference 2: http://fasb.org/us-gaap/role/ref/legacyRef
-Name Accounting Standards Codification
-Section 45
-Paragraph 20
-SubTopic 10
-Topic 810
-Publisher FASB
-URI https://asc.fasb.org/1943274/2147481231/810-10-45-20
Reference 3: http://fasb.org/us-gaap/role/ref/legacyRef
-Name Accounting Standards Codification
-Section 50
-Paragraph 1A
-Subparagraph (c)(3)
-SubTopic 10
-Topic 810
-Publisher FASB
-URI https://asc.fasb.org/1943274/2147481203/810-10-50-1A
| Name: |
us-gaap_OtherComprehensiveIncomeForeignCurrencyTransactionAndTranslationAdjustmentNetOfTaxPortionAttributableToParent |
| Namespace Prefix: |
us-gaap_ |
| Data Type: |
xbrli:monetaryItemType |
| Balance Type: |
credit |
| Period Type: |
duration |
|
| X |
- References
+ Details
| Name: |
us-gaap_OtherComprehensiveIncomeLossNetOfTaxPortionAttributableToParentAbstract |
| Namespace Prefix: |
us-gaap_ |
| Data Type: |
xbrli:stringItemType |
| Balance Type: |
na |
| Period Type: |
duration |
|
| X |
- DefinitionThe total amount of other operating cost and expense items that are associated with the entity's normal revenue producing operation. Reference 1: http://www.xbrl.org/2003/role/exampleRef
-Topic 280
-SubTopic 10
-Name Accounting Standards Codification
-Section 55
-Paragraph 48
-Publisher FASB
-URI https://asc.fasb.org/1943274/2147482785/280-10-55-48
Reference 2: http://fasb.org/us-gaap/role/ref/legacyRef
-Topic 220
-SubTopic 10
-Name Accounting Standards Codification
-Section S99
-Paragraph 2
-Subparagraph (SX 210.5-03(3))
-Publisher FASB
-URI https://asc.fasb.org/1943274/2147483621/220-10-S99-2
Reference 3: http://www.xbrl.org/2003/role/disclosureRef
-Topic 944
-SubTopic 220
-Name Accounting Standards Codification
-Section S99
-Paragraph 1
-Subparagraph (SX 210.7-04(7)(b))
-Publisher FASB
-URI https://asc.fasb.org/1943274/2147477250/944-220-S99-1
| Name: |
us-gaap_OtherCostAndExpenseOperating |
| Namespace Prefix: |
us-gaap_ |
| Data Type: |
xbrli:monetaryItemType |
| Balance Type: |
debit |
| Period Type: |
duration |
|
| X |
- DefinitionAmount of income (expense) related to nonoperating activities, classified as other. Reference 1: http://fasb.org/us-gaap/role/ref/legacyRef
-Topic 220
-SubTopic 10
-Name Accounting Standards Codification
-Section S99
-Paragraph 2
-Subparagraph (SX 210.5-03(9))
-Publisher FASB
-URI https://asc.fasb.org/1943274/2147483621/220-10-S99-2
| Name: |
us-gaap_OtherNonoperatingIncomeExpense |
| Namespace Prefix: |
us-gaap_ |
| Data Type: |
xbrli:monetaryItemType |
| Balance Type: |
credit |
| Period Type: |
duration |
|
| X |
- DefinitionExpenditures associated with opening new locations which are noncapital in nature and expensed as incurred. Reference 1: http://fasb.org/us-gaap/role/ref/legacyRef
-Topic 220
-SubTopic 10
-Name Accounting Standards Codification
-Section S99
-Paragraph 2
-Subparagraph (SX 210.5-03(3))
-Publisher FASB
-URI https://asc.fasb.org/1943274/2147483621/220-10-S99-2
| Name: |
us-gaap_PreOpeningCosts |
| Namespace Prefix: |
us-gaap_ |
| Data Type: |
xbrli:monetaryItemType |
| Balance Type: |
debit |
| Period Type: |
duration |
|
| X |
- DefinitionAmount of revenue recognized from goods sold, services rendered, insurance premiums, or other activities that constitute an earning process. Includes, but is not limited to, investment and interest income before deduction of interest expense when recognized as a component of revenue, and sales and trading gain (loss). Reference 1: http://www.xbrl.org/2003/role/exampleRef
-Topic 280
-SubTopic 10
-Name Accounting Standards Codification
-Section 55
-Paragraph 48
-Publisher FASB
-URI https://asc.fasb.org/1943274/2147482785/280-10-55-48
Reference 2: http://www.xbrl.org/2003/role/disclosureRef
-Topic 280
-SubTopic 10
-Name Accounting Standards Codification
-Section 50
-Paragraph 41
-Subparagraph (a)
-Publisher FASB
-URI https://asc.fasb.org/1943274/2147482810/280-10-50-41
Reference 3: http://www.xbrl.org/2003/role/disclosureRef
-Topic 270
-SubTopic 10
-Name Accounting Standards Codification
-Section 50
-Paragraph 1
-Subparagraph (i)
-Publisher FASB
-URI https://asc.fasb.org/1943274/2147482964/270-10-50-1
Reference 4: http://www.xbrl.org/2003/role/disclosureRef
-Topic 280
-SubTopic 10
-Name Accounting Standards Codification
-Section 50
-Paragraph 32
-Subparagraph (ee)
-Publisher FASB
-URI https://asc.fasb.org/1943274/2147482810/280-10-50-32
Reference 5: http://fasb.org/us-gaap/role/ref/otherTransitionRef
-Topic 280
-SubTopic 10
-Name Accounting Standards Codification
-Section 50
-Paragraph 32
-Subparagraph (b)
-Publisher FASB
-URI https://asc.fasb.org/1943274/2147482810/280-10-50-32
Reference 6: http://fasb.org/us-gaap/role/ref/otherTransitionRef
-Topic 280
-SubTopic 10
-Name Accounting Standards Codification
-Section 50
-Paragraph 32
-Subparagraph (a)
-Publisher FASB
-URI https://asc.fasb.org/1943274/2147482810/280-10-50-32
Reference 7: http://www.xbrl.org/2003/role/disclosureRef
-Topic 235
-SubTopic 10
-Name Accounting Standards Codification
-Section S99
-Paragraph 1
-Subparagraph (SX 210.4-08(g)(1)(ii))
-Publisher FASB
-URI https://asc.fasb.org/1943274/2147480678/235-10-S99-1
Reference 8: http://www.xbrl.org/2003/role/disclosureRef
-Topic 323
-SubTopic 10
-Name Accounting Standards Codification
-Section 50
-Paragraph 3
-Subparagraph (c)
-Publisher FASB
-URI https://asc.fasb.org/1943274/2147481687/323-10-50-3
Reference 9: http://www.xbrl.org/2003/role/disclosureRef
-Topic 825
-SubTopic 10
-Name Accounting Standards Codification
-Section 50
-Paragraph 28
-Subparagraph (f)
-Publisher FASB
-URI https://asc.fasb.org/1943274/2147482907/825-10-50-28
Reference 10: http://www.xbrl.org/2003/role/disclosureRef
-Topic 470
-SubTopic 10
-Name Accounting Standards Codification
-Section S99
-Paragraph 1A
-Subparagraph (SX 210.13-01(a)(4)(i))
-Publisher FASB
-URI https://asc.fasb.org/1943274/2147480097/470-10-S99-1A
Reference 11: http://www.xbrl.org/2009/role/commonPracticeRef
-Topic 470
-SubTopic 10
-Name Accounting Standards Codification
-Section S99
-Paragraph 1A
-Subparagraph (SX 210.13-01(a)(4)(ii))
-Publisher FASB
-URI https://asc.fasb.org/1943274/2147480097/470-10-S99-1A
Reference 12: http://www.xbrl.org/2003/role/disclosureRef
-Topic 470
-SubTopic 10
-Name Accounting Standards Codification
-Section S99
-Paragraph 1A
-Subparagraph (SX 210.13-01(a)(4)(iii)(A))
-Publisher FASB
-URI https://asc.fasb.org/1943274/2147480097/470-10-S99-1A
Reference 13: http://www.xbrl.org/2003/role/disclosureRef
-Topic 470
-SubTopic 10
-Name Accounting Standards Codification
-Section S99
-Paragraph 1A
-Subparagraph (SX 210.13-01(a)(4)(iv))
-Publisher FASB
-URI https://asc.fasb.org/1943274/2147480097/470-10-S99-1A
Reference 14: http://www.xbrl.org/2003/role/disclosureRef
-Topic 470
-SubTopic 10
-Name Accounting Standards Codification
-Section S99
-Paragraph 1A
-Subparagraph (SX 210.13-01(a)(5))
-Publisher FASB
-URI https://asc.fasb.org/1943274/2147480097/470-10-S99-1A
Reference 15: http://www.xbrl.org/2003/role/disclosureRef
-Topic 470
-SubTopic 10
-Name Accounting Standards Codification
-Section S99
-Paragraph 1B
-Subparagraph (SX 210.13-02(a)(4)(i))
-Publisher FASB
-URI https://asc.fasb.org/1943274/2147480097/470-10-S99-1B
Reference 16: http://www.xbrl.org/2003/role/disclosureRef
-Topic 470
-SubTopic 10
-Name Accounting Standards Codification
-Section S99
-Paragraph 1B
-Subparagraph (SX 210.13-02(a)(4)(iii)(A))
-Publisher FASB
-URI https://asc.fasb.org/1943274/2147480097/470-10-S99-1B
Reference 17: http://www.xbrl.org/2003/role/disclosureRef
-Topic 470
-SubTopic 10
-Name Accounting Standards Codification
-Section S99
-Paragraph 1B
-Subparagraph (SX 210.13-02(a)(4)(iii)(B))
-Publisher FASB
-URI https://asc.fasb.org/1943274/2147480097/470-10-S99-1B
Reference 18: http://www.xbrl.org/2003/role/disclosureRef
-Topic 470
-SubTopic 10
-Name Accounting Standards Codification
-Section S99
-Paragraph 1B
-Subparagraph (SX 210.13-02(a)(4)(iv))
-Publisher FASB
-URI https://asc.fasb.org/1943274/2147480097/470-10-S99-1B
Reference 19: http://www.xbrl.org/2003/role/disclosureRef
-Topic 470
-SubTopic 10
-Name Accounting Standards Codification
-Section S99
-Paragraph 1B
-Subparagraph (SX 210.13-02(a)(5))
-Publisher FASB
-URI https://asc.fasb.org/1943274/2147480097/470-10-S99-1B
Reference 20: http://www.xbrl.org/2003/role/disclosureRef
-Topic 280
-SubTopic 10
-Name Accounting Standards Codification
-Section 50
-Paragraph 30
-Subparagraph (a)
-Publisher FASB
-URI https://asc.fasb.org/1943274/2147482810/280-10-50-30
Reference 21: http://www.xbrl.org/2003/role/disclosureRef
-Topic 280
-SubTopic 10
-Name Accounting Standards Codification
-Section 50
-Paragraph 42
-Publisher FASB
-URI https://asc.fasb.org/1943274/2147482810/280-10-50-42
Reference 22: http://www.xbrl.org/2003/role/disclosureRef
-Topic 280
-SubTopic 10
-Name Accounting Standards Codification
-Section 50
-Paragraph 22
-Subparagraph (b)
-Publisher FASB
-URI https://asc.fasb.org/1943274/2147482810/280-10-50-22
Reference 23: http://www.xbrl.org/2003/role/disclosureRef
-Topic 280
-SubTopic 10
-Name Accounting Standards Codification
-Section 50
-Paragraph 40
-Publisher FASB
-URI https://asc.fasb.org/1943274/2147482810/280-10-50-40
Reference 24: http://www.xbrl.org/2003/role/disclosureRef
-Topic 280
-SubTopic 10
-Name Accounting Standards Codification
-Section 50
-Paragraph 22
-Subparagraph (a)
-Publisher FASB
-URI https://asc.fasb.org/1943274/2147482810/280-10-50-22
Reference 25: http://www.xbrl.org/2003/role/disclosureRef
-Topic 942
-SubTopic 235
-Name Accounting Standards Codification
-Section S99
-Paragraph 1
-Subparagraph (SX 210.9-05(b)(2))
-Publisher FASB
-URI https://asc.fasb.org/1943274/2147477314/942-235-S99-1
Reference 26: http://www.xbrl.org/2003/role/disclosureRef
-Topic 220
-SubTopic 10
-Name Accounting Standards Codification
-Section S99
-Paragraph 2
-Subparagraph (SX 210.5-03(1))
-Publisher FASB
-URI https://asc.fasb.org/1943274/2147483621/220-10-S99-2
| Name: |
us-gaap_Revenues |
| Namespace Prefix: |
us-gaap_ |
| Data Type: |
xbrli:monetaryItemType |
| Balance Type: |
credit |
| Period Type: |
duration |
|
| X |
- DefinitionThe average number of shares or units issued and outstanding that are used in calculating diluted EPS or earnings per unit (EPU), determined based on the timing of issuance of shares or units in the period. Reference 1: http://www.xbrl.org/2003/role/disclosureRef
-Topic 260
-SubTopic 10
-Name Accounting Standards Codification
-Section 50
-Paragraph 1
-Subparagraph (a)
-Publisher FASB
-URI https://asc.fasb.org/1943274/2147482662/260-10-50-1
Reference 2: http://www.xbrl.org/2003/role/disclosureRef
-Topic 260
-SubTopic 10
-Name Accounting Standards Codification
-Section 45
-Paragraph 16
-Publisher FASB
-URI https://asc.fasb.org/1943274/2147482689/260-10-45-16
| Name: |
us-gaap_WeightedAverageNumberOfDilutedSharesOutstanding |
| Namespace Prefix: |
us-gaap_ |
| Data Type: |
xbrli:sharesItemType |
| Balance Type: |
na |
| Period Type: |
duration |
|
| X |
- DefinitionNumber of [basic] shares or units, after adjustment for contingently issuable shares or units and other shares or units not deemed outstanding, determined by relating the portion of time within a reporting period that common shares or units have been outstanding to the total time in that period. Reference 1: http://www.xbrl.org/2003/role/disclosureRef
-Topic 260
-SubTopic 10
-Name Accounting Standards Codification
-Section 50
-Paragraph 1
-Subparagraph (a)
-Publisher FASB
-URI https://asc.fasb.org/1943274/2147482662/260-10-50-1
Reference 2: http://www.xbrl.org/2003/role/disclosureRef
-Topic 260
-SubTopic 10
-Name Accounting Standards Codification
-Section 45
-Paragraph 10
-Publisher FASB
-URI https://asc.fasb.org/1943274/2147482689/260-10-45-10
| Name: |
us-gaap_WeightedAverageNumberOfSharesOutstandingBasic |
| Namespace Prefix: |
us-gaap_ |
| Data Type: |
xbrli:sharesItemType |
| Balance Type: |
na |
| Period Type: |
duration |
|
| X |
- Details
| Name: |
srt_ProductOrServiceAxis=us-gaap_FoodAndBeverageMember |
| Namespace Prefix: |
|
| Data Type: |
na |
| Balance Type: |
|
| Period Type: |
|
|
| X |
- Details
| Name: |
srt_ProductOrServiceAxis=cmg_DeliveryServiceMember |
| Namespace Prefix: |
|
| Data Type: |
na |
| Balance Type: |
|
| Period Type: |
|
|
v3.25.0.1
CONSOLIDATED STATEMENTS OF SHAREHOLDERS’ EQUITY - USD ($)
shares in Thousands, $ in Thousands |
Total |
Common Stock |
Additional Paid-In Capital |
Treasury Stock |
Retained Earnings |
Accumulated Other Comprehensive Loss |
| Increase (Decrease) in Stockholders' Equity [Roll Forward] |
|
|
|
|
|
|
| Ending balance (in shares) |
|
|
|
452,622
|
|
|
| Beginning balance (in shares) at Dec. 31, 2021 |
|
1,856,597
|
|
|
|
|
| Beginning balance at Dec. 31, 2021 |
$ 2,297,374
|
$ 18,566
|
$ 1,711,117
|
$ (3,356,102)
|
$ 3,929,147
|
$ (5,354)
|
| Beginning balance (in shares) at Dec. 31, 2021 |
|
|
|
452,622
|
|
|
| Increase (Decrease) in Stockholders' Equity [Roll Forward] |
|
|
|
|
|
|
| Stock-based compensation |
99,821
|
|
99,821
|
|
|
|
| Stock plan transactions and other (in shares) |
|
9,395
|
|
|
|
|
| Stock plan transactions and other |
173
|
$ 94
|
79
|
|
|
|
| Repurchase of common stock (in shares) |
|
|
|
32,029
|
|
|
| Repurchase of common stock |
(925,912)
|
|
|
$ (925,912)
|
|
|
| Net income |
899,101
|
|
|
|
899,101
|
|
| Other comprehensive income/(loss), net of income taxes |
(2,534)
|
|
|
|
|
(2,534)
|
| Ending balance (in shares) at Dec. 31, 2022 |
|
1,865,992
|
|
|
|
|
| Ending balance at Dec. 31, 2022 |
2,368,023
|
$ 18,660
|
1,811,017
|
$ (4,282,014)
|
4,828,248
|
(7,888)
|
| Increase (Decrease) in Stockholders' Equity [Roll Forward] |
|
|
|
|
|
|
| Ending balance (in shares) |
|
|
|
484,651
|
|
|
| Beginning balance (in shares) at Dec. 31, 2022 |
|
|
|
484,651
|
|
|
| Increase (Decrease) in Stockholders' Equity [Roll Forward] |
|
|
|
|
|
|
| Stock-based compensation |
126,686
|
|
126,686
|
|
|
|
| Stock plan transactions and other (in shares) |
|
8,147
|
|
|
|
|
| Stock plan transactions and other |
172
|
$ 81
|
91
|
|
|
|
| Repurchase of common stock (in shares) |
|
|
|
18,192
|
|
|
| Repurchase of common stock |
(662,642)
|
|
|
$ (662,642)
|
|
|
| Net income |
1,228,737
|
|
|
|
1,228,737
|
|
| Other comprehensive income/(loss), net of income taxes |
1,231
|
|
|
|
|
1,231
|
| Ending balance (in shares) at Dec. 31, 2023 |
|
1,874,139
|
|
|
|
|
| Ending balance at Dec. 31, 2023 |
$ 3,062,207
|
$ 18,741
|
1,937,794
|
$ (4,944,656)
|
6,056,985
|
(6,657)
|
| Increase (Decrease) in Stockholders' Equity [Roll Forward] |
|
|
|
|
|
|
| Ending balance (in shares) |
502,843
|
|
|
502,843
|
|
|
| Beginning balance (in shares) at Dec. 31, 2023 |
502,843
|
|
|
502,843
|
|
|
| Increase (Decrease) in Stockholders' Equity [Roll Forward] |
|
|
|
|
|
|
| Stock-based compensation |
$ 134,635
|
|
134,635
|
|
|
|
| Stock plan transactions and other (in shares) |
|
6,284
|
|
|
|
|
| Stock plan transactions and other |
5,643
|
$ 62
|
5,581
|
|
|
|
| Repurchase of common stock (in shares) |
|
14,506
|
|
4,323
|
|
|
| Repurchase of common stock |
(1,077,424)
|
$ (145)
|
|
$ (249,540)
|
(827,739)
|
|
| Retirement of treasury stock (in shares) |
|
(507,166)
|
|
(507,166)
|
|
|
| Retirement of treasury stock |
0
|
$ (5,072)
|
|
$ 5,194,196
|
(5,189,124)
|
|
| Net income |
1,534,110
|
|
|
|
1,534,110
|
|
| Other comprehensive income/(loss), net of income taxes |
(3,625)
|
|
|
|
|
(3,625)
|
| Ending balance (in shares) at Dec. 31, 2024 |
|
1,358,751
|
|
|
|
|
| Ending balance at Dec. 31, 2024 |
$ 3,655,546
|
$ 13,586
|
$ 2,078,010
|
$ 0
|
$ 1,574,232
|
$ (10,282)
|
| Increase (Decrease) in Stockholders' Equity [Roll Forward] |
|
|
|
|
|
|
| Ending balance (in shares) |
0
|
|
|
0
|
|
|
| X |
- DefinitionAmount of increase to additional paid-in capital (APIC) for recognition of cost for award under share-based payment arrangement. Reference 1: http://www.xbrl.org/2003/role/disclosureRef
-Topic 718
-SubTopic 10
-Name Accounting Standards Codification
-Section 35
-Paragraph 2
-Publisher FASB
-URI https://asc.fasb.org/1943274/2147480483/718-10-35-2
Reference 2: http://fasb.org/us-gaap/role/ref/legacyRef
-Name Accounting Standards Codification
-Topic 718
-SubTopic 20
-Section 55
-Paragraph 13
-Publisher FASB
-URI https://asc.fasb.org/1943274/2147481089/718-20-55-13
Reference 3: http://fasb.org/us-gaap/role/ref/legacyRef
-Name Accounting Standards Codification
-Topic 718
-SubTopic 20
-Section 55
-Paragraph 12
-Publisher FASB
-URI https://asc.fasb.org/1943274/2147481089/718-20-55-12
| Name: |
us-gaap_AdjustmentsToAdditionalPaidInCapitalSharebasedCompensationRequisiteServicePeriodRecognitionValue |
| Namespace Prefix: |
us-gaap_ |
| Data Type: |
xbrli:monetaryItemType |
| Balance Type: |
credit |
| Period Type: |
duration |
|
| X |
- DefinitionNumber of shares of common stock outstanding. Common stock represent the ownership interest in a corporation. Reference 1: http://fasb.org/us-gaap/role/ref/legacyRef
-Name Accounting Standards Codification
-Section 50
-Paragraph 2
-SubTopic 10
-Topic 505
-Publisher FASB
-URI https://asc.fasb.org/1943274/2147481112/505-10-50-2
Reference 2: http://fasb.org/us-gaap/role/ref/legacyRef
-Topic 210
-SubTopic 10
-Name Accounting Standards Codification
-Section S99
-Paragraph 1
-Subparagraph (SX 210.5-02(29))
-Publisher FASB
-URI https://asc.fasb.org/1943274/2147480566/210-10-S99-1
Reference 3: http://www.xbrl.org/2003/role/disclosureRef
-Topic 946
-SubTopic 210
-Name Accounting Standards Codification
-Section S99
-Paragraph 2
-Subparagraph (SX 210.6-05(4))
-Publisher FASB
-URI https://asc.fasb.org/1943274/2147479170/946-210-S99-2
Reference 4: http://www.xbrl.org/2009/role/commonPracticeRef
-Topic 946
-SubTopic 220
-Name Accounting Standards Codification
-Section S99
-Paragraph 3
-Subparagraph (SX 210.6-09(4)(b))
-Publisher FASB
-URI https://asc.fasb.org/1943274/2147479134/946-220-S99-3
Reference 5: http://www.xbrl.org/2003/role/disclosureRef
-Topic 946
-SubTopic 210
-Name Accounting Standards Codification
-Section S99
-Paragraph 1
-Subparagraph (SX 210.6-04(16)(a))
-Publisher FASB
-URI https://asc.fasb.org/1943274/2147479170/946-210-S99-1
Reference 6: http://www.xbrl.org/2009/role/commonPracticeRef
-Topic 946
-SubTopic 220
-Name Accounting Standards Codification
-Section S99
-Paragraph 3
-Subparagraph (SX 210.6-09(7))
-Publisher FASB
-URI https://asc.fasb.org/1943274/2147479134/946-220-S99-3
| Name: |
us-gaap_CommonStockSharesOutstanding |
| Namespace Prefix: |
us-gaap_ |
| Data Type: |
xbrli:sharesItemType |
| Balance Type: |
na |
| Period Type: |
instant |
|
| X |
- DefinitionA roll forward is a reconciliation of a concept from the beginning of a period to the end of a period.
| Name: |
us-gaap_IncreaseDecreaseInStockholdersEquityRollForward |
| Namespace Prefix: |
us-gaap_ |
| Data Type: |
xbrli:stringItemType |
| Balance Type: |
na |
| Period Type: |
duration |
|
| X |
- DefinitionThe portion of profit or loss for the period, net of income taxes, which is attributable to the parent. Reference 1: http://www.xbrl.org/2003/role/disclosureRef
-Topic 250
-SubTopic 10
-Name Accounting Standards Codification
-Section 50
-Paragraph 6
-Publisher FASB
-URI https://asc.fasb.org/1943274/2147483443/250-10-50-6
Reference 2: http://www.xbrl.org/2003/role/disclosureRef
-Topic 250
-SubTopic 10
-Name Accounting Standards Codification
-Section 50
-Paragraph 9
-Publisher FASB
-URI https://asc.fasb.org/1943274/2147483443/250-10-50-9
Reference 3: http://www.xbrl.org/2003/role/disclosureRef
-Topic 805
-SubTopic 60
-Name Accounting Standards Codification
-Section 65
-Paragraph 1
-Subparagraph (g)
-Publisher FASB
-URI https://asc.fasb.org/1943274/2147476176/805-60-65-1
Reference 4: http://www.xbrl.org/2003/role/disclosureRef
-Topic 740
-SubTopic 323
-Name Accounting Standards Codification
-Section 65
-Paragraph 2
-Subparagraph (g)(3)
-Publisher FASB
-URI https://asc.fasb.org/1943274/2147478666/740-323-65-2
Reference 5: http://fasb.org/us-gaap/role/ref/legacyRef
-Topic 220
-SubTopic 10
-Name Accounting Standards Codification
-Section S99
-Paragraph 2
-Subparagraph (SX 210.5-03(20))
-Publisher FASB
-URI https://asc.fasb.org/1943274/2147483621/220-10-S99-2
Reference 6: http://www.xbrl.org/2003/role/disclosureRef
-Topic 235
-SubTopic 10
-Name Accounting Standards Codification
-Section S99
-Paragraph 1
-Subparagraph (SX 210.4-08(g)(1)(ii))
-Publisher FASB
-URI https://asc.fasb.org/1943274/2147480678/235-10-S99-1
Reference 7: http://www.xbrl.org/2003/role/disclosureRef
-Topic 323
-SubTopic 10
-Name Accounting Standards Codification
-Section 50
-Paragraph 3
-Subparagraph (c)
-Publisher FASB
-URI https://asc.fasb.org/1943274/2147481687/323-10-50-3
Reference 8: http://www.xbrl.org/2003/role/disclosureRef
-Topic 825
-SubTopic 10
-Name Accounting Standards Codification
-Section 50
-Paragraph 28
-Subparagraph (f)
-Publisher FASB
-URI https://asc.fasb.org/1943274/2147482907/825-10-50-28
Reference 9: http://www.xbrl.org/2003/role/disclosureRef
-Topic 220
-SubTopic 10
-Name Accounting Standards Codification
-Section 50
-Paragraph 6
-Publisher FASB
-URI https://asc.fasb.org/1943274/2147482765/220-10-50-6
Reference 10: http://www.xbrl.org/2003/role/disclosureRef
-Topic 250
-SubTopic 10
-Name Accounting Standards Codification
-Section 50
-Paragraph 3
-Publisher FASB
-URI https://asc.fasb.org/1943274/2147483443/250-10-50-3
Reference 11: http://www.xbrl.org/2003/role/disclosureRef
-Topic 250
-SubTopic 10
-Name Accounting Standards Codification
-Section 50
-Paragraph 1
-Subparagraph (b)(2)
-Publisher FASB
-URI https://asc.fasb.org/1943274/2147483443/250-10-50-1
Reference 12: http://www.xbrl.org/2003/role/disclosureRef
-Topic 815
-SubTopic 40
-Name Accounting Standards Codification
-Section 65
-Paragraph 1
-Subparagraph (f)
-Publisher FASB
-URI https://asc.fasb.org/1943274/2147480175/815-40-65-1
Reference 13: http://www.xbrl.org/2003/role/disclosureRef
-Topic 250
-SubTopic 10
-Name Accounting Standards Codification
-Section 50
-Paragraph 8
-Publisher FASB
-URI https://asc.fasb.org/1943274/2147483443/250-10-50-8
Reference 14: http://www.xbrl.org/2003/role/disclosureRef
-Topic 250
-SubTopic 10
-Name Accounting Standards Codification
-Section 50
-Paragraph 11
-Subparagraph (a)
-Publisher FASB
-URI https://asc.fasb.org/1943274/2147483443/250-10-50-11
Reference 15: http://www.xbrl.org/2003/role/disclosureRef
-Topic 250
-SubTopic 10
-Name Accounting Standards Codification
-Section 50
-Paragraph 11
-Subparagraph (b)
-Publisher FASB
-URI https://asc.fasb.org/1943274/2147483443/250-10-50-11
Reference 16: http://www.xbrl.org/2003/role/disclosureRef
-Topic 250
-SubTopic 10
-Name Accounting Standards Codification
-Section 50
-Paragraph 4
-Publisher FASB
-URI https://asc.fasb.org/1943274/2147483443/250-10-50-4
Reference 17: http://www.xbrl.org/2003/role/exampleRef
-Topic 946
-SubTopic 830
-Name Accounting Standards Codification
-Section 55
-Paragraph 10
-Publisher FASB
-URI https://asc.fasb.org/1943274/2147479168/946-830-55-10
Reference 18: http://www.xbrl.org/2003/role/disclosureRef
-Topic 946
-SubTopic 220
-Name Accounting Standards Codification
-Section 45
-Paragraph 7
-Publisher FASB
-URI https://asc.fasb.org/1943274/2147479105/946-220-45-7
Reference 19: http://www.xbrl.org/2003/role/disclosureRef
-Topic 944
-SubTopic 220
-Name Accounting Standards Codification
-Section S99
-Paragraph 1
-Subparagraph (SX 210.7-04(18))
-Publisher FASB
-URI https://asc.fasb.org/1943274/2147477250/944-220-S99-1
Reference 20: http://www.xbrl.org/2003/role/disclosureRef
-Topic 946
-SubTopic 220
-Name Accounting Standards Codification
-Section S99
-Paragraph 1
-Subparagraph (SX 210.6-07(9))
-Publisher FASB
-URI https://asc.fasb.org/1943274/2147479134/946-220-S99-1
Reference 21: http://www.xbrl.org/2003/role/disclosureRef
-Topic 946
-SubTopic 220
-Name Accounting Standards Codification
-Section S99
-Paragraph 3
-Subparagraph (SX 210.6-09(1)(d))
-Publisher FASB
-URI https://asc.fasb.org/1943274/2147479134/946-220-S99-3
Reference 22: http://www.xbrl.org/2003/role/disclosureRef
-Topic 470
-SubTopic 10
-Name Accounting Standards Codification
-Section S99
-Paragraph 1A
-Subparagraph (SX 210.13-01(a)(4)(i))
-Publisher FASB
-URI https://asc.fasb.org/1943274/2147480097/470-10-S99-1A
Reference 23: http://www.xbrl.org/2009/role/commonPracticeRef
-Topic 470
-SubTopic 10
-Name Accounting Standards Codification
-Section S99
-Paragraph 1A
-Subparagraph (SX 210.13-01(a)(4)(ii))
-Publisher FASB
-URI https://asc.fasb.org/1943274/2147480097/470-10-S99-1A
Reference 24: http://www.xbrl.org/2003/role/disclosureRef
-Topic 470
-SubTopic 10
-Name Accounting Standards Codification
-Section S99
-Paragraph 1A
-Subparagraph (SX 210.13-01(a)(4)(iii)(A))
-Publisher FASB
-URI https://asc.fasb.org/1943274/2147480097/470-10-S99-1A
Reference 25: http://www.xbrl.org/2003/role/disclosureRef
-Topic 470
-SubTopic 10
-Name Accounting Standards Codification
-Section S99
-Paragraph 1A
-Subparagraph (SX 210.13-01(a)(4)(iv))
-Publisher FASB
-URI https://asc.fasb.org/1943274/2147480097/470-10-S99-1A
Reference 26: http://www.xbrl.org/2003/role/disclosureRef
-Topic 470
-SubTopic 10
-Name Accounting Standards Codification
-Section S99
-Paragraph 1A
-Subparagraph (SX 210.13-01(a)(5))
-Publisher FASB
-URI https://asc.fasb.org/1943274/2147480097/470-10-S99-1A
Reference 27: http://www.xbrl.org/2003/role/disclosureRef
-Topic 470
-SubTopic 10
-Name Accounting Standards Codification
-Section S99
-Paragraph 1B
-Subparagraph (SX 210.13-02(a)(4)(i))
-Publisher FASB
-URI https://asc.fasb.org/1943274/2147480097/470-10-S99-1B
Reference 28: http://www.xbrl.org/2003/role/disclosureRef
-Topic 470
-SubTopic 10
-Name Accounting Standards Codification
-Section S99
-Paragraph 1B
-Subparagraph (SX 210.13-02(a)(4)(iii)(A))
-Publisher FASB
-URI https://asc.fasb.org/1943274/2147480097/470-10-S99-1B
Reference 29: http://www.xbrl.org/2003/role/disclosureRef
-Topic 470
-SubTopic 10
-Name Accounting Standards Codification
-Section S99
-Paragraph 1B
-Subparagraph (SX 210.13-02(a)(4)(iii)(B))
-Publisher FASB
-URI https://asc.fasb.org/1943274/2147480097/470-10-S99-1B
Reference 30: http://www.xbrl.org/2003/role/disclosureRef
-Topic 470
-SubTopic 10
-Name Accounting Standards Codification
-Section S99
-Paragraph 1B
-Subparagraph (SX 210.13-02(a)(4)(iv))
-Publisher FASB
-URI https://asc.fasb.org/1943274/2147480097/470-10-S99-1B
Reference 31: http://www.xbrl.org/2003/role/disclosureRef
-Topic 470
-SubTopic 10
-Name Accounting Standards Codification
-Section S99
-Paragraph 1B
-Subparagraph (SX 210.13-02(a)(5))
-Publisher FASB
-URI https://asc.fasb.org/1943274/2147480097/470-10-S99-1B
Reference 32: http://www.xbrl.org/2003/role/disclosureRef
-Topic 260
-SubTopic 10
-Name Accounting Standards Codification
-Section 45
-Paragraph 60B
-Subparagraph (a)
-Publisher FASB
-URI https://asc.fasb.org/1943274/2147482689/260-10-45-60B
Reference 33: http://www.xbrl.org/2003/role/disclosureRef
-Topic 205
-SubTopic 20
-Name Accounting Standards Codification
-Section 50
-Paragraph 7
-Publisher FASB
-URI https://asc.fasb.org/1943274/2147483499/205-20-50-7
Reference 34: http://fasb.org/us-gaap/role/ref/legacyRef
-Topic 230
-SubTopic 10
-Name Accounting Standards Codification
-Section 45
-Paragraph 28
-Publisher FASB
-URI https://asc.fasb.org/1943274/2147482740/230-10-45-28
Reference 35: http://www.xbrl.org/2003/role/disclosureRef
-Topic 220
-SubTopic 10
-Name Accounting Standards Codification
-Section 45
-Paragraph 1A
-Subparagraph (a)
-Publisher FASB
-URI https://asc.fasb.org/1943274/2147482790/220-10-45-1A
Reference 36: http://www.xbrl.org/2003/role/disclosureRef
-Topic 220
-SubTopic 10
-Name Accounting Standards Codification
-Section 45
-Paragraph 1B
-Subparagraph (a)
-Publisher FASB
-URI https://asc.fasb.org/1943274/2147482790/220-10-45-1B
Reference 37: http://fasb.org/us-gaap/role/ref/legacyRef
-Topic 942
-SubTopic 220
-Name Accounting Standards Codification
-Section S99
-Paragraph 1
-Subparagraph (SX 210.9-04(22))
-Publisher FASB
-URI https://asc.fasb.org/1943274/2147478524/942-220-S99-1
| Name: |
us-gaap_NetIncomeLoss |
| Namespace Prefix: |
us-gaap_ |
| Data Type: |
xbrli:monetaryItemType |
| Balance Type: |
credit |
| Period Type: |
duration |
|
| X |
- DefinitionAmount after tax of other comprehensive income (loss) attributable to parent entity. Reference 1: http://fasb.org/us-gaap/role/ref/legacyRef
-Topic 810
-SubTopic 10
-Name Accounting Standards Codification
-Section 45
-Paragraph 19
-Publisher FASB
-URI https://asc.fasb.org/1943274/2147481231/810-10-45-19
Reference 2: http://fasb.org/us-gaap/role/ref/legacyRef
-Name Accounting Standards Codification
-Section 45
-Paragraph 20
-SubTopic 10
-Topic 810
-Publisher FASB
-URI https://asc.fasb.org/1943274/2147481231/810-10-45-20
Reference 3: http://fasb.org/us-gaap/role/ref/legacyRef
-Name Accounting Standards Codification
-Section 50
-Paragraph 1A
-Subparagraph (c)(3)
-SubTopic 10
-Topic 810
-Publisher FASB
-URI https://asc.fasb.org/1943274/2147481203/810-10-50-1A
Reference 4: http://www.xbrl.org/2003/role/disclosureRef
-Topic 250
-SubTopic 10
-Name Accounting Standards Codification
-Section 50
-Paragraph 6
-Publisher FASB
-URI https://asc.fasb.org/1943274/2147483443/250-10-50-6
Reference 5: http://www.xbrl.org/2003/role/disclosureRef
-Topic 220
-SubTopic 10
-Name Accounting Standards Codification
-Section 45
-Paragraph 1B
-Subparagraph (b)
-Publisher FASB
-URI https://asc.fasb.org/1943274/2147482790/220-10-45-1B
Reference 6: http://www.xbrl.org/2003/role/disclosureRef
-Topic 220
-SubTopic 10
-Name Accounting Standards Codification
-Section 45
-Paragraph 1A
-Subparagraph (b)
-Publisher FASB
-URI https://asc.fasb.org/1943274/2147482790/220-10-45-1A
| Name: |
us-gaap_OtherComprehensiveIncomeLossNetOfTaxPortionAttributableToParent |
| Namespace Prefix: |
us-gaap_ |
| Data Type: |
xbrli:monetaryItemType |
| Balance Type: |
credit |
| Period Type: |
duration |
|
| X |
- DefinitionNumber of shares of stock issued attributable to transactions classified as other.
| Name: |
us-gaap_StockIssuedDuringPeriodSharesOther |
| Namespace Prefix: |
us-gaap_ |
| Data Type: |
xbrli:sharesItemType |
| Balance Type: |
na |
| Period Type: |
duration |
|
| X |
- DefinitionValue of shares of stock issued attributable to transactions classified as other.
| Name: |
us-gaap_StockIssuedDuringPeriodValueOther |
| Namespace Prefix: |
us-gaap_ |
| Data Type: |
xbrli:monetaryItemType |
| Balance Type: |
credit |
| Period Type: |
duration |
|
| X |
- DefinitionAmount of equity (deficit) attributable to parent. Excludes temporary equity and equity attributable to noncontrolling interest. Reference 1: http://fasb.org/us-gaap/role/ref/legacyRef
-Topic 210
-SubTopic 10
-Name Accounting Standards Codification
-Section S99
-Paragraph 1
-Subparagraph (SX 210.5-02(29))
-Publisher FASB
-URI https://asc.fasb.org/1943274/2147480566/210-10-S99-1
Reference 2: http://fasb.org/us-gaap/role/ref/legacyRef
-Topic 210
-SubTopic 10
-Name Accounting Standards Codification
-Section S99
-Paragraph 1
-Subparagraph (SX 210.5-02(30))
-Publisher FASB
-URI https://asc.fasb.org/1943274/2147480566/210-10-S99-1
Reference 3: http://fasb.org/us-gaap/role/ref/legacyRef
-Topic 210
-SubTopic 10
-Name Accounting Standards Codification
-Section S99
-Paragraph 1
-Subparagraph (SX 210.5-02(31))
-Publisher FASB
-URI https://asc.fasb.org/1943274/2147480566/210-10-S99-1
Reference 4: http://www.xbrl.org/2003/role/exampleRef
-Topic 852
-SubTopic 10
-Name Accounting Standards Codification
-Section 55
-Paragraph 10
-Publisher FASB
-URI https://asc.fasb.org/1943274/2147481372/852-10-55-10
Reference 5: http://www.xbrl.org/2003/role/exampleRef
-Topic 946
-SubTopic 830
-Name Accounting Standards Codification
-Section 55
-Paragraph 12
-Publisher FASB
-URI https://asc.fasb.org/1943274/2147479168/946-830-55-12
Reference 6: http://www.xbrl.org/2003/role/disclosureRef
-Topic 946
-SubTopic 210
-Name Accounting Standards Codification
-Section S99
-Paragraph 1
-Subparagraph (SX 210.6-04(19))
-Publisher FASB
-URI https://asc.fasb.org/1943274/2147479170/946-210-S99-1
Reference 7: http://www.xbrl.org/2003/role/disclosureRef
-Topic 946
-SubTopic 210
-Name Accounting Standards Codification
-Section S99
-Paragraph 2
-Subparagraph (SX 210.6-05(4))
-Publisher FASB
-URI https://asc.fasb.org/1943274/2147479170/946-210-S99-2
Reference 8: http://www.xbrl.org/2009/role/commonPracticeRef
-Topic 946
-SubTopic 220
-Name Accounting Standards Codification
-Section S99
-Paragraph 3
-Subparagraph (SX 210.6-09(4)(b))
-Publisher FASB
-URI https://asc.fasb.org/1943274/2147479134/946-220-S99-3
Reference 9: http://www.xbrl.org/2003/role/disclosureRef
-Topic 946
-SubTopic 220
-Name Accounting Standards Codification
-Section S99
-Paragraph 3
-Subparagraph (SX 210.6-09(6))
-Publisher FASB
-URI https://asc.fasb.org/1943274/2147479134/946-220-S99-3
Reference 10: http://www.xbrl.org/2003/role/disclosureRef
-Topic 946
-SubTopic 220
-Name Accounting Standards Codification
-Section S99
-Paragraph 3
-Subparagraph (SX 210.6-09(7))
-Publisher FASB
-URI https://asc.fasb.org/1943274/2147479134/946-220-S99-3
Reference 11: http://www.xbrl.org/2009/role/commonPracticeRef
-Topic 235
-SubTopic 10
-Name Accounting Standards Codification
-Section S99
-Paragraph 1
-Subparagraph (SX 210.4-08(g)(1)(ii))
-Publisher FASB
-URI https://asc.fasb.org/1943274/2147480678/235-10-S99-1
Reference 12: http://www.xbrl.org/2009/role/commonPracticeRef
-Topic 323
-SubTopic 10
-Name Accounting Standards Codification
-Section 50
-Paragraph 3
-Subparagraph (c)
-Publisher FASB
-URI https://asc.fasb.org/1943274/2147481687/323-10-50-3
Reference 13: http://www.xbrl.org/2009/role/commonPracticeRef
-Topic 825
-SubTopic 10
-Name Accounting Standards Codification
-Section 50
-Paragraph 28
-Subparagraph (f)
-Publisher FASB
-URI https://asc.fasb.org/1943274/2147482907/825-10-50-28
Reference 14: http://fasb.org/us-gaap/role/ref/legacyRef
-Topic 310
-SubTopic 10
-Name Accounting Standards Codification
-Section S99
-Paragraph 2
-Subparagraph (SAB Topic 4.E)
-Publisher FASB
-URI https://asc.fasb.org/1943274/2147480418/310-10-S99-2
| Name: |
us-gaap_StockholdersEquity |
| Namespace Prefix: |
us-gaap_ |
| Data Type: |
xbrli:monetaryItemType |
| Balance Type: |
credit |
| Period Type: |
instant |
|
| X |
- DefinitionNumber of previously issued common shares repurchased by the issuing entity and held in treasury. Reference 1: http://fasb.org/us-gaap/role/ref/legacyRef
-Name Accounting Standards Codification
-Topic 505
-SubTopic 30
-Section 45
-Paragraph 1
-Publisher FASB
-URI https://asc.fasb.org/1943274/2147481549/505-30-45-1
| Name: |
us-gaap_TreasuryStockCommonShares |
| Namespace Prefix: |
us-gaap_ |
| Data Type: |
xbrli:sharesItemType |
| Balance Type: |
na |
| Period Type: |
instant |
|
| X |
- DefinitionAmount of decrease of par value, additional paid in capital (APIC) and retained earnings of common and preferred stock retired from treasury when treasury stock is accounted for under the cost method. Reference 1: http://fasb.org/us-gaap/role/ref/legacyRef
-Name Accounting Standards Codification
-Section 50
-Paragraph 2
-SubTopic 10
-Topic 505
-Publisher FASB
-URI https://asc.fasb.org/1943274/2147481112/505-10-50-2
Reference 2: http://fasb.org/us-gaap/role/ref/legacyRef
-Topic 210
-SubTopic 10
-Name Accounting Standards Codification
-Section S99
-Paragraph 1
-Subparagraph (SX 210.5-02(29))
-Publisher FASB
-URI https://asc.fasb.org/1943274/2147480566/210-10-S99-1
Reference 3: http://fasb.org/us-gaap/role/ref/legacyRef
-Name Accounting Standards Codification
-Topic 505
-SubTopic 10
-Section S99
-Paragraph 1
-Publisher FASB
-URI https://asc.fasb.org/1943274/2147480008/505-10-S99-1
| Name: |
us-gaap_TreasuryStockRetiredCostMethodAmount |
| Namespace Prefix: |
us-gaap_ |
| Data Type: |
xbrli:monetaryItemType |
| Balance Type: |
debit |
| Period Type: |
duration |
|
| X |
- DefinitionNumber of shares that have been repurchased during the period and are being held in treasury. Reference 1: http://fasb.org/us-gaap/role/ref/legacyRef
-Name Accounting Standards Codification
-Section 50
-Paragraph 2
-SubTopic 10
-Topic 505
-Publisher FASB
-URI https://asc.fasb.org/1943274/2147481112/505-10-50-2
Reference 2: http://fasb.org/us-gaap/role/ref/legacyRef
-Topic 210
-SubTopic 10
-Name Accounting Standards Codification
-Section S99
-Paragraph 1
-Subparagraph (SX 210.5-02(29))
-Publisher FASB
-URI https://asc.fasb.org/1943274/2147480566/210-10-S99-1
Reference 3: http://fasb.org/us-gaap/role/ref/legacyRef
-Topic 505
-SubTopic 10
-Name Accounting Standards Codification
-Section S99
-Paragraph 1
-Subparagraph (SX 210.3-04)
-Publisher FASB
-URI https://asc.fasb.org/1943274/2147480008/505-10-S99-1
| Name: |
us-gaap_TreasuryStockSharesAcquired |
| Namespace Prefix: |
us-gaap_ |
| Data Type: |
xbrli:sharesItemType |
| Balance Type: |
na |
| Period Type: |
duration |
|
| X |
- DefinitionNumber of shares of common and preferred stock retired from treasury during the period. Reference 1: http://fasb.org/us-gaap/role/ref/legacyRef
-Name Accounting Standards Codification
-Section 50
-Paragraph 2
-SubTopic 10
-Topic 505
-Publisher FASB
-URI https://asc.fasb.org/1943274/2147481112/505-10-50-2
Reference 2: http://fasb.org/us-gaap/role/ref/legacyRef
-Topic 210
-SubTopic 10
-Name Accounting Standards Codification
-Section S99
-Paragraph 1
-Subparagraph (SX 210.5-02(29))
-Publisher FASB
-URI https://asc.fasb.org/1943274/2147480566/210-10-S99-1
Reference 3: http://fasb.org/us-gaap/role/ref/legacyRef
-Topic 505
-SubTopic 10
-Name Accounting Standards Codification
-Section S99
-Paragraph 1
-Subparagraph (SX 210.3-04)
-Publisher FASB
-URI https://asc.fasb.org/1943274/2147480008/505-10-S99-1
| Name: |
us-gaap_TreasuryStockSharesRetired |
| Namespace Prefix: |
us-gaap_ |
| Data Type: |
xbrli:sharesItemType |
| Balance Type: |
na |
| Period Type: |
duration |
|
| X |
- DefinitionEquity impact of the cost of common and preferred stock that were repurchased during the period. Recorded using the cost method. Reference 1: http://fasb.org/us-gaap/role/ref/legacyRef
-Name Accounting Standards Codification
-Section 50
-Paragraph 2
-SubTopic 10
-Topic 505
-Publisher FASB
-URI https://asc.fasb.org/1943274/2147481112/505-10-50-2
Reference 2: http://fasb.org/us-gaap/role/ref/legacyRef
-Topic 505
-SubTopic 10
-Name Accounting Standards Codification
-Section S99
-Paragraph 1
-Subparagraph (SX 210.3-04)
-Publisher FASB
-URI https://asc.fasb.org/1943274/2147480008/505-10-S99-1
Reference 3: http://fasb.org/us-gaap/role/ref/legacyRef
-Name Accounting Standards Codification
-Topic 505
-SubTopic 30
-Section 45
-Paragraph 1
-Publisher FASB
-URI https://asc.fasb.org/1943274/2147481549/505-30-45-1
| Name: |
us-gaap_TreasuryStockValueAcquiredCostMethod |
| Namespace Prefix: |
us-gaap_ |
| Data Type: |
xbrli:monetaryItemType |
| Balance Type: |
debit |
| Period Type: |
duration |
|
v3.25.0.1
CONSOLIDATED STATEMENTS OF CASH FLOWS - USD ($)
$ in Thousands |
12 Months Ended |
Dec. 31, 2024 |
Dec. 31, 2023 |
Dec. 31, 2022 |
| Operating activities |
|
|
|
| Net income |
$ 1,534,110
|
$ 1,228,737
|
$ 899,101
|
| Adjustments to reconcile net income to net cash provided by operating activities: |
|
|
|
| Depreciation and amortization |
335,030
|
319,394
|
286,826
|
| Deferred income tax provision |
(42,937)
|
(9,505)
|
(43,195)
|
| Impairment, closure costs, and asset disposals |
24,582
|
37,025
|
20,738
|
| Provision for credit losses |
215
|
1,570
|
(760)
|
| Stock-based compensation expense |
131,730
|
124,016
|
98,030
|
| Other |
(3,472)
|
(13,080)
|
(16,202)
|
| Changes in operating assets and liabilities: |
|
|
|
| Accounts receivable |
(29,274)
|
(11,216)
|
(14,026)
|
| Inventory |
(9,797)
|
(3,649)
|
(3,011)
|
| Prepaid expenses and other current assets |
9,244
|
(39,211)
|
(14,660)
|
| Operating lease assets |
285,587
|
254,241
|
234,273
|
| Other assets |
(17,690)
|
4,204
|
(346)
|
| Accounts payable |
8,467
|
5,313
|
18,208
|
| Accrued payroll and benefits |
34,857
|
57,048
|
9,864
|
| Accrued liabilities |
27,284
|
3,188
|
(27,964)
|
| Unearned revenue |
46,139
|
35,685
|
33,374
|
| Income tax payable/receivable |
(14,363)
|
(5,237)
|
46,262
|
| Operating lease liabilities |
(217,894)
|
(214,477)
|
(207,186)
|
| Other long-term liabilities |
3,258
|
9,431
|
3,853
|
| Net cash provided by operating activities |
2,105,076
|
1,783,477
|
1,323,179
|
| Investing activities |
|
|
|
| Purchases of leasehold improvements, property and equipment |
(593,603)
|
(560,731)
|
(479,164)
|
| Purchases of investments |
(986,673)
|
(1,115,131)
|
(614,416)
|
| Maturities of investments |
722,637
|
729,853
|
263,548
|
| Proceeds from sale of equipment |
20,113
|
0
|
0
|
| Net cash used in investing activities |
(837,526)
|
(946,009)
|
(830,032)
|
| Financing activities |
|
|
|
| Repurchase of common stock |
(1,001,559)
|
(592,349)
|
(830,140)
|
| Tax withholding on stock-based compensation awards |
(74,229)
|
(69,146)
|
(98,970)
|
| Other financing activities |
2,089
|
843
|
(294)
|
| Net cash used in financing activities |
(1,073,699)
|
(660,652)
|
(929,404)
|
| Effect of exchange rate changes on cash, cash equivalents and restricted cash |
(1,635)
|
381
|
(1,007)
|
| Net change in cash, cash equivalents, and restricted cash |
192,216
|
177,197
|
(437,264)
|
| Cash, cash equivalents, and restricted cash at beginning of year |
586,163
|
408,966
|
846,230
|
| Cash, cash equivalents, and restricted cash at end of year |
778,379
|
586,163
|
408,966
|
| Supplemental disclosures of cash flow information |
|
|
|
| Income taxes paid |
532,862
|
400,229
|
275,796
|
| Purchases of leasehold improvements, property and equipment accrued in accounts payable and accrued liabilities |
82,636
|
76,415
|
72,021
|
| Repurchase of common stock accrued in accounts payable and accrued liabilities |
$ 7,279
|
$ 5,643
|
$ 4,497
|
| X |
- DefinitionAmount of gain (loss) from the difference between the sale price or salvage price and the book value of an asset that was sold or retired, and gain (loss) from the write down of assets from their carrying value to fair value, including cash and non cash components.
| Name: |
cmg_GainLossOnSaleOfAssetsAssetImpairmentsNonCashComponents |
| Namespace Prefix: |
cmg_ |
| Data Type: |
xbrli:monetaryItemType |
| Balance Type: |
credit |
| Period Type: |
duration |
|
| X |
- DefinitionAmount of increase (decrease) in operating lease assets.
| Name: |
cmg_IncreaseDecreaseInOperatingLeaseAssets |
| Namespace Prefix: |
cmg_ |
| Data Type: |
xbrli:monetaryItemType |
| Balance Type: |
debit |
| Period Type: |
duration |
|
| X |
- DefinitionAcquisition of treasury stock accrued in accounts payable and accrued liabilities.
| Name: |
cmg_RepurchaseOfCommonStockAccruedInAccountsPayableAndAccruedLiabilities |
| Namespace Prefix: |
cmg_ |
| Data Type: |
xbrli:monetaryItemType |
| Balance Type: |
credit |
| Period Type: |
duration |
|
| X |
- References
+ Details
| Name: |
us-gaap_AdjustmentsToReconcileNetIncomeLossToCashProvidedByUsedInOperatingActivitiesAbstract |
| Namespace Prefix: |
us-gaap_ |
| Data Type: |
xbrli:stringItemType |
| Balance Type: |
na |
| Period Type: |
duration |
|
| X |
- DefinitionFuture cash outflow to pay for purchases of fixed assets that have occurred. Reference 1: http://fasb.org/us-gaap/role/ref/legacyRef
-Name Accounting Standards Codification
-Topic 230
-SubTopic 10
-Section 50
-Paragraph 4
-Publisher FASB
-URI https://asc.fasb.org/1943274/2147482913/230-10-50-4
Reference 2: http://fasb.org/us-gaap/role/ref/legacyRef
-Name Accounting Standards Codification
-Topic 230
-SubTopic 10
-Section 50
-Paragraph 3
-Publisher FASB
-URI https://asc.fasb.org/1943274/2147482913/230-10-50-3
Reference 3: http://fasb.org/us-gaap/role/ref/legacyRef
-Name Accounting Standards Codification
-Topic 230
-SubTopic 10
-Section 50
-Paragraph 5
-Publisher FASB
-URI https://asc.fasb.org/1943274/2147482913/230-10-50-5
| Name: |
us-gaap_CapitalExpendituresIncurredButNotYetPaid |
| Namespace Prefix: |
us-gaap_ |
| Data Type: |
xbrli:monetaryItemType |
| Balance Type: |
credit |
| Period Type: |
duration |
|
| X |
- DefinitionAmount of cash and cash equivalents, and cash and cash equivalents restricted to withdrawal or usage. Excludes amount for disposal group and discontinued operations. Cash includes, but is not limited to, currency on hand, demand deposits with banks or financial institutions, and other accounts with general characteristics of demand deposits. Cash equivalents include, but are not limited to, short-term, highly liquid investments that are both readily convertible to known amounts of cash and so near their maturity that they present insignificant risk of changes in value because of changes in interest rates. Reference 1: http://www.xbrl.org/2003/role/disclosureRef
-Topic 230
-SubTopic 10
-Name Accounting Standards Codification
-Section 50
-Paragraph 8
-Publisher FASB
-URI https://asc.fasb.org/1943274/2147482913/230-10-50-8
Reference 2: http://fasb.org/us-gaap/role/ref/legacyRef
-Topic 230
-SubTopic 10
-Name Accounting Standards Codification
-Section 45
-Paragraph 24
-Publisher FASB
-URI https://asc.fasb.org/1943274/2147482740/230-10-45-24
Reference 3: http://fasb.org/us-gaap/role/ref/legacyRef
-Name Accounting Standards Codification
-Topic 230
-SubTopic 10
-Section 45
-Paragraph 4
-Publisher FASB
-URI https://asc.fasb.org/1943274/2147482740/230-10-45-4
| Name: |
us-gaap_CashCashEquivalentsRestrictedCashAndRestrictedCashEquivalents |
| Namespace Prefix: |
us-gaap_ |
| Data Type: |
xbrli:monetaryItemType |
| Balance Type: |
debit |
| Period Type: |
instant |
|
| X |
- DefinitionAmount of increase (decrease) in cash, cash equivalents, and cash and cash equivalents restricted to withdrawal or usage; including effect from exchange rate change. Cash includes, but is not limited to, currency on hand, demand deposits with banks or financial institutions, and other accounts with general characteristics of demand deposits. Cash equivalents include, but are not limited to, short-term, highly liquid investments that are both readily convertible to known amounts of cash and so near their maturity that they present insignificant risk of changes in value because of changes in interest rates. Reference 1: http://fasb.org/us-gaap/role/ref/legacyRef
-Topic 230
-SubTopic 10
-Name Accounting Standards Codification
-Section 45
-Paragraph 24
-Publisher FASB
-URI https://asc.fasb.org/1943274/2147482740/230-10-45-24
Reference 2: http://fasb.org/us-gaap/role/ref/legacyRef
-Name Accounting Standards Codification
-Section 45
-Paragraph 1
-SubTopic 230
-Topic 830
-Publisher FASB
-URI https://asc.fasb.org/1943274/2147477401/830-230-45-1
| Name: |
us-gaap_CashCashEquivalentsRestrictedCashAndRestrictedCashEquivalentsPeriodIncreaseDecreaseIncludingExchangeRateEffect |
| Namespace Prefix: |
us-gaap_ |
| Data Type: |
xbrli:monetaryItemType |
| Balance Type: |
debit |
| Period Type: |
duration |
|
| X |
- DefinitionThe aggregate expense recognized in the current period that allocates the cost of tangible assets, intangible assets, or depleting assets to periods that benefit from use of the assets. Reference 1: http://fasb.org/us-gaap/role/ref/legacyRef
-Name Accounting Standards Codification
-Section 45
-Paragraph 28
-Subparagraph (b)
-SubTopic 10
-Topic 230
-Publisher FASB
-URI https://asc.fasb.org/1943274/2147482740/230-10-45-28
Reference 2: http://www.xbrl.org/2003/role/exampleRef
-Topic 280
-SubTopic 10
-Name Accounting Standards Codification
-Section 55
-Paragraph 48
-Publisher FASB
-URI https://asc.fasb.org/1943274/2147482785/280-10-55-48
Reference 3: http://www.xbrl.org/2003/role/exampleRef
-Topic 280
-SubTopic 10
-Name Accounting Standards Codification
-Section 55
-Paragraph 49
-Publisher FASB
-URI https://asc.fasb.org/1943274/2147482785/280-10-55-49
Reference 4: http://www.xbrl.org/2003/role/disclosureRef
-Topic 270
-SubTopic 10
-Name Accounting Standards Codification
-Section 50
-Paragraph 1
-Subparagraph (i)
-Publisher FASB
-URI https://asc.fasb.org/1943274/2147482964/270-10-50-1
Reference 5: http://www.xbrl.org/2003/role/disclosureRef
-Topic 280
-SubTopic 10
-Name Accounting Standards Codification
-Section 50
-Paragraph 32
-Subparagraph (ee)
-Publisher FASB
-URI https://asc.fasb.org/1943274/2147482810/280-10-50-32
Reference 6: http://www.xbrl.org/2003/role/disclosureRef
-Topic 280
-SubTopic 10
-Name Accounting Standards Codification
-Section 50
-Paragraph 22
-Subparagraph (e)
-Publisher FASB
-URI https://asc.fasb.org/1943274/2147482810/280-10-50-22
| Name: |
us-gaap_DepreciationDepletionAndAmortization |
| Namespace Prefix: |
us-gaap_ |
| Data Type: |
xbrli:monetaryItemType |
| Balance Type: |
debit |
| Period Type: |
duration |
|
| X |
- DefinitionAmount of increase (decrease) from effect of exchange rate changes on cash and cash equivalents, and cash and cash equivalents restricted to withdrawal or usage; held in foreign currencies. Excludes amounts for disposal group and discontinued operations. Cash includes, but is not limited to, currency on hand, demand deposits with banks or financial institutions, and other accounts with general characteristics of demand deposits. Cash equivalents include, but are not limited to, short-term, highly liquid investments that are both readily convertible to known amounts of cash and so near their maturity that they present insignificant risk of changes in value because of changes in interest rates. Reference 1: http://www.xbrl.org/2003/role/disclosureRef
-Topic 830
-SubTopic 230
-Name Accounting Standards Codification
-Section 45
-Paragraph 1
-Publisher FASB
-URI https://asc.fasb.org/1943274/2147477401/830-230-45-1
| Name: |
us-gaap_EffectOfExchangeRateOnCashCashEquivalentsRestrictedCashAndRestrictedCashEquivalents |
| Namespace Prefix: |
us-gaap_ |
| Data Type: |
xbrli:monetaryItemType |
| Balance Type: |
debit |
| Period Type: |
duration |
|
| X |
- DefinitionThe increase (decrease) during the reporting period in the aggregate amount of liabilities incurred (and for which invoices have typically been received) and payable to vendors for goods and services received that are used in an entity's business. Reference 1: http://fasb.org/us-gaap/role/ref/legacyRef
-Name Accounting Standards Codification
-Section 45
-Paragraph 28
-Subparagraph (a)
-SubTopic 10
-Topic 230
-Publisher FASB
-URI https://asc.fasb.org/1943274/2147482740/230-10-45-28
| Name: |
us-gaap_IncreaseDecreaseInAccountsPayable |
| Namespace Prefix: |
us-gaap_ |
| Data Type: |
xbrli:monetaryItemType |
| Balance Type: |
debit |
| Period Type: |
duration |
|
| X |
- DefinitionThe increase (decrease) during the reporting period in amount due within one year (or one business cycle) from customers for the credit sale of goods and services. Reference 1: http://fasb.org/us-gaap/role/ref/legacyRef
-Name Accounting Standards Codification
-Section 45
-Paragraph 28
-Subparagraph (a)
-SubTopic 10
-Topic 230
-Publisher FASB
-URI https://asc.fasb.org/1943274/2147482740/230-10-45-28
| Name: |
us-gaap_IncreaseDecreaseInAccountsReceivable |
| Namespace Prefix: |
us-gaap_ |
| Data Type: |
xbrli:monetaryItemType |
| Balance Type: |
credit |
| Period Type: |
duration |
|
| X |
- DefinitionThe increase (decrease) during the reporting period in the aggregate amount of expenses incurred but not yet paid. Reference 1: http://fasb.org/us-gaap/role/ref/legacyRef
-Name Accounting Standards Codification
-Section 45
-Paragraph 28
-Subparagraph (a)
-SubTopic 10
-Topic 230
-Publisher FASB
-URI https://asc.fasb.org/1943274/2147482740/230-10-45-28
| Name: |
us-gaap_IncreaseDecreaseInAccruedLiabilities |
| Namespace Prefix: |
us-gaap_ |
| Data Type: |
xbrli:monetaryItemType |
| Balance Type: |
debit |
| Period Type: |
duration |
|
| X |
- DefinitionAmount of increase (decrease) in obligation to transfer good or service to customer for which consideration has been received or is receivable. Reference 1: http://www.xbrl.org/2003/role/disclosureRef
-Topic 912
-SubTopic 310
-Name Accounting Standards Codification
-Section 45
-Paragraph 11
-Subparagraph (b)
-Publisher FASB
-URI https://asc.fasb.org/1943274/2147478345/912-310-45-11
Reference 2: http://www.xbrl.org/2009/role/commonPracticeRef
-Topic 230
-SubTopic 10
-Name Accounting Standards Codification
-Section 45
-Paragraph 28
-Subparagraph (a)
-Publisher FASB
-URI https://asc.fasb.org/1943274/2147482740/230-10-45-28
| Name: |
us-gaap_IncreaseDecreaseInContractWithCustomerLiability |
| Namespace Prefix: |
us-gaap_ |
| Data Type: |
xbrli:monetaryItemType |
| Balance Type: |
debit |
| Period Type: |
duration |
|
| X |
- DefinitionThe increase (decrease) during the reporting period in the aggregate value of all inventory held by the reporting entity, associated with underlying transactions that are classified as operating activities. Reference 1: http://fasb.org/us-gaap/role/ref/legacyRef
-Name Accounting Standards Codification
-Section 45
-Paragraph 28
-Subparagraph (a)
-SubTopic 10
-Topic 230
-Publisher FASB
-URI https://asc.fasb.org/1943274/2147482740/230-10-45-28
| Name: |
us-gaap_IncreaseDecreaseInInventories |
| Namespace Prefix: |
us-gaap_ |
| Data Type: |
xbrli:monetaryItemType |
| Balance Type: |
credit |
| Period Type: |
duration |
|
| X |
- DefinitionAmount of increase (decrease) in obligation for operating lease. Reference 1: http://www.xbrl.org/2009/role/commonPracticeRef
-Topic 230
-SubTopic 10
-Name Accounting Standards Codification
-Section 45
-Paragraph 28
-Subparagraph (a)
-Publisher FASB
-URI https://asc.fasb.org/1943274/2147482740/230-10-45-28
Reference 2: http://www.xbrl.org/2009/role/commonPracticeRef
-Name Accounting Standards Codification
-Section 50
-Paragraph 4
-Subparagraph (g)(1)
-SubTopic 20
-Topic 842
-Publisher FASB
-URI https://asc.fasb.org/1943274/2147478964/842-20-50-4
| Name: |
us-gaap_IncreaseDecreaseInOperatingLeaseLiability |
| Namespace Prefix: |
us-gaap_ |
| Data Type: |
xbrli:monetaryItemType |
| Balance Type: |
debit |
| Period Type: |
duration |
|
| X |
- DefinitionAmount of increase (decrease) in operating assets classified as other. Reference 1: http://fasb.org/us-gaap/role/ref/legacyRef
-Name Accounting Standards Codification
-Section 45
-Paragraph 28
-Subparagraph (a)
-SubTopic 10
-Topic 230
-Publisher FASB
-URI https://asc.fasb.org/1943274/2147482740/230-10-45-28
| Name: |
us-gaap_IncreaseDecreaseInOtherOperatingAssets |
| Namespace Prefix: |
us-gaap_ |
| Data Type: |
xbrli:monetaryItemType |
| Balance Type: |
credit |
| Period Type: |
duration |
|
| X |
- DefinitionAmount of increase (decrease) in operating liabilities classified as other. Reference 1: http://fasb.org/us-gaap/role/ref/legacyRef
-Name Accounting Standards Codification
-Section 45
-Paragraph 28
-Subparagraph (a)
-SubTopic 10
-Topic 230
-Publisher FASB
-URI https://asc.fasb.org/1943274/2147482740/230-10-45-28
| Name: |
us-gaap_IncreaseDecreaseInOtherOperatingLiabilities |
| Namespace Prefix: |
us-gaap_ |
| Data Type: |
xbrli:monetaryItemType |
| Balance Type: |
debit |
| Period Type: |
duration |
|
| X |
- DefinitionAmount of increase (decrease) in prepaid expenses, and assets classified as other. Reference 1: http://fasb.org/us-gaap/role/ref/legacyRef
-Name Accounting Standards Codification
-Section 45
-Paragraph 28
-Subparagraph (a)
-SubTopic 10
-Topic 230
-Publisher FASB
-URI https://asc.fasb.org/1943274/2147482740/230-10-45-28
| Name: |
us-gaap_IncreaseDecreaseInPrepaidDeferredExpenseAndOtherAssets |
| Namespace Prefix: |
us-gaap_ |
| Data Type: |
xbrli:monetaryItemType |
| Balance Type: |
credit |
| Period Type: |
duration |
|
| X |
- DefinitionAmount of cash inflow (outflow) from financing activities, including discontinued operations. Financing activity cash flows include obtaining resources from owners and providing them with a return on, and a return of, their investment; borrowing money and repaying amounts borrowed, or settling the obligation; and obtaining and paying for other resources obtained from creditors on long-term credit. Reference 1: http://www.xbrl.org/2003/role/disclosureRef
-Topic 230
-SubTopic 10
-Name Accounting Standards Codification
-Section 45
-Paragraph 24
-Publisher FASB
-URI https://asc.fasb.org/1943274/2147482740/230-10-45-24
| Name: |
us-gaap_NetCashProvidedByUsedInFinancingActivities |
| Namespace Prefix: |
us-gaap_ |
| Data Type: |
xbrli:monetaryItemType |
| Balance Type: |
debit |
| Period Type: |
duration |
|
| X |
- References
+ Details
| Name: |
us-gaap_NetCashProvidedByUsedInFinancingActivitiesAbstract |
| Namespace Prefix: |
us-gaap_ |
| Data Type: |
xbrli:stringItemType |
| Balance Type: |
na |
| Period Type: |
duration |
|
| X |
- DefinitionAmount of cash inflow (outflow) from investing activities, including discontinued operations. Investing activity cash flows include making and collecting loans and acquiring and disposing of debt or equity instruments and property, plant, and equipment and other productive assets. Reference 1: http://www.xbrl.org/2003/role/disclosureRef
-Topic 230
-SubTopic 10
-Name Accounting Standards Codification
-Section 45
-Paragraph 24
-Publisher FASB
-URI https://asc.fasb.org/1943274/2147482740/230-10-45-24
| Name: |
us-gaap_NetCashProvidedByUsedInInvestingActivities |
| Namespace Prefix: |
us-gaap_ |
| Data Type: |
xbrli:monetaryItemType |
| Balance Type: |
debit |
| Period Type: |
duration |
|
| X |
- References
+ Details
| Name: |
us-gaap_NetCashProvidedByUsedInInvestingActivitiesAbstract |
| Namespace Prefix: |
us-gaap_ |
| Data Type: |
xbrli:stringItemType |
| Balance Type: |
na |
| Period Type: |
duration |
|
| X |
- DefinitionAmount of cash inflow (outflow) from operating activities, including discontinued operations. Operating activity cash flows include transactions, adjustments, and changes in value not defined as investing or financing activities. Reference 1: http://fasb.org/us-gaap/role/ref/legacyRef
-Topic 230
-SubTopic 10
-Name Accounting Standards Codification
-Section 45
-Paragraph 28
-Publisher FASB
-URI https://asc.fasb.org/1943274/2147482740/230-10-45-28
Reference 2: http://fasb.org/us-gaap/role/ref/legacyRef
-Topic 230
-SubTopic 10
-Name Accounting Standards Codification
-Section 45
-Paragraph 24
-Publisher FASB
-URI https://asc.fasb.org/1943274/2147482740/230-10-45-24
Reference 3: http://fasb.org/us-gaap/role/ref/legacyRef
-Topic 230
-SubTopic 10
-Name Accounting Standards Codification
-Section 45
-Paragraph 25
-Publisher FASB
-URI https://asc.fasb.org/1943274/2147482740/230-10-45-25
| Name: |
us-gaap_NetCashProvidedByUsedInOperatingActivities |
| Namespace Prefix: |
us-gaap_ |
| Data Type: |
xbrli:monetaryItemType |
| Balance Type: |
na |
| Period Type: |
duration |
|
| X |
- References
+ Details
| Name: |
us-gaap_NetCashProvidedByUsedInOperatingActivitiesAbstract |
| Namespace Prefix: |
us-gaap_ |
| Data Type: |
xbrli:stringItemType |
| Balance Type: |
na |
| Period Type: |
duration |
|
| X |
- References
+ Details
| Name: |
us-gaap_NetCashProvidedByUsedInOperatingActivitiesContinuingOperationsAbstract |
| Namespace Prefix: |
us-gaap_ |
| Data Type: |
xbrli:stringItemType |
| Balance Type: |
na |
| Period Type: |
duration |
|
| X |
- DefinitionThe portion of profit or loss for the period, net of income taxes, which is attributable to the parent. Reference 1: http://www.xbrl.org/2003/role/disclosureRef
-Topic 250
-SubTopic 10
-Name Accounting Standards Codification
-Section 50
-Paragraph 6
-Publisher FASB
-URI https://asc.fasb.org/1943274/2147483443/250-10-50-6
Reference 2: http://www.xbrl.org/2003/role/disclosureRef
-Topic 250
-SubTopic 10
-Name Accounting Standards Codification
-Section 50
-Paragraph 9
-Publisher FASB
-URI https://asc.fasb.org/1943274/2147483443/250-10-50-9
Reference 3: http://www.xbrl.org/2003/role/disclosureRef
-Topic 805
-SubTopic 60
-Name Accounting Standards Codification
-Section 65
-Paragraph 1
-Subparagraph (g)
-Publisher FASB
-URI https://asc.fasb.org/1943274/2147476176/805-60-65-1
Reference 4: http://www.xbrl.org/2003/role/disclosureRef
-Topic 740
-SubTopic 323
-Name Accounting Standards Codification
-Section 65
-Paragraph 2
-Subparagraph (g)(3)
-Publisher FASB
-URI https://asc.fasb.org/1943274/2147478666/740-323-65-2
Reference 5: http://fasb.org/us-gaap/role/ref/legacyRef
-Topic 220
-SubTopic 10
-Name Accounting Standards Codification
-Section S99
-Paragraph 2
-Subparagraph (SX 210.5-03(20))
-Publisher FASB
-URI https://asc.fasb.org/1943274/2147483621/220-10-S99-2
Reference 6: http://www.xbrl.org/2003/role/disclosureRef
-Topic 235
-SubTopic 10
-Name Accounting Standards Codification
-Section S99
-Paragraph 1
-Subparagraph (SX 210.4-08(g)(1)(ii))
-Publisher FASB
-URI https://asc.fasb.org/1943274/2147480678/235-10-S99-1
Reference 7: http://www.xbrl.org/2003/role/disclosureRef
-Topic 323
-SubTopic 10
-Name Accounting Standards Codification
-Section 50
-Paragraph 3
-Subparagraph (c)
-Publisher FASB
-URI https://asc.fasb.org/1943274/2147481687/323-10-50-3
Reference 8: http://www.xbrl.org/2003/role/disclosureRef
-Topic 825
-SubTopic 10
-Name Accounting Standards Codification
-Section 50
-Paragraph 28
-Subparagraph (f)
-Publisher FASB
-URI https://asc.fasb.org/1943274/2147482907/825-10-50-28
Reference 9: http://www.xbrl.org/2003/role/disclosureRef
-Topic 220
-SubTopic 10
-Name Accounting Standards Codification
-Section 50
-Paragraph 6
-Publisher FASB
-URI https://asc.fasb.org/1943274/2147482765/220-10-50-6
Reference 10: http://www.xbrl.org/2003/role/disclosureRef
-Topic 250
-SubTopic 10
-Name Accounting Standards Codification
-Section 50
-Paragraph 3
-Publisher FASB
-URI https://asc.fasb.org/1943274/2147483443/250-10-50-3
Reference 11: http://www.xbrl.org/2003/role/disclosureRef
-Topic 250
-SubTopic 10
-Name Accounting Standards Codification
-Section 50
-Paragraph 1
-Subparagraph (b)(2)
-Publisher FASB
-URI https://asc.fasb.org/1943274/2147483443/250-10-50-1
Reference 12: http://www.xbrl.org/2003/role/disclosureRef
-Topic 815
-SubTopic 40
-Name Accounting Standards Codification
-Section 65
-Paragraph 1
-Subparagraph (f)
-Publisher FASB
-URI https://asc.fasb.org/1943274/2147480175/815-40-65-1
Reference 13: http://www.xbrl.org/2003/role/disclosureRef
-Topic 250
-SubTopic 10
-Name Accounting Standards Codification
-Section 50
-Paragraph 8
-Publisher FASB
-URI https://asc.fasb.org/1943274/2147483443/250-10-50-8
Reference 14: http://www.xbrl.org/2003/role/disclosureRef
-Topic 250
-SubTopic 10
-Name Accounting Standards Codification
-Section 50
-Paragraph 11
-Subparagraph (a)
-Publisher FASB
-URI https://asc.fasb.org/1943274/2147483443/250-10-50-11
Reference 15: http://www.xbrl.org/2003/role/disclosureRef
-Topic 250
-SubTopic 10
-Name Accounting Standards Codification
-Section 50
-Paragraph 11
-Subparagraph (b)
-Publisher FASB
-URI https://asc.fasb.org/1943274/2147483443/250-10-50-11
Reference 16: http://www.xbrl.org/2003/role/disclosureRef
-Topic 250
-SubTopic 10
-Name Accounting Standards Codification
-Section 50
-Paragraph 4
-Publisher FASB
-URI https://asc.fasb.org/1943274/2147483443/250-10-50-4
Reference 17: http://www.xbrl.org/2003/role/exampleRef
-Topic 946
-SubTopic 830
-Name Accounting Standards Codification
-Section 55
-Paragraph 10
-Publisher FASB
-URI https://asc.fasb.org/1943274/2147479168/946-830-55-10
Reference 18: http://www.xbrl.org/2003/role/disclosureRef
-Topic 946
-SubTopic 220
-Name Accounting Standards Codification
-Section 45
-Paragraph 7
-Publisher FASB
-URI https://asc.fasb.org/1943274/2147479105/946-220-45-7
Reference 19: http://www.xbrl.org/2003/role/disclosureRef
-Topic 944
-SubTopic 220
-Name Accounting Standards Codification
-Section S99
-Paragraph 1
-Subparagraph (SX 210.7-04(18))
-Publisher FASB
-URI https://asc.fasb.org/1943274/2147477250/944-220-S99-1
Reference 20: http://www.xbrl.org/2003/role/disclosureRef
-Topic 946
-SubTopic 220
-Name Accounting Standards Codification
-Section S99
-Paragraph 1
-Subparagraph (SX 210.6-07(9))
-Publisher FASB
-URI https://asc.fasb.org/1943274/2147479134/946-220-S99-1
Reference 21: http://www.xbrl.org/2003/role/disclosureRef
-Topic 946
-SubTopic 220
-Name Accounting Standards Codification
-Section S99
-Paragraph 3
-Subparagraph (SX 210.6-09(1)(d))
-Publisher FASB
-URI https://asc.fasb.org/1943274/2147479134/946-220-S99-3
Reference 22: http://www.xbrl.org/2003/role/disclosureRef
-Topic 470
-SubTopic 10
-Name Accounting Standards Codification
-Section S99
-Paragraph 1A
-Subparagraph (SX 210.13-01(a)(4)(i))
-Publisher FASB
-URI https://asc.fasb.org/1943274/2147480097/470-10-S99-1A
Reference 23: http://www.xbrl.org/2009/role/commonPracticeRef
-Topic 470
-SubTopic 10
-Name Accounting Standards Codification
-Section S99
-Paragraph 1A
-Subparagraph (SX 210.13-01(a)(4)(ii))
-Publisher FASB
-URI https://asc.fasb.org/1943274/2147480097/470-10-S99-1A
Reference 24: http://www.xbrl.org/2003/role/disclosureRef
-Topic 470
-SubTopic 10
-Name Accounting Standards Codification
-Section S99
-Paragraph 1A
-Subparagraph (SX 210.13-01(a)(4)(iii)(A))
-Publisher FASB
-URI https://asc.fasb.org/1943274/2147480097/470-10-S99-1A
Reference 25: http://www.xbrl.org/2003/role/disclosureRef
-Topic 470
-SubTopic 10
-Name Accounting Standards Codification
-Section S99
-Paragraph 1A
-Subparagraph (SX 210.13-01(a)(4)(iv))
-Publisher FASB
-URI https://asc.fasb.org/1943274/2147480097/470-10-S99-1A
Reference 26: http://www.xbrl.org/2003/role/disclosureRef
-Topic 470
-SubTopic 10
-Name Accounting Standards Codification
-Section S99
-Paragraph 1A
-Subparagraph (SX 210.13-01(a)(5))
-Publisher FASB
-URI https://asc.fasb.org/1943274/2147480097/470-10-S99-1A
Reference 27: http://www.xbrl.org/2003/role/disclosureRef
-Topic 470
-SubTopic 10
-Name Accounting Standards Codification
-Section S99
-Paragraph 1B
-Subparagraph (SX 210.13-02(a)(4)(i))
-Publisher FASB
-URI https://asc.fasb.org/1943274/2147480097/470-10-S99-1B
Reference 28: http://www.xbrl.org/2003/role/disclosureRef
-Topic 470
-SubTopic 10
-Name Accounting Standards Codification
-Section S99
-Paragraph 1B
-Subparagraph (SX 210.13-02(a)(4)(iii)(A))
-Publisher FASB
-URI https://asc.fasb.org/1943274/2147480097/470-10-S99-1B
Reference 29: http://www.xbrl.org/2003/role/disclosureRef
-Topic 470
-SubTopic 10
-Name Accounting Standards Codification
-Section S99
-Paragraph 1B
-Subparagraph (SX 210.13-02(a)(4)(iii)(B))
-Publisher FASB
-URI https://asc.fasb.org/1943274/2147480097/470-10-S99-1B
Reference 30: http://www.xbrl.org/2003/role/disclosureRef
-Topic 470
-SubTopic 10
-Name Accounting Standards Codification
-Section S99
-Paragraph 1B
-Subparagraph (SX 210.13-02(a)(4)(iv))
-Publisher FASB
-URI https://asc.fasb.org/1943274/2147480097/470-10-S99-1B
Reference 31: http://www.xbrl.org/2003/role/disclosureRef
-Topic 470
-SubTopic 10
-Name Accounting Standards Codification
-Section S99
-Paragraph 1B
-Subparagraph (SX 210.13-02(a)(5))
-Publisher FASB
-URI https://asc.fasb.org/1943274/2147480097/470-10-S99-1B
Reference 32: http://www.xbrl.org/2003/role/disclosureRef
-Topic 260
-SubTopic 10
-Name Accounting Standards Codification
-Section 45
-Paragraph 60B
-Subparagraph (a)
-Publisher FASB
-URI https://asc.fasb.org/1943274/2147482689/260-10-45-60B
Reference 33: http://www.xbrl.org/2003/role/disclosureRef
-Topic 205
-SubTopic 20
-Name Accounting Standards Codification
-Section 50
-Paragraph 7
-Publisher FASB
-URI https://asc.fasb.org/1943274/2147483499/205-20-50-7
Reference 34: http://fasb.org/us-gaap/role/ref/legacyRef
-Topic 230
-SubTopic 10
-Name Accounting Standards Codification
-Section 45
-Paragraph 28
-Publisher FASB
-URI https://asc.fasb.org/1943274/2147482740/230-10-45-28
Reference 35: http://www.xbrl.org/2003/role/disclosureRef
-Topic 220
-SubTopic 10
-Name Accounting Standards Codification
-Section 45
-Paragraph 1A
-Subparagraph (a)
-Publisher FASB
-URI https://asc.fasb.org/1943274/2147482790/220-10-45-1A
Reference 36: http://www.xbrl.org/2003/role/disclosureRef
-Topic 220
-SubTopic 10
-Name Accounting Standards Codification
-Section 45
-Paragraph 1B
-Subparagraph (a)
-Publisher FASB
-URI https://asc.fasb.org/1943274/2147482790/220-10-45-1B
Reference 37: http://fasb.org/us-gaap/role/ref/legacyRef
-Topic 942
-SubTopic 220
-Name Accounting Standards Codification
-Section S99
-Paragraph 1
-Subparagraph (SX 210.9-04(22))
-Publisher FASB
-URI https://asc.fasb.org/1943274/2147478524/942-220-S99-1
| Name: |
us-gaap_NetIncomeLoss |
| Namespace Prefix: |
us-gaap_ |
| Data Type: |
xbrli:monetaryItemType |
| Balance Type: |
credit |
| Period Type: |
duration |
|
| X |
- DefinitionAmount of income (expense) included in net income that results in no cash inflow (outflow), classified as other. Reference 1: http://fasb.org/us-gaap/role/ref/legacyRef
-Topic 230
-SubTopic 10
-Name Accounting Standards Codification
-Section 45
-Paragraph 28
-Publisher FASB
-URI https://asc.fasb.org/1943274/2147482740/230-10-45-28
| Name: |
us-gaap_OtherNoncashIncomeExpense |
| Namespace Prefix: |
us-gaap_ |
| Data Type: |
xbrli:monetaryItemType |
| Balance Type: |
credit |
| Period Type: |
duration |
|
| X |
- DefinitionThe cash outflow to reacquire common stock during the period. Reference 1: http://fasb.org/us-gaap/role/ref/legacyRef
-Topic 230
-SubTopic 10
-Name Accounting Standards Codification
-Section 45
-Paragraph 15
-Subparagraph (a)
-Publisher FASB
-URI https://asc.fasb.org/1943274/2147482740/230-10-45-15
| Name: |
us-gaap_PaymentsForRepurchaseOfCommonStock |
| Namespace Prefix: |
us-gaap_ |
| Data Type: |
xbrli:monetaryItemType |
| Balance Type: |
credit |
| Period Type: |
duration |
|
| X |
- DefinitionThe cash outflow associated with the acquisition of long-lived, physical assets that are used in the normal conduct of business to produce goods and services and not intended for resale; includes cash outflows to pay for construction of self-constructed assets. Reference 1: http://fasb.org/us-gaap/role/ref/legacyRef
-Topic 230
-SubTopic 10
-Name Accounting Standards Codification
-Section 45
-Paragraph 13
-Subparagraph (c)
-Publisher FASB
-URI https://asc.fasb.org/1943274/2147482740/230-10-45-13
| Name: |
us-gaap_PaymentsToAcquirePropertyPlantAndEquipment |
| Namespace Prefix: |
us-gaap_ |
| Data Type: |
xbrli:monetaryItemType |
| Balance Type: |
credit |
| Period Type: |
duration |
|
| X |
- DefinitionAmount of cash inflow (outflow) from financing activities classified as other. Reference 1: http://www.xbrl.org/2009/role/commonPracticeRef
-Topic 230
-SubTopic 10
-Name Accounting Standards Codification
-Section 45
-Paragraph 14
-Publisher FASB
-URI https://asc.fasb.org/1943274/2147482740/230-10-45-14
Reference 2: http://www.xbrl.org/2009/role/commonPracticeRef
-Name Accounting Standards Codification
-Section 45
-Paragraph 15
-SubTopic 10
-Topic 230
-Publisher FASB
-URI https://asc.fasb.org/1943274/2147482740/230-10-45-15
| Name: |
us-gaap_ProceedsFromPaymentsForOtherFinancingActivities |
| Namespace Prefix: |
us-gaap_ |
| Data Type: |
xbrli:monetaryItemType |
| Balance Type: |
debit |
| Period Type: |
duration |
|
| X |
- DefinitionThe cash inflow associated with the aggregate amount received by the entity through sale or maturity of marketable securities (held-to-maturity or available-for-sale) during the period.
| Name: |
us-gaap_ProceedsFromSaleAndMaturityOfMarketableSecurities |
| Namespace Prefix: |
us-gaap_ |
| Data Type: |
xbrli:monetaryItemType |
| Balance Type: |
debit |
| Period Type: |
duration |
|
| X |
- DefinitionThe cash inflow from sale of machinery and equipment. Reference 1: http://fasb.org/us-gaap/role/ref/legacyRef
-Topic 230
-SubTopic 10
-Name Accounting Standards Codification
-Section 45
-Paragraph 12
-Subparagraph (c)
-Publisher FASB
-URI https://asc.fasb.org/1943274/2147482740/230-10-45-12
| Name: |
us-gaap_ProceedsFromSaleOfMachineryAndEquipment |
| Namespace Prefix: |
us-gaap_ |
| Data Type: |
xbrli:monetaryItemType |
| Balance Type: |
debit |
| Period Type: |
duration |
|
| X |
- DefinitionAmount of expense (reversal of expense) for expected credit loss on accounts receivable. Reference 1: http://www.xbrl.org/2003/role/disclosureRef
-Topic 326
-SubTopic 20
-Name Accounting Standards Codification
-Section 50
-Paragraph 13
-Subparagraph (b)
-Publisher FASB
-URI https://asc.fasb.org/1943274/2147479319/326-20-50-13
Reference 2: http://www.xbrl.org/2003/role/disclosureRef
-Topic 220
-SubTopic 10
-Name Accounting Standards Codification
-Section S99
-Paragraph 2
-Subparagraph (SX 210.5-03(5))
-Publisher FASB
-URI https://asc.fasb.org/1943274/2147483621/220-10-S99-2
| Name: |
us-gaap_ProvisionForDoubtfulAccounts |
| Namespace Prefix: |
us-gaap_ |
| Data Type: |
xbrli:monetaryItemType |
| Balance Type: |
debit |
| Period Type: |
duration |
|
| X |
- DefinitionAmount of noncash expense for share-based payment arrangement. Reference 1: http://fasb.org/us-gaap/role/ref/legacyRef
-Name Accounting Standards Codification
-Section 45
-Paragraph 28
-Subparagraph (a)
-SubTopic 10
-Topic 230
-Publisher FASB
-URI https://asc.fasb.org/1943274/2147482740/230-10-45-28
| Name: |
us-gaap_ShareBasedCompensation |
| Namespace Prefix: |
us-gaap_ |
| Data Type: |
xbrli:monetaryItemType |
| Balance Type: |
debit |
| Period Type: |
duration |
|
v3.25.0.1
Description of Business and Summary of Significant Accounting Policies
|
12 Months Ended |
Dec. 31, 2024 |
|---|
| Accounting Policies [Abstract] |
|
| Description of Business and Summary of Significant Accounting Policies |
Description of Business and Summary of Significant Accounting Policies In this annual report on Form 10-K, Chipotle Mexican Grill, Inc., a Delaware corporation, together with its subsidiaries, is collectively referred to as “Chipotle,” “we,” “us,” or “our.” We develop and operate restaurants that serve a relevant menu of burritos, burrito bowls, quesadillas, tacos, and salads, made using fresh, high-quality ingredients. As of December 31, 2024, we operated 3,726 restaurants including 3,644 Chipotle restaurants within the United States, and 82 international Chipotle restaurants. Additionally, we had three international licensed restaurants. We manage our U.S. operations based on ten regions and aggregate our operations to one reportable segment. Additional details on the nature of our business and our reportable operating segment are included in Note 14. "Segment Reporting". On June 26, 2024, we effected a 50-for-1 stock split of our common stock and proportionately increased the number of authorized shares of common stock. All share and per share information, including share-based compensation, throughout this Annual Report on Form 10-K has been retroactively adjusted to reflect the stock split. The shares of common stock retain a par value of $0.01 per share. Accordingly, an amount equal to the par value of the additional shares issued in the stock split was reclassified from capital in excess of par value to common stock. In the second quarter of 2024 we retired all treasury stock owned, which was recognized as a deduction from common stock for the shares' par value and the excess of cost over par as a deduction from retained earnings. All shares of common stock that we repurchase are immediately retired and not held as treasury stock. Principles of Consolidation and Basis of Presentation Our consolidated financial statements include our accounts, our wholly and majority owned subsidiaries and investees we control after elimination of all intercompany accounts and transactions. Management Estimates The preparation of financial statements in conformity with U.S. generally accepted accounting principles requires management to make estimates and assumptions that affect the reported amounts of assets and liabilities and the disclosure of contingent assets and liabilities as of the date of the financial statements, as well as the reported amounts of revenue and expenses during the reporting period. Actual results could differ from those estimates under different assumptions or conditions. Cash and Cash Equivalents We consider highly liquid investment instruments purchased with an initial maturity of three months or less to be cash equivalents. Amounts receivable from credit card companies are also considered cash equivalents as they are both short-term and highly liquid in nature. We maintain cash and cash equivalent balances that exceed federally-insured limits with a number of financial institutions. Restricted Cash We maintain certain cash balances restricted as to withdrawal or use. Restricted cash assets are primarily insurance-related restricted trust assets. Accounts Receivable Accounts receivable primarily consists of receivables from third party gift card distributors, delivery partners, interest receivable, insurance liabilities covered by third-party insurance carriers and vendor rebates. Allowance for Credit Losses We closely monitor accounts receivable and held to maturity investment balances and estimate the allowance for credit losses when lifetime credit losses are expected by management. Our estimate is based on historical collection experience, external market data and other factors, including those related to current market conditions and events. We do not recognize a reserve for expected credit losses related to our U.S. Treasury security investments as management has concluded there is no risk of non-payment. As of December 31, 2024 and 2023, our allowance for credit losses was $2,953 and $2,742, respectively. Inventory Inventory, consisting principally of food, beverages, and supplies, is valued at the lower of first-in, first-out cost or net realizable value. Equity Method Investments Investments are accounted for under the equity method if we are able to exercise significant influence, but not control, over an investee. Our share of the earnings or losses as reported by the investees is included in interest and other income, net on the consolidated statements of income and comprehensive income. The investments are evaluated for impairment annually and when facts and circumstances indicate that the carrying value may not be recoverable. If a decline in fair value is determined to be other-than-temporary, an impairment charge is recorded in interest income and other income, net on our consolidated statements of income and comprehensive income. Investments Investments classified as trading securities are carried at fair value with any unrealized gain or loss being recorded in interest and other income, net on the consolidated statements of income and comprehensive income. Investments classified as available-for-sale are carried at fair value with unrealized gains and losses, net of tax, included as a component of other comprehensive income (loss), net of income taxes on the consolidated statements of income and comprehensive income. Held-to-maturity securities are carried at amortized cost. Non-marketable equity investments are measured at cost, less impairments, if any, plus or minus changes resulting from observable price changes in orderly transactions for the identical or similar investment of the same issuer. These gains or losses are included in interest and other income, net on the consolidated statements of income and comprehensive income. Our held-to-maturity investments are comprised of U.S. Treasury securities and corporate debt securities, which are held at amortized cost. We also have investments in notes receivable. Convertible notes are held at fair value. We have elected to fund certain deferred compensation plan obligations, as described further in Note 8. “Stock-Based Compensation and Employee Benefit Plans”, through a rabbi trust, the assets of which are designated as trading securities. The rabbi trust is subject to creditor claims in the event of insolvency, but the assets held in the rabbi trust are not available for general corporate purposes. Amounts in the rabbi trust are invested in mutual funds, consistent with the investment choices selected by participants in their Deferred Plan accounts, which are designated as trading securities, carried at fair value, and are included in other assets on the consolidated balance sheets. We record trading gains and losses, along with the offsetting amount related to the increase or decrease in deferred compensation to reflect our exposure to liabilities for payment under the deferred plan in general and administrative expenses on the consolidated statements of income and comprehensive income. Fair Value Measurements Fair value is the price we would receive to sell an asset or pay to transfer a liability (exit price) in an orderly transaction between market participants. For assets and liabilities recorded or disclosed at fair value, we determine fair value based on the following: Level 1: Quoted prices in active markets for identical assets or liabilities that the entity has the ability to access. Level 2: Observable inputs other than prices included in Level 1, such as quoted prices for similar assets and liabilities in active markets; quoted prices for identical or similar assets and liabilities in markets that are not active; or other inputs that are observable or can be corroborated with observable market data. Level 3: Unobservable inputs for the asset or liability. This includes certain pricing models, discounted cash flow methodologies and similar techniques that use significant unobservable inputs. Foreign Currency Translation The functional currency of our foreign entities is the currency of the primary economic environment in which the entity operates. The operations, assets, and liabilities of our entities outside the U.S. are initially measured using the functional currency of that entity. Gains and losses arising from the impact of foreign currency exchange rate fluctuations on transactions in foreign currency are included as a separate component of other comprehensive income (loss), net of income taxes on the consolidated statements of income and comprehensive income. Assets and liabilities of these foreign entities are translated at exchange rates in effect as of the balance sheet date. Income and expense accounts are translated monthly using average monthly exchange rates. Resulting translation adjustments are recorded in accumulated other comprehensive loss on the consolidated balance sheets. Leasehold Improvements, Property and Equipment Leasehold improvements, property and equipment are recorded at cost. Internal costs directly associated with the acquisition, development and construction of a restaurant are capitalized. During the years ended December 31, 2024, 2023 and 2022, we capitalized $17,624, $15,385, and $12,695 of internal costs, respectively. Expenditures for refurbishments and improvements that significantly add to the productivity capacity or extend the useful life are capitalized, while expenditures for maintenance and repairs are expensed as incurred. Capitalized software includes the costs of developing or obtaining internal-use software, such as external direct costs of materials and services, payroll and benefits costs, additional functionality, and costs to develop or obtain software that allows for access or conversion of historical data by new systems. We capitalize costs when the preliminary project stage is complete, management has authorized and committed to funding the software project, it is probable that the software project will be completed, and it is probable that the software will be used to perform the intended function. Depreciation is calculated using the straight-line method over the estimated useful lives of the assets. Leasehold improvements are amortized over the shorter of the lease term, which generally includes option periods that are reasonably certain, or the estimated useful lives of the assets. Upon retirement or disposal of assets, asset cost and accumulated depreciation are derecognized and any related gain or loss is reflected in impairment, closure costs, and asset disposals in the consolidated statements of income and comprehensive income. Assets to be disposed of are reported at the lower of their carrying amount or fair value less estimated costs to sell. At least annually, or when impairment indicators are present, we evaluate, and adjust when necessary, the estimated useful lives of leasehold improvements, property and equipment. The changes in estimated useful lives did not have a material impact on depreciation in any period. The estimated useful lives are: | | | | | | | Leasehold improvements and buildings | 3-20 years | | Furniture and fixtures | 4-7 years | | Equipment | 3-10 years |
Leases The majority of our operating leases consist of restaurant locations and office space. We determine if a contract contains a lease at inception. Our leases generally have remaining terms of 1-20 years and most include options to extend the leases for additional 5-year periods. Generally, the lease term is the minimum of the noncancelable period of the lease or the lease term inclusive of reasonably certain renewal periods up to a term of 20 years. We recognize an operating lease asset and operating lease liability for each lease with a contractual term greater than 12 months at the time of lease inception. We do not record leases with an initial term of 12 months or less on our consolidated balance sheet but continue to record rent expense on a straight-line basis over the lease term. Operating lease assets and liabilities are recognized at the lease commencement date, which is the date we control the use of the property. Operating lease liabilities represent the present value of lease payments not yet paid. We made the policy election to combine lease and non-lease components. We consider fixed CAM part of our fixed future lease payments; therefore, fixed CAM is also included in our lease liability. To determine the present value of lease payments not yet paid, we estimate incremental borrowing rates corresponding to the lease term including reasonably certain renewal periods. As we have no outstanding debt nor committed credit facilities, secured or otherwise, we estimate this rate based on prevailing financial market conditions, comparable company and credit analysis, and management judgment. Total lease costs, which are recorded primarily as occupancy costs, include fixed operating lease costs, variable lease costs and short-term lease costs. Most of our real estate leases require we pay certain expenses, such as CAM costs, real estate taxes and insurance, of which the fixed portion is included in operating lease costs. We recognize operating lease costs on a straight-line basis over the lease term. In addition to the above costs, variable lease costs also include amounts based on a percentage of gross sales in excess of specified levels and are recognized when probable and are not included in determining the present value of our operating lease liability. Operating lease assets represent our right to use an underlying asset and are based upon the operating lease liabilities adjusted for lease payments made at or before the lease commencement date, initial direct costs, lease incentives, and impairment of operating lease assets. For operating leases, operating lease assets are reduced over the lease term by the recognized straight-line lease expense less the amount of accretion of the lease liability. Additionally, tenant incentives used to fund leasehold improvements are generally recognized when earned and reduce our right-of-use asset related to the lease. These are amortized through the operating lease asset as reductions of expense over the lease term. Our lease agreements do not contain any material residual value guarantees or material restrictive covenants. We have not entered into any leases with related parties. Goodwill Goodwill is not subject to amortization, but instead is tested for impairment annually in the fourth quarter, or more frequently when impairment indicators are present, and we are required to record any necessary impairment adjustments. Impairment is measured as the excess of the carrying value over the fair value of the goodwill. No impairment charges were recognized on goodwill for the years ended December 31, 2024, 2023 and 2022. Insurance Liability We are self-insured for a significant portion of our employee health benefits programs, and carry significant retentions for risks and associated liabilities with respect to workers’ compensation, general liability, property and auto damage, employment practices liability, cyber liability and directors’ and officers’ liability. Predetermined loss limits have been arranged with third party insurance companies to limit exposure to these claims. We record a liability that represents our estimated cost of claims incurred and unpaid as of the balance sheet date. Our estimated liability is not discounted and is based on a number of assumptions and factors, including historical trends, actuarial assumptions and economic conditions, and is closely monitored and adjusted when warranted by changing circumstances. Reserves/Contingencies for Litigation and Other Matters We are involved in various claims and legal actions that arise in the ordinary course of business. We record an accrual for legal contingencies when we determine that it is probable that we have incurred a liability and we can reasonably estimate the amount of the loss. Income Taxes We compute income taxes using the asset and liability method, under which deferred income tax assets and liabilities are recognized based on the differences between the financial reporting bases and the respective tax bases of assets and liabilities. Deferred tax assets and liabilities are measured using enacted tax rates expected to apply to taxable income in the years in which we expect the temporary differences to reverse. Any effects of changes in income tax rates or tax laws are included in the provision for income taxes in the period that includes the enactment date. We routinely assess the realizability of our deferred tax assets by jurisdiction and may record a valuation allowance if, based on all available positive and negative evidence, we determine that some portion of the deferred tax assets may not be realized prior to expiration. If we determine that we may be able to realize our deferred tax assets in the future in excess of their net recorded amount, we would make an adjustment to the deferred tax asset valuation allowance, which would reduce the provision for income taxes during the period in which the determination was made that the deferred tax asset can be realized. We evaluate our tax filing positions and recognize a tax benefit from an uncertain tax position only if it is more likely than not that based on its technical merits the tax position will be sustained upon examination by the relevant taxing authorities, including resolutions of any related appeals or litigation processes. The tax benefits recognized in the financial statements from such a position are measured based on the largest tax benefit that has a greater than 50% likelihood of being realized upon settlement with a taxing authority. For uncertain tax positions that do not meet this threshold, we record a related tax reserve in the period in which it arises. We adjust our unrecognized tax benefit liability and provision for income taxes in the period in which the uncertain tax position is effectively settled, the statute of limitations expires for the relevant taxing authority to examine the tax position or when new information becomes available that requires a change in recognition and/or measurement of the liability. We recognize interest to be paid on an underpayment of income taxes in interest expense and any related statutory penalties in the provision for income taxes in our consolidated statements of income and comprehensive income. Accrued interest and penalties are included within the related tax reserve on our consolidated balance sheets. Revenue Recognition We generally recognize revenue, net of discounts and incentives, when payment is tendered at the point of sale. We report revenue net of sales-related taxes collected from guests and remitted to governmental taxing authorities. Food and beverage revenue primarily relates to the sale of food and beverages. Delivery service revenue is comprised of delivery and related service fees charged to guests on sales made through Chipotle’s app and website. Delivery Delivery services are fulfilled by third-party service providers. In some cases, we make delivery sales through our website Chipotle.com or the Chipotle App (“White Label Sales”). In other cases, we make delivery sales through a non-Chipotle owned channel, such as the delivery partner’s website or mobile app (“Marketplace Sales”). With respect to White Label Sales, we control the delivery services and generally recognize revenue, including delivery fees, when the delivery partner transfers food to the guest. For these sales, we receive payment directly from the guest at the time of sale. With respect to Marketplace Sales, we generally recognize revenue, excluding delivery fees collected by the delivery partner, when control of the food is transferred to the guest. We receive payment from the delivery partner subsequent to the transfer of food and the payment terms are short-term in nature. Gift Cards We sell gift cards, which do not have expiration dates and we do not deduct non-usage fees from outstanding gift card balances. Gift card balances are initially recorded as unearned revenue. We recognize revenue from gift cards when the gift card is redeemed by the guest. Historically, the majority of gift cards are redeemed within one year. In addition, a portion of gift cards are not expected to be redeemed and will be recognized as breakage over time in proportion to gift card redemptions. The gift card breakage rate is based on company and program specific information, including historical redemption patterns, and expected remittance to government agencies under unclaimed property laws, if applicable. We evaluate our gift card breakage rate estimate annually, or more frequently as circumstances warrant, and apply that rate to gift card redemptions. Gift card liability balances are typically highest at the end of each calendar year following increased gift card sales during the holiday season; accordingly, revenue recognized from gift card liability balances is highest in the first quarter of each calendar year. Chipotle Rewards We have a loyalty program called Chipotle Rewards. Guests who enroll in the program generally earn points for every dollar spent. We may also periodically offer promotions, which typically provide the guest with the opportunity to earn bonus points or other rewards. Guests may redeem earned points for various rewards, which are primarily comprised of free food and beverage items. Earned rewards generally expire one month to two months after they are issued, and points generally expire if an account is inactive for a period of six months. We defer revenue associated with the estimated selling price of points or rewards earned by guests as each point or reward is earned, net of points or rewards we do not expect to be redeemed. The estimated selling price of each point or reward earned is based on the estimated value of the product for which the reward is expected to be redeemed. Our estimate of points and rewards we expect to be redeemed is based on historical and other company specific data. The costs associated with rewards redeemed are primarily included in food, beverage, and packaging on our consolidated statements of income and comprehensive income. We evaluate Chipotle Rewards point breakage annually, or more frequently as circumstances warrant. We recognize revenue associated with Chipotle Rewards within food and beverage revenue on the consolidated statements of income and comprehensive income when a guest redeems an earned reward. Deferred revenue associated with Chipotle Rewards is included in unearned revenue on our consolidated balance sheets. Food, Beverage and Packaging Costs Food, beverage and packaging costs include inventory, warehousing and related purchasing and distribution costs. Other Operating Costs Other operating costs include marketing and promotional costs, delivery expense, bank and credit card processing fees, restaurant utilities, technology costs, maintenance costs and other costs that directly support the operation and sales-related activities of our restaurants. Consideration Received from Vendors We receive consideration for a variety of vendor-sponsored programs, such as volume rebates and promotions. Vendor consideration is recorded as a reduction of food, beverage and packaging or other operating costs on our consolidated statements of income and comprehensive income depending on the classification of the related costs. Advertising, Marketing and Promotional Costs Advertising, marketing and promotional costs are expensed as incurred and totaled $286,044, $264,085 and $250,673 for the years ended December 31, 2024, 2023 and 2022, respectively. Advertising, marketing and promotional costs include costs related to free food which a guest does not need to make a purchase to earn. These costs are included in other operating costs on the consolidated statements of income and comprehensive income. Stock-Based Compensation RSUs and SOSARs generally vest equally on the second and third anniversaries of the grant date, and SOSARs expire after seven years. PSUs generally vest on the third anniversary of the grant date, depending on performance levels achieved relative to the target market and performance factors in each PSU agreement. Stock-based compensation expense is generally recognized on a straight-line basis for each separate vesting portion. The grant date fair value of RSUs is based on the closing price of Chipotle common stock on the award date. The grant date fair value of PSUs that contain only performance conditions is based on the closing price of Chipotle common stock on the award date, where the grant date fair value of PSUs that also contain market conditions consider the output of the Monte Carlo simulation in the grant date fair value, as applicable. The grant date fair value of SOSARs is determined using the Black-Scholes valuation model. Compensation expense related to employees eligible to retire and retain full rights to the awards is recognized over 12 months which coincides with the service period required to earn the full award. We estimate forfeitures based on historical data when determining the amount of stock-based compensation costs to be recognized in each period. PSUs with performance or market vesting conditions generally vest based on our achievement versus stated targets or criteria over a three-year performance and service period. Performance goals are determined by the Board and include measures such as average restaurant operating margin, restaurant cash flow dollars, new restaurant unit growth, and total shareholder return relative to our peer group. Compensation expense on stock awards subject to performance conditions, which is based on the quantity of awards we have determined are probable of vesting, is recognized over the longer of the estimated performance goal attainment period or time vesting period. Compensation expense is recognized ratably for awards subject to market conditions regardless of whether the market condition is satisfied, provided that the requisite service has been met. Some stock-based compensation awards are made to employees involved in our new restaurant development activities, and expense for these awards is recognized as capitalized development and included in leasehold improvements, property and equipment, net, on the consolidated balance sheets. Restaurant Pre-Opening Costs Pre-opening costs, including rent, wages, benefits and travel for training and opening teams, food and other restaurant operating costs, are expensed as incurred prior to a restaurant opening for business. Impairment of Long-Lived Assets Long-lived assets are reviewed for impairment whenever events or changes in circumstances indicate that the carrying amount of an asset may not be recoverable. Long-lived assets are grouped at the lowest level for which identifiable cash flows are largely independent of the cash flows of other assets and liabilities. For restaurant assets we test impairment at the individual restaurant asset group level, which includes leasehold improvements, property and equipment and operating lease assets. The fair value measurement for asset impairment is generally based on Level 3 inputs. See “Fair Value Measurements” above for a description of level inputs. We first compare the carrying value of the asset (or asset group, referred interchangeably throughout as asset) to the asset’s estimated future undiscounted cash flows. If the estimated undiscounted future cash flows are less than the carrying value of the asset, we determine if we have an impairment loss by comparing the carrying value of the asset to the asset's estimated fair value. The estimated fair value of the asset is generally determined using the income approach to measure the fair value, which is based on the present value of estimated future cash flows. Key inputs to the income approach for restaurant assets include the discount rate, projected restaurant revenues and expenses, and sublease income if we are closing the restaurant. In certain cases, management uses other market information, when available, to estimate the fair value of an asset. The impairment charges represent the excess of each asset’s carrying amount over its estimated fair value and are allocated among the long-lived asset or assets of the group. Earnings per Share Basic earnings per share is calculated by dividing income available to common shareholders by the weighted-average number of shares of common stock outstanding during each period. Diluted earnings per share (“diluted EPS”) is calculated using income available to common shareholders divided by diluted weighted-average shares of common stock outstanding during each period. Potentially dilutive securities include shares of common stock underlying SOSARs and non-vested stock awards (collectively “stock awards”). Diluted EPS considers the impact of potentially dilutive securities except in periods in which there is a loss because the inclusion of the potential common shares would have an anti-dilutive effect. Stock awards are excluded from the calculation of diluted EPS in the event they are subject to performance conditions or are antidilutive. Recently Issued Accounting Standards Recently Adopted Accounting Pronouncement In November 2023, the FASB issued ASU No. 2023-07, “Segment Reporting (Topic 280): Improvements to Reportable Segment Disclosure.” The ASU updates reportable segment disclosure requirements, primarily through requiring enhanced disclosures about significant segment expenses and information used to assess segment performance. The amendments do not change how segments are determined, aggregated, or how thresholds are applied to determine reportable segments. We adopted ASU No. 2023-07 during the year ended December 31, 2024. See Note 14 "Segment Reporting" in the accompanying notes to the consolidated financial statements for further detail. Recent Accounting Pronouncements Not Yet Adopted In December 2023, the FASB issued ASU No. 2023-09, “Income Taxes (Topic 740): Improvements to Income Tax Disclosures.” The ASU includes amendments requiring enhanced income tax disclosures, primarily related to standardization and disaggregation of rate reconciliation categories and income taxes paid by jurisdiction. The guidance is effective for fiscal years beginning after December 15, 2024, with early adoption permitted, and should be applied either prospectively or retrospectively. We are currently evaluating the impact of adopting this ASU on our consolidated financial statements and related disclosures. In March 2024, the Securities and Exchange Commission ("SEC") issued its final climate disclosure rules. The rules require disclosure of climate-related information outside of the audited financial statements and disclosure in the footnotes addressing specified financial statement effects of severe weather events and other natural conditions above certain financial thresholds, certain carbon offsets and renewable energy credits or certificates, if material. Disclosure requirements will begin phasing in for fiscal years beginning on or after January 1, 2025. On April 4, 2024, the SEC determined to voluntarily stay the effective date of the final rules pending certain legal challenges. We are currently evaluating the impact of adopting the new rules and continue to monitor the status of the related legal challenges. In November 2024, the FASB issued ASU No. 2024-03, "Disaggregation of Income Statement Expenses (Subtopic 220-40)." The ASU requires public entities to disaggregate, in a tabular presentation, certain income statement expenses into different categories, such as purchases of inventory, employee compensation, depreciation, and intangible asset amortization. The guidance is effective for fiscal years beginning after December 15, 2026, with early adoption permitted, and may be applied retrospectively. We are currently evaluating the impact of adopting the new ASU on our consolidated financial statements and related disclosures. We reviewed all other recently issued accounting pronouncements and concluded that they were either not applicable or not expected to have a significant impact to the consolidated financial statements.
|
| X |
- References
+ Details
| Name: |
us-gaap_AccountingPoliciesAbstract |
| Namespace Prefix: |
us-gaap_ |
| Data Type: |
xbrli:stringItemType |
| Balance Type: |
na |
| Period Type: |
duration |
|
| X |
- DefinitionThe entire disclosure for all significant accounting policies of the reporting entity. Reference 1: http://www.xbrl.org/2003/role/disclosureRef
-Topic 235
-SubTopic 10
-Name Accounting Standards Codification
-Section 50
-Paragraph 1
-Publisher FASB
-URI https://asc.fasb.org/1943274/2147483426/235-10-50-1
Reference 2: http://fasb.org/us-gaap/role/ref/legacyRef
-Topic 235
-Name Accounting Standards Codification
-Publisher FASB
-URI https://asc.fasb.org/235/tableOfContent
| Name: |
us-gaap_SignificantAccountingPoliciesTextBlock |
| Namespace Prefix: |
us-gaap_ |
| Data Type: |
dtr-types:textBlockItemType |
| Balance Type: |
na |
| Period Type: |
duration |
|
v3.25.0.1
Supplemental Balance Sheet Information
|
12 Months Ended |
Dec. 31, 2024 |
|---|
| Supplemental Balance Sheet Information [Abstract] |
|
| Supplemental Balance Sheet Information |
Supplemental Balance Sheet Information Prepaid expenses and other current assets were as follows: | | | | | | | | | | | | | December 31, | | 2024 | | 2023 | | Prepaid expenses | $ | 80,253 | | $ | 97,670 | | Other current assets | 17,285 | | 19,792 | | Prepaid expenses and other current assets | $ | 97,538 | | $ | 117,462 |
Leasehold improvements, property and equipment, net were as follows: | | | | | | | | | | | | | December 31, | | 2024 | | 2023 | | Land | $ | 12,943 | | $ | 12,943 | | Leasehold improvements and buildings | 2,918,408 | | 2,595,866 | | Furniture and fixtures | 293,841 | | 267,294 | | Equipment | 1,221,290 | | 1,114,236 | | Construction in Progress | 192,945 | | 161,721 | | Leasehold improvements, property and equipment, gross | 4,639,427 | | 4,152,060 | | Accumulated depreciation | (2,249,301) | | | (1,982,022) | | | Leasehold improvements, property and equipment, net | $ | 2,390,126 | | $ | 2,170,038 |
Accrued payroll and benefits were as follows: | | | | | | | | | | | | | December 31, | | 2024 | | 2023 | | Workers' compensation liability | $ | 35,242 | | $ | 30,520 | | Accrued payroll, bonuses and taxes | 195,660 | | 170,251 | | Other accrued payroll and benefits | 31,011 | | 26,766 | | Accrued payroll and benefits | $ | 261,913 | | $ | 227,537 |
Accrued liabilities were as follows: | | | | | | | | | | | | | December 31, | | 2024 | | 2023 | | Sales and use tax payable | $ | 47,206 | | $ | 42,071 | | General, product and automobile insurance reserves | 34,404 | | 30,169 | | Other accrued liabilities | 98,137 | | 75,448 | | Accrued liabilities | $ | 179,747 | | $ | 147,688 |
|
| X |
- DefinitionThe entire disclosures of supplemental information, including descriptions and amounts, related to the balance sheet, income statement, and/or cash flow statement.
| Name: |
us-gaap_AdditionalFinancialInformationDisclosureTextBlock |
| Namespace Prefix: |
us-gaap_ |
| Data Type: |
dtr-types:textBlockItemType |
| Balance Type: |
na |
| Period Type: |
duration |
|
v3.25.0.1
Revenue Recognition
|
12 Months Ended |
Dec. 31, 2024 |
|---|
| Revenue from Contract with Customer [Abstract] |
|
| Revenue Recognition |
Revenue Recognition Gift Cards The gift card liability included in unearned revenue on the consolidated balance sheets was as follows: | | | | | | | | | | | | | | December 31, | | | 2024 | | 2023 | | Gift card liability | $ | 181,771 | | | $ | 164,930 | |
Revenue recognized from the redemption of gift cards that was included in unearned revenue at the beginning of the year was as follows: | | | | | | | | | | | | | | | | | | | | Year ended December 31, | | | 2024 | | 2023 | | 2022 | | Revenue recognized from gift card liability balance at the beginning of the year | $ | 80,067 | | $ | 61,389 | | $ | 59,175 |
Chipotle Rewards Changes in our Chipotle Rewards liability included in unearned revenue on the consolidated balance sheets were as follows: | | | | | | | | | | | | | | | | | | | | Year ended December 31, | | | 2024 | | 2023 | | 2022 | | Chipotle Rewards liability, beginning balance | $ | 44,750 | | $ | 38,057 | | $ | 25,572 | | Revenue deferred | 164,986 | | 135,490 | | 121,406 | | Revenue recognized | (152,930) | | | (128,797) | | | (108,921) | | | Chipotle Rewards liability, ending balance | $ | 56,806 | | $ | 44,750 | | $ | 38,057 |
|
| X |
- References
+ Details
| Name: |
us-gaap_RevenueFromContractWithCustomerAbstract |
| Namespace Prefix: |
us-gaap_ |
| Data Type: |
xbrli:stringItemType |
| Balance Type: |
na |
| Period Type: |
duration |
|
| X |
- DefinitionThe entire disclosure of revenue from contract with customer to transfer good or service and to transfer nonfinancial asset. Includes, but is not limited to, disaggregation of revenue, credit loss recognized from contract with customer, judgment and change in judgment related to contract with customer, and asset recognized from cost incurred to obtain or fulfill contract with customer. Excludes insurance and lease contracts. Reference 1: http://www.xbrl.org/2003/role/disclosureRef
-Topic 606
-SubTopic 10
-Name Accounting Standards Codification
-Section 50
-Paragraph 9
-Publisher FASB
-URI https://asc.fasb.org/1943274/2147479806/606-10-50-9
Reference 2: http://www.xbrl.org/2003/role/disclosureRef
-Topic 606
-SubTopic 10
-Name Accounting Standards Codification
-Section 50
-Paragraph 10
-Publisher FASB
-URI https://asc.fasb.org/1943274/2147479806/606-10-50-10
Reference 3: http://www.xbrl.org/2003/role/disclosureRef
-Topic 606
-SubTopic 10
-Name Accounting Standards Codification
-Section 50
-Paragraph 15
-Publisher FASB
-URI https://asc.fasb.org/1943274/2147479806/606-10-50-15
Reference 4: http://www.xbrl.org/2003/role/disclosureRef
-Topic 606
-SubTopic 10
-Name Accounting Standards Codification
-Section 50
-Paragraph 12
-Subparagraph (a)
-Publisher FASB
-URI https://asc.fasb.org/1943274/2147479806/606-10-50-12
Reference 5: http://www.xbrl.org/2003/role/disclosureRef
-Topic 606
-SubTopic 10
-Name Accounting Standards Codification
-Section 50
-Paragraph 12
-Subparagraph (b)
-Publisher FASB
-URI https://asc.fasb.org/1943274/2147479806/606-10-50-12
Reference 6: http://www.xbrl.org/2003/role/disclosureRef
-Topic 606
-SubTopic 10
-Name Accounting Standards Codification
-Section 50
-Paragraph 12
-Subparagraph (c)
-Publisher FASB
-URI https://asc.fasb.org/1943274/2147479806/606-10-50-12
Reference 7: http://www.xbrl.org/2003/role/disclosureRef
-Topic 606
-SubTopic 10
-Name Accounting Standards Codification
-Section 50
-Paragraph 12
-Subparagraph (d)
-Publisher FASB
-URI https://asc.fasb.org/1943274/2147479806/606-10-50-12
Reference 8: http://www.xbrl.org/2003/role/disclosureRef
-Topic 606
-SubTopic 10
-Name Accounting Standards Codification
-Section 50
-Paragraph 12
-Subparagraph (e)
-Publisher FASB
-URI https://asc.fasb.org/1943274/2147479806/606-10-50-12
Reference 9: http://www.xbrl.org/2003/role/disclosureRef
-Topic 606
-SubTopic 10
-Name Accounting Standards Codification
-Section 50
-Paragraph 13
-Subparagraph (b)(2)
-Publisher FASB
-URI https://asc.fasb.org/1943274/2147479806/606-10-50-13
Reference 10: http://www.xbrl.org/2003/role/disclosureRef
-Name Accounting Standards Codification
-Topic 606
-Publisher FASB
-URI https://asc.fasb.org/606/tableOfContent
| Name: |
us-gaap_RevenueFromContractWithCustomerTextBlock |
| Namespace Prefix: |
us-gaap_ |
| Data Type: |
dtr-types:textBlockItemType |
| Balance Type: |
na |
| Period Type: |
duration |
|
v3.25.0.1
Fair Value Measurements
|
12 Months Ended |
Dec. 31, 2024 |
|---|
| Fair Value Disclosures [Abstract] |
|
| Fair Value Measurements |
Fair Value Measurements Assets and Liabilities Measured at Fair Value on a Recurring Basis The carrying value of our cash and cash equivalents, restricted cash, accounts receivable and accounts payable approximate fair value because of their short-term nature. The following tables show our cash, cash equivalents, and debt investments by significant investment category as of December 31, 2024 and 2023: | | | | | | | | | | | | | | | | | | | | | | | | | | | | | | | | | | | | | | | | | | | December 31, 2024 | | Adjusted cost | | Unrealized Gains | | Unrealized Losses | | Fair Value | | Cash and Cash Equivalents | | Current Investments | | Long-term Investments | | Cash | $ | 95,969 | | | $ | - | | | $ | - | | | $ | 95,969 | | | $ | 95,969 | | | $ | - | | | $ | - | | | Level 1 | | | | | | | | | | | | | | | Money market funds | 574,689 | | | - | | | - | | | 574,689 | | | 574,689 | | | - | | | - | | | Time deposits | 77,879 | | | - | | | - | | | 77,879 | | | 77,879 | | | - | | | - | | | U.S. Treasury securities | 1,404,777 | | | 4,831 | | | 693 | | | 1,408,915 | | | - | | | 635,392 | | | 769,385 | | | Corporate debt securities | 48,210 | | | 116 | | | - | | | 48,326 | | | - | | | 34,736 | | | 13,474 | | | Subtotal | 2,105,555 | | | 4,947 | | | 693 | | | 2,109,809 | | | 652,568 | | | 670,128 | | | 782,859 | | | Level 3 | | | | | | | | | | | | | | Corporate debt security(1) | 16,401 | | | 11 | | | - | | | 16,412 | | | - | | | 2,000 | | | 14,401 | | Notes receivable(2) | 3,763 | | | 250 | | | - | | | 4,013 | | | - | | | 2,250 | | | 1,763 | | | Subtotal | 20,164 | | | 261 | | | - | | | 20,425 | | | - | | | 4,250 | | | 16,164 | | | Total | $ | 2,221,688 | | | $ | 5,208 | | | $ | 693 | | | $ | 2,226,203 | | | $ | 748,537 | | | $ | 674,378 | | | $ | 799,023 | |
| | | | | | | | | | | | | | | | | | | | | | | | | | | | | | | | | | | | | | | | | | | December 31, 2023 | | Adjusted cost | | Unrealized Gains | | Unrealized Losses | | Fair Value | | Cash and Cash Equivalents | | Current Investments | | Long-term Investments | | Cash | $ | 128,458 | | | $ | - | | | $ | - | | | $ | 128,458 | | | $ | 128,458 | | | $ | - | | | $ | - | | | Level 1 | | | | | | | | | | | | | | | Money market funds | 355,872 | | | - | | | - | | | 355,872 | | | 355,872 | | | - | | | - | | | Time deposits | 76,279 | | | - | | | - | | | 76,279 | | | 76,279 | | | - | | | - | | | U.S. Treasury securities | 1,200,658 | | | 4,352 | | | 4,083 | | | 1,200,927 | | | - | | | 731,339 | | | 469,319 | | | Corporate debt securities | 19,755 | | | 13 | | | 7 | | | 19,761 | | | - | | | - | | | 19,755 | | | Subtotal | 1,652,564 | | | 4,365 | | | 4,090 | | | 1,652,839 | | | 432,151 | | | 731,339 | | | 489,074 | | | Level 3 | | | | | | | | | | | | | | Corporate debt security(1) | 17,401 | | | - | | | 27 | | | 17,374 | | | - | | | 999 | | | 16,402 | | Notes receivable(2) | 14,500 | | | 1,289 | | | 141 | | | 15,648 | | | - | | | 2,500 | | | 13,148 | | | Subtotal | 31,901 | | | 1,289 | | | 168 | | | 33,022 | | | - | | | 3,499 | | | 29,550 | | | Total | $ | 1,812,923 | | | $ | 5,654 | | | $ | 4,258 | | | $ | 1,814,319 | | | $ | 560,609 | | | $ | 734,838 | | | $ | 518,624 | |
(1)The fair value of the corporate debt security is measured using Level 3 (unobservable) inputs. We determined the fair value for the corporate debt security using an internally-developed valuation model and unobservable inputs include credit and liquidity spreads and effective maturity. (2)We have elected to measure our investment in convertible notes receivable of private companies at fair value under the fair value option. The fair value of the notes receivable are measured using Level 3 (unobservable) inputs. We determined the fair value for the notes receivable using an internally-developed valuation model and unobservable inputs include estimates of the equity value of the underlying business and the timing and probability of future financing events. Assets and Liabilities Measured at Fair Value on a Nonrecurring Basis Assets recognized or disclosed at fair value on the consolidated financial statements on a nonrecurring basis include items such as leasehold improvements, property and equipment, certain long-term investments, operating lease assets, other assets, and goodwill. These assets are measured at fair value whenever events or changes in circumstances indicate that the carrying amount of an asset may not be recoverable or if there has been an observable price change of a non-marketable equity security. For the years ended December 31, 2024, 2023 and 2022, nonrecurring fair value measurements resulting in asset impairments were not material.
|
| X |
- References
+ Details
| Name: |
us-gaap_FairValueDisclosuresAbstract |
| Namespace Prefix: |
us-gaap_ |
| Data Type: |
xbrli:stringItemType |
| Balance Type: |
na |
| Period Type: |
duration |
|
| X |
- DefinitionThe entire disclosure for investments in certain debt and equity securities. Reference 1: http://www.xbrl.org/2009/role/commonPracticeRef
-Topic 940
-SubTopic 320
-Name Accounting Standards Codification
-Publisher FASB
-URI https://asc.fasb.org/940-320/tableOfContent
Reference 2: http://www.xbrl.org/2003/role/disclosureRef
-Name Regulation S-K (SK)
-Number 229
-Section 1403
-Paragraph b
-Publisher SEC
Reference 3: http://www.xbrl.org/2003/role/disclosureRef
-Topic 320
-Name Accounting Standards Codification
-Publisher FASB
-URI https://asc.fasb.org/320/tableOfContent
Reference 4: http://www.xbrl.org/2003/role/disclosureRef
-Topic 320
-SubTopic 10
-Name Accounting Standards Codification
-Section 50
-Paragraph 10
-Subparagraph (d)
-Publisher FASB
-URI https://asc.fasb.org/1943274/2147481800/320-10-50-10
Reference 5: http://www.xbrl.org/2003/role/disclosureRef
-Topic 820
-SubTopic 10
-Name Accounting Standards Codification
-Section 50
-Paragraph 6B
-Subparagraph (b)
-Publisher FASB
-URI https://asc.fasb.org/1943274/2147482106/820-10-50-6B
Reference 6: http://www.xbrl.org/2003/role/disclosureRef
-Topic 820
-SubTopic 10
-Name Accounting Standards Codification
-Section 50
-Paragraph 6B
-Subparagraph (c)
-Publisher FASB
-URI https://asc.fasb.org/1943274/2147482106/820-10-50-6B
Reference 7: http://fasb.org/us-gaap/role/ref/legacyRef
-Topic 942
-SubTopic 320
-Name Accounting Standards Codification
-Publisher FASB
-URI https://asc.fasb.org/942-320/tableOfContent
| Name: |
us-gaap_InvestmentsInDebtAndMarketableEquitySecuritiesAndCertainTradingAssetsDisclosureTextBlock |
| Namespace Prefix: |
us-gaap_ |
| Data Type: |
dtr-types:textBlockItemType |
| Balance Type: |
na |
| Period Type: |
duration |
|
v3.25.0.1
Equity Investments
|
12 Months Ended |
Dec. 31, 2024 |
|---|
| Investments, Debt and Equity Securities [Abstract] |
|
| Equity Investments |
Equity Investments | | | | | | | | | | | | | | December 31, | | | 2024 | | 2023 | | Equity method investments | $ | 28,097 | | $ | 8,896 | | Other investments | 69,002 | | 45,864 | | Total | $ | 97,099 | | $ | 54,760 |
Equity Method Investments As of December 31, 2024, and December 31, 2023, we owned 6,487 and 4,325 shares of common stock of Tractor Beverages, Inc. (“Tractor”). As of December 31, 2024, our investment represents ownership of approximately 13.8% of Tractor, and we have invested total cash consideration of $14,872. As we are a significant customer of Tractor and maintain board representation, we are accounting for our investment under the equity method. There were no impairment charges for the years ended December 31, 2024, 2023 or 2022, associated with this equity method investment. The investment in common stock is included within other assets on the consolidated balance sheets with a carrying value of $18,097 and $8,896 as of December 31, 2024 and December 31, 2023, respectively. Refer to Note 13. “Related Party Transactions” for related party disclosures. Other Investments As of December 31, 2024, we held 5,819 shares of the Series B Preferred Stock of Hyphen. Hyphen is a privately held company, and as such, the preferred shares comprising our investment are illiquid and fair value is not readily determinable. As of December 31, 2024, we have recognized a cumulative gain of $6,782 related to our investment in Hyphen. The investment is included within long-term investments on the consolidated balance sheet with a carrying value of $31,782 as of December 31, 2024. As of December 31, 2024, we owned 766 shares of the Series C Preferred Stock of Nuro, Inc. (“Nuro”). Our investment represents a minority interest and we have determined that we do not have significant influence over Nuro. Nuro is a privately held company, and as such, the preferred shares comprising our investment are illiquid and fair value is not readily determinable. As of December 31, 2024, we have recognized a cumulative gain of $5,968 related to our investment in Nuro due to observable transactions in prior periods. The investment is included within long-term investments on the consolidated balance sheets with a carrying value of $15,968 as of December 31, 2024 and December 31, 2023, respectively. As of December 31, 2024, we held additional investments in other entities through the Cultivate Next Fund. These additional investments are included within long-term investments on the consolidated balance sheets with a carrying value of $21,252 and $21,221 as of December 31, 2024 and December 31, 2023, respectively.
|
| X |
- DefinitionEquity Investments Disclosure
| Name: |
cmg_EquityInvestmentsDisclosureTextBlock |
| Namespace Prefix: |
cmg_ |
| Data Type: |
dtr-types:textBlockItemType |
| Balance Type: |
na |
| Period Type: |
duration |
|
| X |
- References
+ Details
| Name: |
us-gaap_InvestmentsDebtAndEquitySecuritiesAbstract |
| Namespace Prefix: |
us-gaap_ |
| Data Type: |
xbrli:stringItemType |
| Balance Type: |
na |
| Period Type: |
duration |
|
v3.25.0.1
Income Taxes
|
12 Months Ended |
Dec. 31, 2024 |
|---|
| Income Tax Disclosure [Abstract] |
|
| Income Taxes |
Income Taxes Income before income taxes, classified by source of income, was as follows: | | | | | | | | | | | | | | | | | | | Year ended December 31, | | 2024 | | 2023 | | 2022 | | Domestic | $ | 2,031,759 | | $ | 1,637,756 | | $ | 1,192,004 | | Foreign | (21,529) | | | (17,250) | | | (10,473) | | | Income before income taxes | $ | 2,010,230 | | $ | 1,620,506 | | $ | 1,181,531 |
The components of the provision for income taxes were as follows: | | | | | | | | | | | | | | | | | | | Year ended December 31, | | 2024 | | 2023 | | 2022 | | Current tax: | | | | | | | U.S. Federal | $ | 412,943 | | | $ | 314,757 | | | $ | 246,210 | | U.S. State and Local | 104,478 | | | 85,355 | | | 79,041 | | | Foreign | 1,636 | | | 1,162 | | | 374 | | | 519,057 | | | 401,274 | | | 325,625 | | Deferred tax: | | | | | | | U.S. Federal | (32,751) | | (7,992) | | (23,502) | | | U.S. State and Local | (10,195) | | (1,532) | | | (19,940) | | Foreign | (4,385) | | | (7,606) | | 3,771 | | (47,331) | | (17,130) | | (39,671) | | | Valuation allowance | 4,394 | | 7,625 | | | (3,524) | | | Provision for income taxes | $ | 476,120 | | | $ | 391,769 | | | $ | 282,430 | |
The effective tax rate differs from the statutory tax rates as follows: | | | | | | | | | | | | | | | | | | | Year ended December 31, | | 2024 | | 2023 | | 2022 | | Statutory U.S. federal income tax rate | 21.0% | | 21.0% | | 21.0% | | State income tax, net of related federal income tax benefit | 3.7 | | 4.0 | | 3.8 | | Federal tax credits | (0.9) | | | (1.0) | | | (1.0) | | | Executive compensation disallowed | 0.5 | | 0.8 | | 0.8 | | Valuation allowance | 0.3 | | 0.3 | | 0.2 | | Uncertain tax position reserves | - | | 0.4 | | 0.3 | | Other | 0.2 | | 0.2 | | 0.6 | | Return to provision and other discrete items | (0.1) | | | (0.2) | | | (0.1) | | Equity compensation related adjustments | (1.0) | | | (1.3) | | | (1.7) | | | | | | | | | Effective income tax rate | 23.7% | | 24.2% | | 23.9% |
The effective tax rate for the year ended December 31, 2024, was lower than the effective tax rate for the year ended December 31, 2023, primarily due to a decrease in nondeductible expenses and income tax reserves, partially offset by a reduction in excess tax benefits related to option exercises and equity vesting. The components of the deferred income tax assets and liabilities for continuing operations were as follows: | | | | | | | | | | | | | December 31, | | 2024 | | 2023 | | Deferred income tax liability: | | | | | Leasehold improvements, property and equipment, net | $ | 262,692 | | $ | 272,017 | | Goodwill and other assets | 1,753 | | 1,743 | | Operating lease assets | 1,088,934 | | 972,835 | | Total deferred income tax liability | 1,353,379 | | 1,246,595 | | Deferred income tax asset: | | | | | Gift card liability | 19,087 | | 18,101 | | Capitalized transaction costs | 323 | | 323 | | Stock-based compensation and other employee benefits | 61,574 | | 50,954 | | Foreign net operating loss carry-forwards | 35,215 | | 32,252 | | State credits | 872 | | 1,838 | | Operating lease liabilities | 1,159,788 | | 1,038,911 | | Allowances, reserves and other | 26,105 | | 12,870 | | Capitalized research costs | 29,122 | | 25,990 | | Prepaid assets and other | 10,334 | | 6,637 | | State net operating loss carry-forwards | 3,867 | | 4,332 | | Valuation allowance | (39,116) | | | (34,722) | | | Total deferred income tax asset | 1,307,171 | | 1,157,486 | | Deferred income tax liabilities | $ | 46,208 | | $ | 89,109 |
Gross foreign net operating losses (“NOLs”) were $165,085 and $149,891 as of December 31, 2024 and 2023, respectively. Our foreign NOLs can be carried forward indefinitely. Gross state NOLs available across all jurisdictions in which we operate were $52,950 and $62,492 as of December 31, 2024 and 2023, respectively. Our state NOLs expire over varying intervals in the future. We had gross valuation allowances against certain foreign deferred tax assets of $183,346 and $160,607 as of December 31, 2024 and 2023, respectively. The increase in the valuation allowances were primarily related to net operating losses of consolidated foreign subsidiaries. Unrecognized Tax Benefits A reconciliation of the unrecognized tax benefits was as follows: | | | | | | | | | | | | | | | | | | | Year ended December 31, | | 2024 | | 2023 | | 2022 | | Beginning of year | $ | 16,488 | | $ | 8,902 | | $ | 5,262 | | Increase resulting from prior year tax positions | 3,737 | | 7,561 | | 3,937 | | Decrease resulting from prior year tax positions | (3,748) | | | (295) | | - | | | Increase resulting from current year tax positions | 916 | | 783 | | 312 | | Settlements with taxing authorities | - | | | (6) | | - | | Lapsing of statutes of limitations | (505) | | | (457) | | | (609) | | | End of year | $ | 16,888 | | $ | 16,488 | | $ | 8,902 |
Interest expense related to uncertain tax positions is recognized in interest and other income, net on the consolidated statements of income and comprehensive income. Penalties related to uncertain tax positions are recognized in provision for income taxes on the consolidated statements of income and comprehensive income. For the years ended December 31, 2024, 2023 and 2022, we recognized $1,441, $1,541 and $384, respectively, in interest expense related to uncertain tax positions. These are gross amounts before any tax benefits and are included in other liabilities on the consolidated balance sheets. As of December 31, 2024 and 2023, we have accrued interest of $2,959 and $2,026, respectively. We were subject to an examination by the Internal Revenue Service (“IRS”) for our U.S. income tax returns for the tax year ended December 31, 2020. As a result of the examination, the IRS has issued an immaterial assessment of income taxes, interest, and penalties. For the majority of states where we have a significant presence, we are no longer subject to tax examinations by tax authorities for tax years before 2020. Currently, we expect expirations of statutes of limitations, excluding indemnified amounts, on reserves of approximately $3,035 within the next twelve months. It is reasonably possible the amount of the unrecognized benefit with respect to certain unrecognized positions could significantly increase or decrease within the next twelve months and would have an impact on net income.
|
| X |
- DefinitionThe entire disclosure for income tax. Reference 1: http://www.xbrl.org/2003/role/disclosureRef
-Topic 740
-SubTopic 10
-Name Accounting Standards Codification
-Section 50
-Paragraph 12
-Publisher FASB
-URI https://asc.fasb.org/1943274/2147482685/740-10-50-12
Reference 2: http://www.xbrl.org/2003/role/exampleRef
-Topic 740
-SubTopic 10
-Name Accounting Standards Codification
-Section 55
-Paragraph 231
-Publisher FASB
-URI https://asc.fasb.org/1943274/2147482663/740-10-55-231
Reference 3: http://www.xbrl.org/2003/role/disclosureRef
-Topic 740
-SubTopic 10
-Name Accounting Standards Codification
-Section 50
-Paragraph 12C
-Publisher FASB
-URI https://asc.fasb.org/1943274/2147482685/740-10-50-12C
Reference 4: http://www.xbrl.org/2003/role/disclosureRef
-Topic 740
-SubTopic 10
-Name Accounting Standards Codification
-Section 50
-Paragraph 12B
-Publisher FASB
-URI https://asc.fasb.org/1943274/2147482685/740-10-50-12B
Reference 5: http://www.xbrl.org/2003/role/disclosureRef
-Topic 740
-SubTopic 270
-Name Accounting Standards Codification
-Section 50
-Paragraph 1
-Publisher FASB
-URI https://asc.fasb.org/1943274/2147477891/740-270-50-1
Reference 6: http://www.xbrl.org/2003/role/disclosureRef
-Topic 740
-SubTopic 10
-Name Accounting Standards Codification
-Section S99
-Paragraph 1
-Subparagraph (SAB Topic 6.I.5.Q1)
-Publisher FASB
-URI https://asc.fasb.org/1943274/2147479360/740-10-S99-1
Reference 7: http://www.xbrl.org/2003/role/disclosureRef
-Topic 946
-SubTopic 20
-Name Accounting Standards Codification
-Section 50
-Paragraph 13
-Publisher FASB
-URI https://asc.fasb.org/1943274/2147480990/946-20-50-13
Reference 8: http://www.xbrl.org/2003/role/disclosureRef
-Topic 235
-SubTopic 10
-Name Accounting Standards Codification
-Section S99
-Paragraph 1
-Subparagraph (SX 210.4-08(h)(2))
-Publisher FASB
-URI https://asc.fasb.org/1943274/2147480678/235-10-S99-1
Reference 9: http://www.xbrl.org/2003/role/disclosureRef
-Topic 740
-Name Accounting Standards Codification
-Publisher FASB
-URI https://asc.fasb.org/740/tableOfContent
Reference 10: http://www.xbrl.org/2003/role/disclosureRef
-Topic 740
-SubTopic 10
-Name Accounting Standards Codification
-Section 50
-Paragraph 14
-Publisher FASB
-URI https://asc.fasb.org/1943274/2147482685/740-10-50-14
Reference 11: http://www.xbrl.org/2003/role/disclosureRef
-Topic 740
-SubTopic 10
-Name Accounting Standards Codification
-Section 50
-Paragraph 21
-Publisher FASB
-URI https://asc.fasb.org/1943274/2147482685/740-10-50-21
Reference 12: http://www.xbrl.org/2003/role/disclosureRef
-Topic 740
-SubTopic 10
-Name Accounting Standards Codification
-Section 50
-Paragraph 17
-Subparagraph (b)
-Publisher FASB
-URI https://asc.fasb.org/1943274/2147482685/740-10-50-17
Reference 13: http://www.xbrl.org/2003/role/disclosureRef
-Topic 740
-SubTopic 10
-Name Accounting Standards Codification
-Section S99
-Paragraph 2
-Subparagraph (SAB Topic 11.C)
-Publisher FASB
-URI https://asc.fasb.org/1943274/2147479360/740-10-S99-2
Reference 14: http://www.xbrl.org/2003/role/disclosureRef
-Topic 740
-SubTopic 30
-Name Accounting Standards Codification
-Section 50
-Paragraph 2
-Subparagraph (a)
-Publisher FASB
-URI https://asc.fasb.org/1943274/2147482603/740-30-50-2
| Name: |
us-gaap_IncomeTaxDisclosureTextBlock |
| Namespace Prefix: |
us-gaap_ |
| Data Type: |
dtr-types:textBlockItemType |
| Balance Type: |
na |
| Period Type: |
duration |
|
v3.25.0.1
Shareholders' Equity
|
12 Months Ended |
Dec. 31, 2024 |
|---|
| Equity [Abstract] |
|
| Shareholders' Equity |
Shareholders’ Equity We have had a stock repurchase program in place since 2008. As of December 31, 2024, we had $1,028,342 authorized for repurchasing shares of our common stock, which includes $300,000 in additional authorizations approved by our Board of Directors on December 17, 2024. Prior to June 26, 2024, shares we repurchased were held in treasury stock until they were reissued or retired at the discretion of our Board of Directors. Beginning on June 26, 2024, all shares of common stock that we repurchase are immediately retired and not held as treasury stock. During the second quarter of 2024, we retired 507,166 shares of its common stock that were being held as treasury stock. The retirement resulted in a reduction of $5,194,196 in treasury stock, $5,072 in the par value of common stock, and $5,189,124 in retained earnings. During the years ended December 31, 2024, 2023 and 2022, shares of common stock at a total cost of $74,229, $69,146, and $98,970, respectively, were netted and surrendered as payment for minimum statutory withholding obligations in connection with the vesting of outstanding stock awards. Shares surrendered by the participants in accordance with the applicable award agreements and plan are deemed repurchased by us but are not part of publicly announced share repurchase programs.
|
| X |
- References
+ Details
| Name: |
us-gaap_EquityAbstract |
| Namespace Prefix: |
us-gaap_ |
| Data Type: |
xbrli:stringItemType |
| Balance Type: |
na |
| Period Type: |
duration |
|
| X |
- DefinitionThe entire disclosure for equity. Reference 1: http://www.xbrl.org/2003/role/disclosureRef
-Topic 505
-SubTopic 10
-Name Accounting Standards Codification
-Section 50
-Paragraph 13
-Subparagraph (b)
-Publisher FASB
-URI https://asc.fasb.org/1943274/2147481112/505-10-50-13
Reference 2: http://www.xbrl.org/2003/role/disclosureRef
-Topic 505
-SubTopic 10
-Name Accounting Standards Codification
-Section 50
-Paragraph 13
-Subparagraph (h)
-Publisher FASB
-URI https://asc.fasb.org/1943274/2147481112/505-10-50-13
Reference 3: http://www.xbrl.org/2003/role/disclosureRef
-Topic 505
-SubTopic 10
-Name Accounting Standards Codification
-Section 50
-Paragraph 14
-Subparagraph (b)
-Publisher FASB
-URI https://asc.fasb.org/1943274/2147481112/505-10-50-14
Reference 4: http://www.xbrl.org/2003/role/disclosureRef
-Topic 946
-SubTopic 235
-Name Accounting Standards Codification
-Section 50
-Paragraph 2
-Subparagraph (a)
-Publisher FASB
-URI https://asc.fasb.org/1943274/2147477968/946-235-50-2
Reference 5: http://www.xbrl.org/2003/role/disclosureRef
-Topic 946
-SubTopic 235
-Name Accounting Standards Codification
-Section 50
-Paragraph 2
-Subparagraph (d)
-Publisher FASB
-URI https://asc.fasb.org/1943274/2147477968/946-235-50-2
Reference 6: http://www.xbrl.org/2003/role/disclosureRef
-Topic 946
-SubTopic 505
-Name Accounting Standards Codification
-Section 50
-Paragraph 6
-Publisher FASB
-URI https://asc.fasb.org/1943274/2147478448/946-505-50-6
Reference 7: http://www.xbrl.org/2003/role/disclosureRef
-Topic 815
-SubTopic 40
-Name Accounting Standards Codification
-Section 50
-Paragraph 6
-Subparagraph (a)
-Publisher FASB
-URI https://asc.fasb.org/1943274/2147480237/815-40-50-6
Reference 8: http://www.xbrl.org/2003/role/disclosureRef
-Topic 505
-SubTopic 10
-Name Accounting Standards Codification
-Section S99
-Paragraph 1
-Subparagraph (SX 210.3-04)
-Publisher FASB
-URI https://asc.fasb.org/1943274/2147480008/505-10-S99-1
Reference 9: http://www.xbrl.org/2003/role/disclosureRef
-Topic 235
-SubTopic 10
-Name Accounting Standards Codification
-Section S99
-Paragraph 1
-Subparagraph (SX 210.4-08(e)(1))
-Publisher FASB
-URI https://asc.fasb.org/1943274/2147480678/235-10-S99-1
Reference 10: http://fasb.org/us-gaap/role/ref/legacyRef
-Topic 505
-Name Accounting Standards Codification
-Publisher FASB
-URI https://asc.fasb.org/505/tableOfContent
Reference 11: http://www.xbrl.org/2003/role/disclosureRef
-Topic 505
-SubTopic 10
-Name Accounting Standards Codification
-Section 50
-Paragraph 13
-Publisher FASB
-URI https://asc.fasb.org/1943274/2147481112/505-10-50-13
Reference 12: http://www.xbrl.org/2003/role/disclosureRef
-Topic 505
-SubTopic 10
-Name Accounting Standards Codification
-Section 50
-Paragraph 13
-Subparagraph (g)
-Publisher FASB
-URI https://asc.fasb.org/1943274/2147481112/505-10-50-13
Reference 13: http://www.xbrl.org/2003/role/disclosureRef
-Topic 505
-SubTopic 10
-Name Accounting Standards Codification
-Section 50
-Paragraph 13
-Subparagraph (i)
-Publisher FASB
-URI https://asc.fasb.org/1943274/2147481112/505-10-50-13
Reference 14: http://www.xbrl.org/2003/role/disclosureRef
-Topic 505
-SubTopic 10
-Name Accounting Standards Codification
-Section 50
-Paragraph 14
-Subparagraph (a)
-Publisher FASB
-URI https://asc.fasb.org/1943274/2147481112/505-10-50-14
Reference 15: http://www.xbrl.org/2003/role/disclosureRef
-Topic 505
-SubTopic 10
-Name Accounting Standards Codification
-Section 50
-Paragraph 14
-Subparagraph (c)
-Publisher FASB
-URI https://asc.fasb.org/1943274/2147481112/505-10-50-14
Reference 16: http://www.xbrl.org/2003/role/disclosureRef
-Topic 505
-SubTopic 10
-Name Accounting Standards Codification
-Section 50
-Paragraph 16
-Subparagraph (b)
-Publisher FASB
-URI https://asc.fasb.org/1943274/2147481112/505-10-50-16
Reference 17: http://www.xbrl.org/2003/role/disclosureRef
-Topic 505
-SubTopic 10
-Name Accounting Standards Codification
-Section 50
-Paragraph 18
-Subparagraph (a)
-Publisher FASB
-URI https://asc.fasb.org/1943274/2147481112/505-10-50-18
Reference 18: http://www.xbrl.org/2003/role/disclosureRef
-Topic 505
-SubTopic 10
-Name Accounting Standards Codification
-Section 50
-Paragraph 18
-Subparagraph (b)
-Publisher FASB
-URI https://asc.fasb.org/1943274/2147481112/505-10-50-18
Reference 19: http://www.xbrl.org/2003/role/disclosureRef
-Topic 505
-SubTopic 10
-Name Accounting Standards Codification
-Section 50
-Paragraph 18
-Subparagraph (d)
-Publisher FASB
-URI https://asc.fasb.org/1943274/2147481112/505-10-50-18
| Name: |
us-gaap_StockholdersEquityNoteDisclosureTextBlock |
| Namespace Prefix: |
us-gaap_ |
| Data Type: |
dtr-types:textBlockItemType |
| Balance Type: |
na |
| Period Type: |
duration |
|
v3.25.0.1
Stock-Based Compensation and Employee Benefit Plans
|
12 Months Ended |
Dec. 31, 2024 |
|---|
| Share-Based Payment Arrangement [Abstract] |
|
| Stock-Based Compensation And Employee Benefit Plans |
Stock-Based Compensation and Employee Benefit Plans Pursuant to the 2022 Stock Incentive Plan, we grant stock options, SOSARs, RSUs, or PSUs to employees and non-employee directors. We issue shares of common stock upon the exercise of stock options and SOSARs, and the vesting of RSUs and PSUs. We also have an employee stock purchase plan (“ESPP”), 401(k) Defined Contribution Plan, and a Deferred Compensation Plan. Stock-Based Compensation Under the 2022 Stock Incentive Plan, 121,571 shares of common stock have been authorized and reserved for issuance to eligible participants, of which 105,569 shares were authorized for issuance but not issued or subject to outstanding awards as of December 31, 2024. For purposes of calculating the available shares remaining, each share issuable pursuant to outstanding full value awards, such as RSUs and PSUs, count as two shares, and each share underlying a stock option or SOSAR count as one share. On August 31, 2024 our now former CEO terminated employment with the company and forfeited all of his unvested equity awards, resulting in a reversal of expense of $27,863. In response to the CEO departure, we granted retention RSUs to key executives. These awards have various vesting terms, and will vest over one, two or three years. Total expense recognized for the retention RSUs for the year ended December 31, 2024 was $17,080. The impact of the CEO forfeiture and employee retention awards are reflected in the tables below. Total stock-based compensation expense was as follows: | | | | | | | | | | | | | | | | | | | | Year ended December 31, | | | 2024 | | 2023 | | 2022 | | Stock-based compensation | $ | 134,635 | | $ | 126,686 | | $ | 99,821 | | Stock-based compensation, net of income taxes | $ | 109,996 | | $ | 107,210 | | $ | 84,928 | | Total capitalized stock-based compensation included in leasehold improvements, property and equipment, net on the consolidated balance sheets | $ | 2,905 | | $ | 2,670 | | $ | 1,791 | | Excess tax benefit on stock-based compensation recognized in provision for income taxes on the consolidated statements of income and comprehensive income | $ | 23,419 | | $ | 25,437 | | $ | 24,689 |
SOSARs A summary of SOSAR activity was as follows (in thousands, except years and per share data): | | | | | | | | | | | | | | | | | | | | | | | | | Shares | | Weighted-Average Exercise Price per
Share | | Weighted-Average Remaining
Contractual Life (Years) | | Aggregate Intrinsic Value | | Outstanding, January 1, 2024 | 14,738 | | $ | 26.05 | | 4.4 | | $ | 290,156 | | Granted | 2,533 | | 53.04 | | | | | | Exercised | (5,077) | | 21.83 | | | | | | Forfeited | (1,780) | | 38.56 | | | | | | Outstanding, December 31, 2024 | 10,414 | | 32.53 | | 4.2 | | 289,373 | | Exercisable, December 31, 2024 | 4,152 | | 22.88 | | 2.6 | | 155,371 | | Vested and expected to vest, December 31, 2024 | 9,997 | | 32.07 | | 4.1 | | 282,450 |
The total intrinsic value of SOSARs exercised during the years ended December 31, 2024, 2023 and 2022, was $177,274, $142,830, and $77,124, respectively. Unrecognized stock-based compensation expense for SOSARs as of December 31, 2024 was $22,865 and is expected to be recognized over a weighted-average period of 1.5 years. SOSARs expire 7 years after the day they were granted. The weighted-average assumptions utilized in the Black-Scholes option-pricing model to estimate the fair value of SOSARs granted each year were as follows: | | | | | | | | | | | | | | | | | | | 2024 | | 2023 | | 2022 | | Risk-free interest rate | 4.2% | | 4.1% | | 2.1% | | Expected life (years) | 3.6 | | 3.6 | | 3.6 | | Expected dividend yield | 0.0% | | 0.0% | | 0.0% | | Volatility | 35.7% | | 36.4% | | 36.0% | | Weighted-average Black-Scholes fair value per share at date of grant | $ | 16.98 | | $ | 10.60 | | $ | 9.13 |
The risk-free interest rate is based on U.S. Treasury rates for instruments with similar terms, and the expected life assumption is based on our historical data. We have not paid dividends to date and do not plan to pay dividends in the near future. The volatility assumption is based on our historical data and implied volatility. Non-Vested Stock Awards (RSUs) A summary of RSU award activity was as follows (in thousands, except per share data): | | | | | | | | | | | | | Shares | | Weighted-Average Grant Date Fair Value
per Share | | Outstanding, January 1, 2024 | 3,002 | | $ | 32.08 | | | Granted | 2,615 | | 53.67 | | | Vested | (948) | | 31.96 | | | Forfeited | (322) | | 39.58 | | | Outstanding, December 31, 2024 | 4,347 | | 44.54 | | | Vested and expected to vest, December 31, 2024 | 3,919 | | 44.21 | |
The weighted-average grant date fair value per RSU granted during the years ended December 31, 2023 and 2022, was $33.32 and $31.19, respectively. Unrecognized stock-based compensation expense for non-vested RSU stock awards we have determined are probable of vesting was $88,093 as of December 31, 2024, and is expected to be recognized over a weighted-average period of 1.3 years. The fair value of shares earned as of the vesting date during the years ended December 31, 2024, 2023 and 2022, was $49,672, $39,464, and $33,959, respectively. Non-Vested Performance Stock Awards (PSUs) A summary of PSU award activity was as follows (in thousands, except per share data): | | | | | | | | | | | | | Shares | | Weighted-Average Grant Date Fair
Value per Share | | Outstanding, January 1, 2024 | 2,794 | | $ | 31.24 | | Granted | 866 | | 52.90 | | Vested | (777) | | 29.59 | | Forfeited | (838) | | 37.89 | | Outstanding, December 31, 2024 | 2,045 | | 38.32 | | Vested and expected to vest, December 31, 2024* | 3,649 | | 37.78 |
*The vested and expected to vest total above represents outstanding base PSUs, adjusted for expected payout amounts in line with current and future estimated performance levels. The weighted-average fair value per PSU granted during the years ended December 31, 2023 and 2022, was $32.14 and $31.39, respectively. The unrecognized stock-based compensation expense for non-vested PSU stock awards we have determined are probable of vesting was $50,157 as of December 31, 2024, and is expected to be recognized over a weighted-average period of 2.2 years. The fair value of shares earned as of the vesting date during the years ended December 31, 2024, 2023 and 2022, was $113,181, $110,794, and $177,293, respectively. During the years ended December 31, 2024 and December 31, 2023, we awarded performance share awards that are subject to service, market, and performance vesting conditions. The quantity of shares that vest will range from 0% to 300% of the targeted number of shares based on performance factors related to restaurant cash flow dollars earned over three-year periods beginning on January 1, 2024 and January 1, 2023, and gross new restaurant openings over the same three-year periods. If the defined minimum targets are not met, then no shares will vest. Further, in no event may more than 100% of the target number of PSUs vest if our 3-year total shareholder return is below the 25th percentile of the constituent companies comprising the S&P 500 on the days of the grants. During the year ended December 31, 2022, we awarded performance share awards that are subject to service, market, and performance vesting conditions. The quantity of shares that vest will range from 0% to 300% of the targeted number of shares based on performance factors related to restaurant cash flow dollars earned over a three-year period beginning on January 1, 2022. If the defined minimum targets are not met, then no shares will vest. Further, in no event may more than 100% of the target number of PSUs vest if our 3-year total shareholder return is below the 25th percentile of the constituent companies comprising the S&P 500 on the day of the grant. Employee Stock Purchase Plan We also offer an ESPP. Employees become eligible to participate in the program after one year of service with Chipotle and may contribute up to 15% of their earnings, subject to an annual maximum dollar amount. The ESPP provides a quarterly offering period to purchase our common stock at a price of 92.5% of the lower of the fair market value on the first and last trading days of each offering period. A total of 12,500 shares were authorized for issuance within the ESPP, of which 12,311 were available for issuance as of December 31, 2024. For the years ended December 31, 2024, 2023 and 2022, the number of shares issued under the ESPP were 78, 79, and 32, respectively. Employee Benefit Plans 401(k) Defined Contribution Plan We maintain the Chipotle Mexican Grill 401(k) Plan (“401(k) Plan”) for eligible U.S.-based employees. The 401(k) Plan allows participants to make cash contributions from payroll deductions. Employees become eligible to receive matching contributions after one year, and at least 1,000 hours, of service with Chipotle. We match 100% of the first 3% of pay contributed by each eligible employee and 50% on the next 2% of pay contributed each pay period (with an annual true-up) through cash contributions. For the years ended December 31, 2024, 2023 and 2022, matching contributions totaled approximately $16,523, $13,821, and $12,923, respectively, and are included in general and administrative expenses and labor dependent on employee classification on the consolidated statements of income and comprehensive income. Certain subsidiaries outside the U.S. also offer other similar benefits and are immaterial to the consolidated statements of income and comprehensive income. Deferred Compensation Plan We also maintain the Chipotle Mexican Grill, Inc. Supplemental Deferred Investment Plan (the “Deferred Plan”) for eligible employees. The Deferred Plan is a non-qualified plan that allows participants to make tax-deferred contributions that cannot be made under the 401(k) Plan because of Internal Revenue Service limitations. Participants’ earnings on contributions made to the Deferred Plan fluctuate with the actual earnings and losses of a variety of available investment choices selected by the participant. Total obligations under the Deferred Plan as of December 31, 2024 and 2023 were $36,509 and $27,178, respectively, and are included in other liabilities on the consolidated balance sheets and were fully funded as of December 31, 2024. We match 100% of the first 3% of pay contributed by each eligible employee and 50% on the next 2% of pay contributed once the 401(k) contribution limits are reached. The following table summarizes estimated current and long-term material cash requirements for our deferred compensation plan as of December 31, 2024: | | | | | | | | | | | | | | | | | | | | | | | | | | | | | | | Payments Due by Fiscal Year | | Total | | 2025 | | 2026-2027 | | 2028-2029 | | Thereafter | Deferred compensation(1) | $ | 36,509 | | $ | 7,172 | | $ | 8,763 | | $ | 8,055 | | $ | 12,518 |
(1)Includes scheduled payments from our deferred compensation plan where payment dates are determinable for employed participants in accordance with the account’s election, and the assumption that active participants will retire at the age of 65 and begin distributions from their accounts at that time. This does not include future contributions, investment earnings, or future participants. Timing and amounts of payments may vary significantly.
|
| X |
- DefinitionThe entire disclosure for share-based payment arrangement. Reference 1: http://www.xbrl.org/2003/role/exampleRef
-Topic 718
-SubTopic 10
-Name Accounting Standards Codification
-Section 50
-Paragraph 2
-Subparagraph (a)(1)
-Publisher FASB
-URI https://asc.fasb.org/1943274/2147480429/718-10-50-2
Reference 2: http://www.xbrl.org/2003/role/disclosureRef
-Topic 718
-Name Accounting Standards Codification
-Publisher FASB
-URI https://asc.fasb.org/718/tableOfContent
Reference 3: http://www.xbrl.org/2003/role/disclosureRef
-Topic 718
-SubTopic 10
-Name Accounting Standards Codification
-Section 50
-Paragraph 2
-Subparagraph (a)
-Publisher FASB
-URI https://asc.fasb.org/1943274/2147480429/718-10-50-2
Reference 4: http://www.xbrl.org/2003/role/disclosureRef
-Topic 718
-SubTopic 10
-Name Accounting Standards Codification
-Section 50
-Paragraph 2
-Subparagraph (h)(2)
-Publisher FASB
-URI https://asc.fasb.org/1943274/2147480429/718-10-50-2
Reference 5: http://www.xbrl.org/2003/role/disclosureRef
-Topic 718
-SubTopic 10
-Name Accounting Standards Codification
-Section 50
-Paragraph 2
-Subparagraph (h)(2)(i)
-Publisher FASB
-URI https://asc.fasb.org/1943274/2147480429/718-10-50-2
Reference 6: http://www.xbrl.org/2003/role/disclosureRef
-Topic 718
-SubTopic 10
-Name Accounting Standards Codification
-Section 50
-Paragraph 2
-Subparagraph (l)
-Publisher FASB
-URI https://asc.fasb.org/1943274/2147480429/718-10-50-2
| Name: |
us-gaap_DisclosureOfCompensationRelatedCostsShareBasedPaymentsTextBlock |
| Namespace Prefix: |
us-gaap_ |
| Data Type: |
dtr-types:textBlockItemType |
| Balance Type: |
na |
| Period Type: |
duration |
|
v3.25.0.1
Leases
|
12 Months Ended |
Dec. 31, 2024 |
|---|
| Leases [Abstract] |
|
| Leases |
Leases The weighted-average remaining lease term and discount rate were as follows: | | | | | | | | | | | | | December 31, | | 2024 | | 2023 | | Weighted-average remaining lease term (years) | 13.9 | | 13.7 | | Weighted-average discount rate | 5.30 | % | | 5.10 | % |
The components of lease cost were as follows: | | | | | | | | | | | | | | | | | | | | | | | Year ended December 31, | | Classification | 2024 | | 2023 | | 2022 | | Operating lease cost | Occupancy, Other operating costs, General and administrative expenses and Pre-opening costs | $ | 486,598 | | $ | 436,313 | | $ | 397,112 | | Short-term lease cost | Other operating costs | 572 | | 519 | | 633 | | Variable lease cost | Occupancy, Other operating costs, General and administrative expenses and Pre-opening costs | 120,948 | | 111,896 | | 102,636 | | Sublease income | General and administrative expenses | (3,559) | | | (4,765) | | | (5,444) | | | Total lease cost | | $ | 604,559 | | $ | 543,963 | | $ | 494,937 |
Supplemental disclosures of cash flow information related to leases were as follows: | | | | | | | | | | | | | | | | | | | | Year ended December 31, | | | 2024 | | 2023 | | 2022 | | Cash paid for operating lease liabilities | $ | 466,171 | | $ | 421,591 | | $ | 386,238 | | Operating lease assets obtained in exchange for operating lease liabilities | $ | 692,684 | | $ | 521,759 | | $ | 425,243 | | Derecognition of operating lease assets due to terminations or impairment | $ | 6,899 | | $ | 6,862 | | $ | 14,718 |
Maturities of lease liabilities were as follows as of December 31, 2024: | | | | | | | Operating Leases | | 2025 | $ | 464,795 | | 2026 | 507,341 | | 2027 | 499,428 | | 2028 | 484,473 | | 2029 | 467,981 | | Thereafter | 4,133,853 | | Total lease payments | 6,557,871 | | Less: imputed interest | 2,017,253 | | Operating lease liabilities (Current and Long-Term) | $ | 4,540,618 |
As of December 31, 2024, the total lease payments include $2,759,141 related to options to extend lease terms that are reasonably certain of being exercised and exclude approximately $646,462 of legally binding lease payments for leases signed but not yet commenced and $11,419 of future sublease income.
|
| X |
- References
+ Details
| Name: |
us-gaap_LeasesAbstract |
| Namespace Prefix: |
us-gaap_ |
| Data Type: |
xbrli:stringItemType |
| Balance Type: |
na |
| Period Type: |
duration |
|
| X |
- DefinitionThe entire disclosure for operating leases of lessee. Includes, but is not limited to, description of operating lease and maturity analysis of operating lease liability. Reference 1: http://www.xbrl.org/2003/role/disclosureRef
-Topic 842
-SubTopic 20
-Name Accounting Standards Codification
-Publisher FASB
-URI https://asc.fasb.org/842-20/tableOfContent
| Name: |
us-gaap_LesseeOperatingLeasesTextBlock |
| Namespace Prefix: |
us-gaap_ |
| Data Type: |
dtr-types:textBlockItemType |
| Balance Type: |
na |
| Period Type: |
duration |
|
v3.25.0.1
Earnings Per Share
|
12 Months Ended |
Dec. 31, 2024 |
|---|
| Earnings Per Share [Abstract] |
|
| Earnings Per Share |
Earnings Per Share The following table sets forth the computations of basic and diluted earnings per share: | | | | | | | | | | | | | | | | | | | | Year ended December 31, | | | 2024 | | 2023 | | 2022 | | Net income | $ | 1,534,110 | | $ | 1,228,737 | | $ | 899,101 | | Shares: | | | | | | | Weighted-average number of common shares outstanding (for basic calculation) | 1,368,343 | | 1,377,768 | | 1,392,543 | | Dilutive stock awards | 8,212 | | 7,732 | | 10,534 | | Weighted-average number of common shares outstanding (for diluted calculation) | 1,376,555 | | 1,385,500 | | 1,403,077 | | Basic earnings per share | $ | 1.12 | | $ | 0.89 | | $ | 0.65 | | Diluted earnings per share | $ | 1.11 | | $ | 0.89 | | $ | 0.64 |
The following stock awards were excluded from the calculation of diluted earnings per share: | | | | | | | | | | | | | | | | | | | | Year ended December 31, | | | 2024 | | 2023 | | 2022 | | Stock awards subject to performance conditions | 2,179 | | 2,517 | | 2,701 | | Stock awards that were antidilutive | 2,210 | | 3,565 | | 8,149 | | Total stock awards excluded from diluted earnings per share | 4,389 | | 6,082 | | 10,850 |
|
| X |
- References
+ Details
| Name: |
us-gaap_EarningsPerShareAbstract |
| Namespace Prefix: |
us-gaap_ |
| Data Type: |
xbrli:stringItemType |
| Balance Type: |
na |
| Period Type: |
duration |
|
| X |
- DefinitionThe entire disclosure for earnings per share. Reference 1: http://www.xbrl.org/2003/role/disclosureRef
-Topic 260
-SubTopic 10
-Name Accounting Standards Codification
-Section 50
-Paragraph 1
-Subparagraph (c)
-Publisher FASB
-URI https://asc.fasb.org/1943274/2147482662/260-10-50-1
Reference 2: http://www.xbrl.org/2003/role/disclosureRef
-Topic 260
-Name Accounting Standards Codification
-Publisher FASB
-URI https://asc.fasb.org/260/tableOfContent
Reference 3: http://www.xbrl.org/2003/role/disclosureRef
-Topic 260
-SubTopic 10
-Name Accounting Standards Codification
-Section 50
-Paragraph 2
-Publisher FASB
-URI https://asc.fasb.org/1943274/2147482662/260-10-50-2
Reference 4: http://www.xbrl.org/2003/role/disclosureRef
-Topic 260
-SubTopic 10
-Name Accounting Standards Codification
-Section 50
-Paragraph 3
-Publisher FASB
-URI https://asc.fasb.org/1943274/2147482662/260-10-50-3
| Name: |
us-gaap_EarningsPerShareTextBlock |
| Namespace Prefix: |
us-gaap_ |
| Data Type: |
dtr-types:textBlockItemType |
| Balance Type: |
na |
| Period Type: |
duration |
|
v3.25.0.1
Commitments and Contingencies
|
12 Months Ended |
Dec. 31, 2024 |
|---|
| Commitments and Contingencies Disclosure [Abstract] |
|
| Commitments and Contingencies |
Commitments and Contingencies Purchase Obligations We enter into various purchase obligations in the ordinary course of business, generally of a short-term nature. Those that are binding primarily relate to commitments for food purchases and supplies, capital projects, corporate assets, information technology, marketing initiatives and corporate sponsorships, and other miscellaneous items. Litigation We are involved in various claims and legal actions, such as wage and hour, wrongful termination and other employment-related claims, slip and fall and other personal injury claims, advertising and consumer claims, privacy claims, and lease, construction and other commercial disputes, that arise in the ordinary course of business, some of which may be covered by insurance. The outcomes of these actions are not predictable, but we do not believe that the ultimate resolution of any pending or threatened actions of these types will have a material adverse effect on our financial position, results of operations, liquidity, or capital resources. However, if there is a significant increase in the number of these claims, or if we incur greater liabilities than we currently anticipate under one or more claims, it could materially and adversely affect our business, financial condition, results of operations and cash flows. Shareholder Actions On November 11, 2024, Michael Stradford filed a complaint in the U.S. District Court for the Central District of California on behalf of a purported class of purchasers of shares of Chipotle common stock between February 8, 2024 and October 29, 2024. The complaint purports to state claims against Chipotle, former Chief Executive Officer Brian Niccol, and President and Chief Strategy Officer Jack Hartung, who served during the majority of the claimed class period as Chief Financial and Administrative Officer. The complaint asserts claims arising under Sections 10(b) and 20(a) of the Exchange Act and related rules and regulations, based on Chipotle’s alleged failure during the claimed class period to disclose that (1) Chipotle’s entrée portion sizes were inconsistent and allegedly left many guests dissatisfied; (2) in order to address the issue and retain guest loyalty, Chipotle would have to ensure more generous portion sizes, which would increase costs; and (3) as a result, the defendants’ statements about Chipotle's business, operations, and prospects were materially false and misleading. The complaint asserts that as a result, the market price of Chipotle’s stock was artificially inflated during the claimed class period. The complaint seeks damages on behalf of the purported class in an unspecified amount, interest, an award of reasonable costs and attorneys’ fees, and other relief as determined appropriate by the court. On December 10, 2024, Anand Roy filed a shareholder derivative action in the U.S. District Court for the Central District of California alleging that the defendants, members of Chipotle’s Board of Directors and President and Chief Strategy Officer breached their fiduciary duties by making or allowing Chipotle to make allegedly false and misleading statements substantially the same as those alleged in the Stradford matter described above. The complaint further alleges that the defendants breached their fiduciary duties by causing Chipotle to repurchase stock at inflated prices and by engaging in improper insider sales of Chipotle stock. On December 17, 2024, Daniel Rodriguez filed a shareholder derivative action against the same defendants in the same court, making allegations substantially the same as those in the Roy complaint. Each of these actions purports to state a claim for damages on behalf of Chipotle and is based on statements in the company’s SEC filings and related public disclosures, and seeks damages, including punitive damages, in an unspecified amount as well as interest, an award of reasonable costs and attorneys’ fees, and other relief as determined appropriate by the court. On January 23, 2025, the Roy and Rodriguez actions were consolidated into a single derivative lawsuit captioned In re Chipotle Mexican Grill, Inc. Stockholder Derivative Litigation. Chipotle intends to defend all of these cases vigorously, but it is not possible at this time to reasonably estimate the outcome of or any potential liability from these cases. Accrual for Estimated Liability In relation to various legal matters, we had an accrued legal liability balance of $19,465 and $7,640 included within accrued liabilities on the consolidated balance sheets as of December 31, 2024 and 2023, respectively.
|
| X |
- References
+ Details
| Name: |
us-gaap_CommitmentsAndContingenciesDisclosureAbstract |
| Namespace Prefix: |
us-gaap_ |
| Data Type: |
xbrli:stringItemType |
| Balance Type: |
na |
| Period Type: |
duration |
|
| X |
- DefinitionThe entire disclosure for commitments and contingencies. Reference 1: http://www.xbrl.org/2009/role/commonPracticeRef
-Topic 405
-SubTopic 30
-Name Accounting Standards Codification
-Publisher FASB
-URI https://asc.fasb.org/405-30/tableOfContent
Reference 2: http://www.xbrl.org/2003/role/disclosureRef
-Topic 440
-SubTopic 10
-Name Accounting Standards Codification
-Section 50
-Paragraph 4
-Subparagraph (a)
-Publisher FASB
-URI https://asc.fasb.org/1943274/2147482648/440-10-50-4
Reference 3: http://www.xbrl.org/2009/role/commonPracticeRef
-Topic 450
-Name Accounting Standards Codification
-Publisher FASB
-URI https://asc.fasb.org/450/tableOfContent
Reference 4: http://www.xbrl.org/2003/role/disclosureRef
-Topic 954
-SubTopic 440
-Name Accounting Standards Codification
-Section 50
-Paragraph 1
-Subparagraph (a)
-Publisher FASB
-URI https://asc.fasb.org/1943274/2147478522/954-440-50-1
Reference 5: http://www.xbrl.org/2003/role/disclosureRef
-Topic 440
-SubTopic 10
-Name Accounting Standards Codification
-Section 50
-Paragraph 4
-Subparagraph (c)
-Publisher FASB
-URI https://asc.fasb.org/1943274/2147482648/440-10-50-4
Reference 6: http://fasb.org/us-gaap/role/ref/legacyRef
-Topic 440
-Name Accounting Standards Codification
-Publisher FASB
-URI https://asc.fasb.org/440/tableOfContent
| Name: |
us-gaap_CommitmentsAndContingenciesDisclosureTextBlock |
| Namespace Prefix: |
us-gaap_ |
| Data Type: |
dtr-types:textBlockItemType |
| Balance Type: |
na |
| Period Type: |
duration |
|
v3.25.0.1
Debt
|
12 Months Ended |
Dec. 31, 2024 |
|---|
| Debt Disclosure [Abstract] |
|
| Debt |
Debt As of December 31, 2024, we had a $500,000 revolving credit facility with JPMorgan Chase Bank (“JPMorgan”) as administrative agent. Borrowings on the credit facility bear interest at a rate equal to the Secured Overnight Financing Rate (“SOFR”) plus 1.475%, which is subject to increase due to changes in our total leverage ratio as defined in the credit agreement. We are also obligated to pay a commitment fee of 0.175% per year for unused amounts under the credit facility, which also may increase due to changes in our total leverage ratio. Further, we are subject to certain covenants defined in the credit agreement, which include maintaining a total leverage ratio of less than 3.0x, maintaining a consolidated fixed charge coverage ratio of greater than 1.5x, and limiting us from incurring additional indebtedness in certain circumstances. We had no outstanding borrowings under the credit facility and were in compliance with all covenants as of December 31, 2024 and December 31, 2023, respectively.
|
| X |
- References
+ Details
| Name: |
us-gaap_DebtDisclosureAbstract |
| Namespace Prefix: |
us-gaap_ |
| Data Type: |
xbrli:stringItemType |
| Balance Type: |
na |
| Period Type: |
duration |
|
| X |
- DefinitionThe entire disclosure for information about short-term and long-term debt arrangements, which includes amounts of borrowings under each line of credit, note payable, commercial paper issue, bonds indenture, debenture issue, own-share lending arrangements and any other contractual agreement to repay funds, and about the underlying arrangements, rationale for a classification as long-term, including repayment terms, interest rates, collateral provided, restrictions on use of assets and activities, whether or not in compliance with debt covenants, and other matters important to users of the financial statements, such as the effects of refinancing and noncompliance with debt covenants. Reference 1: http://www.xbrl.org/2003/role/disclosureRef
-Topic 470
-SubTopic 10
-Name Accounting Standards Codification
-Section 50
-Paragraph 6
-Subparagraph (b)
-Publisher FASB
-URI https://asc.fasb.org/1943274/2147481544/470-10-50-6
Reference 2: http://www.xbrl.org/2003/role/disclosureRef
-Topic 470
-SubTopic 10
-Name Accounting Standards Codification
-Section 50
-Paragraph 6
-Subparagraph (a)
-Publisher FASB
-URI https://asc.fasb.org/1943274/2147481544/470-10-50-6
Reference 3: http://www.xbrl.org/2003/role/disclosureRef
-Topic 405
-SubTopic 40
-Name Accounting Standards Codification
-Section 50
-Paragraph 1
-Subparagraph (d)
-Publisher FASB
-URI https://asc.fasb.org/1943274/2147477092/405-40-50-1
Reference 4: http://www.xbrl.org/2003/role/disclosureRef
-Topic 405
-SubTopic 40
-Name Accounting Standards Codification
-Section 50
-Paragraph 1
-Subparagraph (a)(3)
-Publisher FASB
-URI https://asc.fasb.org/1943274/2147477092/405-40-50-1
Reference 5: http://www.xbrl.org/2003/role/disclosureRef
-Topic 405
-SubTopic 40
-Name Accounting Standards Codification
-Section 50
-Paragraph 1
-Subparagraph (a)(2)
-Publisher FASB
-URI https://asc.fasb.org/1943274/2147477092/405-40-50-1
Reference 6: http://www.xbrl.org/2003/role/disclosureRef
-Topic 405
-SubTopic 40
-Name Accounting Standards Codification
-Section 50
-Paragraph 1
-Subparagraph (a)(1)
-Publisher FASB
-URI https://asc.fasb.org/1943274/2147477092/405-40-50-1
Reference 7: http://www.xbrl.org/2003/role/disclosureRef
-Topic 405
-SubTopic 40
-Name Accounting Standards Codification
-Section 50
-Paragraph 1
-Subparagraph (a)
-Publisher FASB
-URI https://asc.fasb.org/1943274/2147477092/405-40-50-1
Reference 8: http://www.xbrl.org/2003/role/disclosureRef
-Topic 470
-SubTopic 20
-Name Accounting Standards Codification
-Section 50
-Paragraph 1B
-Subparagraph (h)
-Publisher FASB
-URI https://asc.fasb.org/1943274/2147481139/470-20-50-1B
Reference 9: http://www.xbrl.org/2003/role/disclosureRef
-Topic 235
-SubTopic 10
-Name Accounting Standards Codification
-Section S99
-Paragraph 1
-Subparagraph (SX 210.4-08(c))
-Publisher FASB
-URI https://asc.fasb.org/1943274/2147480678/235-10-S99-1
Reference 10: http://fasb.org/us-gaap/role/ref/legacyRef
-Topic 470
-Name Accounting Standards Codification
-Publisher FASB
-URI https://asc.fasb.org/470/tableOfContent
Reference 11: http://www.xbrl.org/2003/role/disclosureRef
-Topic 835
-SubTopic 30
-Name Accounting Standards Codification
-Section 45
-Paragraph 2
-Publisher FASB
-URI https://asc.fasb.org/1943274/2147482925/835-30-45-2
Reference 12: http://www.xbrl.org/2003/role/disclosureRef
-Topic 470
-SubTopic 20
-Name Accounting Standards Codification
-Section 50
-Paragraph 1B
-Publisher FASB
-URI https://asc.fasb.org/1943274/2147481139/470-20-50-1B
Reference 13: http://www.xbrl.org/2003/role/disclosureRef
-Topic 470
-SubTopic 20
-Name Accounting Standards Codification
-Section 50
-Paragraph 1B
-Subparagraph (g)
-Publisher FASB
-URI https://asc.fasb.org/1943274/2147481139/470-20-50-1B
Reference 14: http://www.xbrl.org/2003/role/disclosureRef
-Topic 470
-SubTopic 20
-Name Accounting Standards Codification
-Section 50
-Paragraph 1B
-Subparagraph (i)
-Publisher FASB
-URI https://asc.fasb.org/1943274/2147481139/470-20-50-1B
Reference 15: http://www.xbrl.org/2003/role/disclosureRef
-Topic 470
-SubTopic 20
-Name Accounting Standards Codification
-Section 50
-Paragraph 1C
-Subparagraph (a)
-Publisher FASB
-URI https://asc.fasb.org/1943274/2147481139/470-20-50-1C
Reference 16: http://www.xbrl.org/2003/role/disclosureRef
-Topic 470
-SubTopic 20
-Name Accounting Standards Codification
-Section 50
-Paragraph 1C
-Subparagraph (b)
-Publisher FASB
-URI https://asc.fasb.org/1943274/2147481139/470-20-50-1C
Reference 17: http://www.xbrl.org/2003/role/disclosureRef
-Topic 470
-SubTopic 20
-Name Accounting Standards Codification
-Section 50
-Paragraph 1C
-Subparagraph (c)
-Publisher FASB
-URI https://asc.fasb.org/1943274/2147481139/470-20-50-1C
Reference 18: http://www.xbrl.org/2003/role/disclosureRef
-Topic 470
-SubTopic 20
-Name Accounting Standards Codification
-Section 50
-Paragraph 1E
-Subparagraph (b)
-Publisher FASB
-URI https://asc.fasb.org/1943274/2147481139/470-20-50-1E
Reference 19: http://www.xbrl.org/2003/role/disclosureRef
-Topic 470
-SubTopic 20
-Name Accounting Standards Codification
-Section 50
-Paragraph 1I
-Subparagraph (a)
-Publisher FASB
-URI https://asc.fasb.org/1943274/2147481139/470-20-50-1I
Reference 20: http://www.xbrl.org/2003/role/disclosureRef
-Topic 470
-SubTopic 20
-Name Accounting Standards Codification
-Section 50
-Paragraph 1I
-Subparagraph (b)
-Publisher FASB
-URI https://asc.fasb.org/1943274/2147481139/470-20-50-1I
Reference 21: http://www.xbrl.org/2003/role/disclosureRef
-Topic 470
-SubTopic 20
-Name Accounting Standards Codification
-Section 50
-Paragraph 1I
-Subparagraph (d)
-Publisher FASB
-URI https://asc.fasb.org/1943274/2147481139/470-20-50-1I
| Name: |
us-gaap_DebtDisclosureTextBlock |
| Namespace Prefix: |
us-gaap_ |
| Data Type: |
dtr-types:textBlockItemType |
| Balance Type: |
na |
| Period Type: |
duration |
|
v3.25.0.1
Related Party Transactions
|
12 Months Ended |
Dec. 31, 2024 |
|---|
| Related Party Transactions [Abstract] |
|
| Related Party Transactions |
Related Party Transactions As of December 31, 2024, we owned approximately 13.8% of the common stock outstanding of Tractor. As we are a significant customer of Tractor and maintain board representation, we are accounting for our investment under the equity method. Accordingly, we have identified Tractor as a related party. We purchase product from the supplier for sale to guests in our restaurants. During the years ended December 31, 2024, 2023 and 2022, purchases from the supplier were $49,323, $43,555, and $37,015, respectively. We are an investor in Vebu Inc. (“Vebu”), a developer of restaurant automation technology. As we are a significant customer of Vebu and maintain board representation, we have determined that Vebu is a related party. Our investment, which is comprised of preferred shares, is accounted for as a non-marketable equity investment and is included within long-term investments on the consolidated balance sheet. During the years ended December 31, 2024, 2023 and 2022, purchases from Vebu were $957, $991, and $840, respectively.
|
| X |
- DefinitionThe entire disclosure for related party transactions. Examples of related party transactions include transactions between (a) a parent company and its subsidiary; (b) subsidiaries of a common parent; (c) and entity and its principal owners; and (d) affiliates. Reference 1: http://www.xbrl.org/2003/role/disclosureRef
-Topic 946
-SubTopic 20
-Name Accounting Standards Codification
-Section 50
-Paragraph 2
-Publisher FASB
-URI https://asc.fasb.org/1943274/2147480990/946-20-50-2
Reference 2: http://www.xbrl.org/2003/role/disclosureRef
-Topic 946
-SubTopic 20
-Name Accounting Standards Codification
-Section 50
-Paragraph 5
-Publisher FASB
-URI https://asc.fasb.org/1943274/2147480990/946-20-50-5
Reference 3: http://www.xbrl.org/2003/role/disclosureRef
-Topic 946
-SubTopic 20
-Name Accounting Standards Codification
-Section 50
-Paragraph 6
-Publisher FASB
-URI https://asc.fasb.org/1943274/2147480990/946-20-50-6
Reference 4: http://www.xbrl.org/2003/role/disclosureRef
-Topic 946
-SubTopic 235
-Name Accounting Standards Codification
-Section 50
-Paragraph 2
-Subparagraph (c)
-Publisher FASB
-URI https://asc.fasb.org/1943274/2147477968/946-235-50-2
Reference 5: http://www.xbrl.org/2003/role/disclosureRef
-Topic 946
-SubTopic 235
-Name Accounting Standards Codification
-Section 50
-Paragraph 2
-Subparagraph (e)
-Publisher FASB
-URI https://asc.fasb.org/1943274/2147477968/946-235-50-2
Reference 6: http://www.xbrl.org/2003/role/disclosureRef
-Topic 850
-SubTopic 10
-Name Accounting Standards Codification
-Section 50
-Paragraph 1
-Subparagraph (d)
-Publisher FASB
-URI https://asc.fasb.org/1943274/2147483326/850-10-50-1
Reference 7: http://www.xbrl.org/2003/role/disclosureRef
-Topic 946
-SubTopic 220
-Name Accounting Standards Codification
-Section S99
-Paragraph 1
-Subparagraph (SX 210.6-07(2)(g)(3))
-Publisher FASB
-URI https://asc.fasb.org/1943274/2147479134/946-220-S99-1
Reference 8: http://www.xbrl.org/2003/role/disclosureRef
-Topic 946
-SubTopic 220
-Name Accounting Standards Codification
-Section S99
-Paragraph 1
-Subparagraph (SX 210.6-07(2)(c))
-Publisher FASB
-URI https://asc.fasb.org/1943274/2147479134/946-220-S99-1
Reference 9: http://www.xbrl.org/2003/role/disclosureRef
-Topic 946
-SubTopic 220
-Name Accounting Standards Codification
-Section S99
-Paragraph 1
-Subparagraph (SX 210.6-07(2)(e))
-Publisher FASB
-URI https://asc.fasb.org/1943274/2147479134/946-220-S99-1
Reference 10: http://www.xbrl.org/2003/role/disclosureRef
-Topic 850
-Name Accounting Standards Codification
-Publisher FASB
-URI https://asc.fasb.org/850/tableOfContent
Reference 11: http://www.xbrl.org/2003/role/disclosureRef
-Topic 850
-SubTopic 10
-Name Accounting Standards Codification
-Section 50
-Paragraph 6
-Publisher FASB
-URI https://asc.fasb.org/1943274/2147483326/850-10-50-6
Reference 12: http://www.xbrl.org/2003/role/disclosureRef
-Topic 850
-SubTopic 10
-Name Accounting Standards Codification
-Section 50
-Paragraph 1
-Subparagraph (a)
-Publisher FASB
-URI https://asc.fasb.org/1943274/2147483326/850-10-50-1
Reference 13: http://www.xbrl.org/2003/role/disclosureRef
-Topic 850
-SubTopic 10
-Name Accounting Standards Codification
-Section 50
-Paragraph 1
-Subparagraph (b)
-Publisher FASB
-URI https://asc.fasb.org/1943274/2147483326/850-10-50-1
| Name: |
us-gaap_RelatedPartyTransactionsDisclosureTextBlock |
| Namespace Prefix: |
us-gaap_ |
| Data Type: |
dtr-types:textBlockItemType |
| Balance Type: |
na |
| Period Type: |
duration |
|
v3.25.0.1
Segment Reporting
|
12 Months Ended |
Dec. 31, 2024 |
|---|
| Segment Reporting [Abstract] |
|
| Segment Reporting |
Segment Reporting Segment information is prepared on the same basis that our CEO, who is our Chief Operating Decision Maker ("CODM"), manages our segments, evaluates financial results, and makes key operating decisions. We have one reportable operating segment: U.S. The U.S. reportable operating segment is comprised of all ten operating segments located in the United States, which we have aggregated to a single operating segment in consideration of the aggregation criteria set forth in ASC 280. All other operating segments, which comprise our operations in Canada, Europe and international licensed restaurants do not meet the quantitative thresholds for determining reportable segments. The U.S. reportable segment derives its revenue from company-owned restaurants located in the United States, which serve a relevant menu of burritos, burrito bowls (a burrito without the tortilla), quesadillas, tacos, and salads. No guest accounts for 10% or more of our revenues. The accounting policies of the U.S. reportable segment are the same as those described in Note 1. "Description of Business and Summary of Significant Accounting Policies". Our CODM uses income from operations to evaluate performance and make key operating decisions, such as deciding the rate at which we invest resources into the U.S segment versus other parts of the Company. The CODM is not provided asset information by reportable segment as asset information is provided to the CODM on a consolidated basis. The following tables present selected financial information with respect to our single reportable segment: | | | | | | | | | | | | | | | | | | | Year ended December 31, | | U.S. segment | 2024 | | 2023 | | 2022 | | Food and beverage revenue | $ | 11,045,450 | | $ | 9,652,976 | | $ | 8,439,674 | | Delivery service revenue | 66,282 | | 67,393 | | 76,536 | | U.S. segment total revenue | 11,111,732 | | 9,720,369 | | 8,516,210 | | | | | | | | Reconciliation: | | | | | | All other revenue(1) | 202,121 | | 151,280 | | 118,442 | | Total consolidated revenue | $ | 11,313,853 | | | $ | 9,871,649 | | | $ | 8,634,652 | |
| | | | | | | | | | | | | | | | | | | Year ended December 31, | | 2024 | | 2023 | | 2022 | | U.S. segment total revenue | $ | 11,111,732 | | $ | 9,720,369 | | $ | 8,516,210 | | | | | | | | Less: | | | | | | | Food, beverage and packaging | 3,299,295 | | 2,853,651 | | 2,556,657 | | Labor | 2,741,590 | | 2,402,964 | | 2,168,994 | | Occupancy | 548,688 | | 491,757 | | 450,684 | | Marketing | 283,053 | | 261,358 | | 248,319 | | Other operating costs, excluding marketing | 1,254,512 | | 1,141,850 | | 1,045,025 | | Depreciation and amortization | 300,513 | | 282,521 | | 253,904 | Other segment items(2) | 55,482 | | 64,150 | | 48,019 | | U.S. segment income from operations | 2,628,599 | | 2,222,118 | | 1,744,608 | | | | | | | | Reconciliation: | | | | | | Corporate and other unallocated expenses(3) | 709,426 | | 657,134 | | 574,572 | Other loss from operations(4) | (2,840) | | (7,171) | | (9,633) | | Interest and other income, net | 93,897 | | 62,693 | | 21,128 | | Total consolidated income before income taxes | $ | 2,010,230 | | | $ | 1,620,506 | | | $ | 1,181,531 | |
(1)All other revenue represents sales within our company-owned stores in Canada, Europe and royalty revenue from our international licensed restaurants. (2)Other segment items consist of pre-opening costs, impairment, closure costs, and asset disposals related to the U.S. segment. (3)Corporate and other unallocated expenses represent corporate overhead expenses that have not been allocated to any segment for reporting purposes including general and administrative expenses. (4)Amounts reflect the net loss from operations related to our operations in Canada, Europe and international licensed restaurants. The Company's long-lived tangible assets, including the Company's operating lease assets recognized on the consolidated balance sheets were located as follows: | | | | | | | | | | | | | December 31, | | 2024 | | 2023 | | United States | 6,247,406 | | | 5,637,230 | | | International | 142,847 | | | 111,356 | |
|
| X |
- References
+ Details
| Name: |
us-gaap_SegmentReportingAbstract |
| Namespace Prefix: |
us-gaap_ |
| Data Type: |
xbrli:stringItemType |
| Balance Type: |
na |
| Period Type: |
duration |
|
| X |
- DefinitionThe entire disclosure for reporting segments including data and tables. Reportable segments include those that meet any of the following quantitative thresholds a) it's reported revenue, including sales to external customers and intersegment sales or transfers is 10 percent or more of the combined revenue, internal and external, of all operating segments b) the absolute amount of its reported profit or loss is 10 percent or more of the greater, in absolute amount of 1) the combined reported profit of all operating segments that did not report a loss or 2) the combined reported loss of all operating segments that did report a loss c) its assets are 10 percent or more of the combined assets of all operating segments. Reference 1: http://www.xbrl.org/2003/role/exampleRef
-Topic 280
-SubTopic 10
-Name Accounting Standards Codification
-Section 55
-Paragraph 48
-Publisher FASB
-URI https://asc.fasb.org/1943274/2147482785/280-10-55-48
Reference 2: http://www.xbrl.org/2003/role/disclosureRef
-Topic 280
-SubTopic 10
-Name Accounting Standards Codification
-Section 50
-Paragraph 32
-Subparagraph (f)
-Publisher FASB
-URI https://asc.fasb.org/1943274/2147482810/280-10-50-32
Reference 3: http://www.xbrl.org/2003/role/disclosureRef
-Topic 270
-SubTopic 10
-Name Accounting Standards Codification
-Section 50
-Paragraph 1
-Subparagraph (i)
-Publisher FASB
-URI https://asc.fasb.org/1943274/2147482964/270-10-50-1
Reference 4: http://www.xbrl.org/2003/role/disclosureRef
-Topic 280
-SubTopic 10
-Name Accounting Standards Codification
-Section 50
-Paragraph 32
-Subparagraph (ee)
-Publisher FASB
-URI https://asc.fasb.org/1943274/2147482810/280-10-50-32
Reference 5: http://fasb.org/us-gaap/role/ref/otherTransitionRef
-Topic 280
-SubTopic 10
-Name Accounting Standards Codification
-Section 50
-Paragraph 32
-Subparagraph (d)
-Publisher FASB
-URI https://asc.fasb.org/1943274/2147482810/280-10-50-32
Reference 6: http://www.xbrl.org/2003/role/exampleRef
-Topic 280
-SubTopic 10
-Name Accounting Standards Codification
-Section 55
-Paragraph 54
-Subparagraph (d)
-Publisher FASB
-URI https://asc.fasb.org/1943274/2147482785/280-10-55-54
Reference 7: http://www.xbrl.org/2003/role/exampleRef
-Topic 280
-SubTopic 10
-Name Accounting Standards Codification
-Section 55
-Paragraph 47
-Subparagraph (c)
-Publisher FASB
-URI https://asc.fasb.org/1943274/2147482785/280-10-55-47
Reference 8: http://www.xbrl.org/2003/role/exampleRef
-Topic 280
-SubTopic 10
-Name Accounting Standards Codification
-Section 55
-Paragraph 54
-Subparagraph (a)
-Publisher FASB
-URI https://asc.fasb.org/1943274/2147482785/280-10-55-54
Reference 9: http://www.xbrl.org/2003/role/exampleRef
-Topic 280
-SubTopic 10
-Name Accounting Standards Codification
-Section 55
-Paragraph 47
-Subparagraph (a)
-Publisher FASB
-URI https://asc.fasb.org/1943274/2147482785/280-10-55-47
Reference 10: http://www.xbrl.org/2003/role/exampleRef
-Topic 280
-SubTopic 10
-Name Accounting Standards Codification
-Section 55
-Paragraph 54
-Subparagraph (e)
-Publisher FASB
-URI https://asc.fasb.org/1943274/2147482785/280-10-55-54
Reference 11: http://www.xbrl.org/2003/role/exampleRef
-Topic 280
-SubTopic 10
-Name Accounting Standards Codification
-Section 55
-Paragraph 47
-Subparagraph (d)
-Publisher FASB
-URI https://asc.fasb.org/1943274/2147482785/280-10-55-47
Reference 12: http://www.xbrl.org/2003/role/disclosureRef
-Topic 280
-SubTopic 10
-Name Accounting Standards Codification
-Section 50
-Paragraph 22
-Publisher FASB
-URI https://asc.fasb.org/1943274/2147482810/280-10-50-22
Reference 13: http://www.xbrl.org/2003/role/disclosureRef
-Topic 280
-SubTopic 10
-Name Accounting Standards Codification
-Section 50
-Paragraph 31
-Publisher FASB
-URI https://asc.fasb.org/1943274/2147482810/280-10-50-31
Reference 14: http://www.xbrl.org/2003/role/disclosureRef
-Topic 280
-SubTopic 10
-Name Accounting Standards Codification
-Section 50
-Paragraph 34
-Publisher FASB
-URI https://asc.fasb.org/1943274/2147482810/280-10-50-34
Reference 15: http://www.xbrl.org/2003/role/disclosureRef
-Topic 280
-SubTopic 10
-Name Accounting Standards Codification
-Section 50
-Paragraph 26C
-Publisher FASB
-URI https://asc.fasb.org/1943274/2147482810/280-10-50-26C
Reference 16: http://www.xbrl.org/2003/role/disclosureRef
-Topic 280
-SubTopic 10
-Name Accounting Standards Codification
-Section 50
-Paragraph 26B
-Publisher FASB
-URI https://asc.fasb.org/1943274/2147482810/280-10-50-26B
Reference 17: http://www.xbrl.org/2003/role/disclosureRef
-Topic 280
-SubTopic 10
-Name Accounting Standards Codification
-Section 50
-Paragraph 15
-Publisher FASB
-URI https://asc.fasb.org/1943274/2147482810/280-10-50-15
Reference 18: http://www.xbrl.org/2003/role/disclosureRef
-Topic 280
-SubTopic 10
-Name Accounting Standards Codification
-Section 50
-Paragraph 42
-Publisher FASB
-URI https://asc.fasb.org/1943274/2147482810/280-10-50-42
Reference 19: http://www.xbrl.org/2003/role/disclosureRef
-Topic 280
-SubTopic 10
-Name Accounting Standards Codification
-Section 50
-Paragraph 40
-Publisher FASB
-URI https://asc.fasb.org/1943274/2147482810/280-10-50-40
Reference 20: http://www.xbrl.org/2003/role/disclosureRef
-Topic 280
-Name Accounting Standards Codification
-Publisher FASB
-URI https://asc.fasb.org/280/tableOfContent
Reference 21: http://www.xbrl.org/2003/role/disclosureRef
-Topic 280
-SubTopic 10
-Name Accounting Standards Codification
-Section 50
-Paragraph 26
-Publisher FASB
-URI https://asc.fasb.org/1943274/2147482810/280-10-50-26
Reference 22: http://www.xbrl.org/2003/role/disclosureRef
-Topic 280
-SubTopic 10
-Name Accounting Standards Codification
-Section 50
-Paragraph 41
-Publisher FASB
-URI https://asc.fasb.org/1943274/2147482810/280-10-50-41
Reference 23: http://www.xbrl.org/2003/role/disclosureRef
-Topic 280
-SubTopic 10
-Name Accounting Standards Codification
-Section 50
-Paragraph 21
-Subparagraph (a)
-Publisher FASB
-URI https://asc.fasb.org/1943274/2147482810/280-10-50-21
Reference 24: http://www.xbrl.org/2003/role/disclosureRef
-Topic 280
-SubTopic 10
-Name Accounting Standards Codification
-Section 50
-Paragraph 21
-Subparagraph (b)
-Publisher FASB
-URI https://asc.fasb.org/1943274/2147482810/280-10-50-21
Reference 25: http://www.xbrl.org/2003/role/disclosureRef
-Topic 280
-SubTopic 10
-Name Accounting Standards Codification
-Section 50
-Paragraph 32
-Subparagraph (e)
-Publisher FASB
-URI https://asc.fasb.org/1943274/2147482810/280-10-50-32
| Name: |
us-gaap_SegmentReportingDisclosureTextBlock |
| Namespace Prefix: |
us-gaap_ |
| Data Type: |
dtr-types:textBlockItemType |
| Balance Type: |
na |
| Period Type: |
duration |
|
v3.25.0.1
| X |
- ReferencesReference 1: http://www.xbrl.org/2003/role/presentationRef
-Publisher SEC
-Name Regulation S-K
-Number 229
-Section 402
-Subsection v
-Paragraph 1
| Name: |
ecd_PvpTable |
| Namespace Prefix: |
ecd_ |
| Data Type: |
xbrli:stringItemType |
| Balance Type: |
na |
| Period Type: |
duration |
|
| X |
- DefinitionThe portion of profit or loss for the period, net of income taxes, which is attributable to the parent. Reference 1: http://www.xbrl.org/2003/role/disclosureRef
-Topic 250
-SubTopic 10
-Name Accounting Standards Codification
-Section 50
-Paragraph 6
-Publisher FASB
-URI https://asc.fasb.org/1943274/2147483443/250-10-50-6
Reference 2: http://www.xbrl.org/2003/role/disclosureRef
-Topic 250
-SubTopic 10
-Name Accounting Standards Codification
-Section 50
-Paragraph 9
-Publisher FASB
-URI https://asc.fasb.org/1943274/2147483443/250-10-50-9
Reference 3: http://www.xbrl.org/2003/role/disclosureRef
-Topic 805
-SubTopic 60
-Name Accounting Standards Codification
-Section 65
-Paragraph 1
-Subparagraph (g)
-Publisher FASB
-URI https://asc.fasb.org/1943274/2147476176/805-60-65-1
Reference 4: http://www.xbrl.org/2003/role/disclosureRef
-Topic 740
-SubTopic 323
-Name Accounting Standards Codification
-Section 65
-Paragraph 2
-Subparagraph (g)(3)
-Publisher FASB
-URI https://asc.fasb.org/1943274/2147478666/740-323-65-2
Reference 5: http://fasb.org/us-gaap/role/ref/legacyRef
-Topic 220
-SubTopic 10
-Name Accounting Standards Codification
-Section S99
-Paragraph 2
-Subparagraph (SX 210.5-03(20))
-Publisher FASB
-URI https://asc.fasb.org/1943274/2147483621/220-10-S99-2
Reference 6: http://www.xbrl.org/2003/role/disclosureRef
-Topic 235
-SubTopic 10
-Name Accounting Standards Codification
-Section S99
-Paragraph 1
-Subparagraph (SX 210.4-08(g)(1)(ii))
-Publisher FASB
-URI https://asc.fasb.org/1943274/2147480678/235-10-S99-1
Reference 7: http://www.xbrl.org/2003/role/disclosureRef
-Topic 323
-SubTopic 10
-Name Accounting Standards Codification
-Section 50
-Paragraph 3
-Subparagraph (c)
-Publisher FASB
-URI https://asc.fasb.org/1943274/2147481687/323-10-50-3
Reference 8: http://www.xbrl.org/2003/role/disclosureRef
-Topic 825
-SubTopic 10
-Name Accounting Standards Codification
-Section 50
-Paragraph 28
-Subparagraph (f)
-Publisher FASB
-URI https://asc.fasb.org/1943274/2147482907/825-10-50-28
Reference 9: http://www.xbrl.org/2003/role/disclosureRef
-Topic 220
-SubTopic 10
-Name Accounting Standards Codification
-Section 50
-Paragraph 6
-Publisher FASB
-URI https://asc.fasb.org/1943274/2147482765/220-10-50-6
Reference 10: http://www.xbrl.org/2003/role/disclosureRef
-Topic 250
-SubTopic 10
-Name Accounting Standards Codification
-Section 50
-Paragraph 3
-Publisher FASB
-URI https://asc.fasb.org/1943274/2147483443/250-10-50-3
Reference 11: http://www.xbrl.org/2003/role/disclosureRef
-Topic 250
-SubTopic 10
-Name Accounting Standards Codification
-Section 50
-Paragraph 1
-Subparagraph (b)(2)
-Publisher FASB
-URI https://asc.fasb.org/1943274/2147483443/250-10-50-1
Reference 12: http://www.xbrl.org/2003/role/disclosureRef
-Topic 815
-SubTopic 40
-Name Accounting Standards Codification
-Section 65
-Paragraph 1
-Subparagraph (f)
-Publisher FASB
-URI https://asc.fasb.org/1943274/2147480175/815-40-65-1
Reference 13: http://www.xbrl.org/2003/role/disclosureRef
-Topic 250
-SubTopic 10
-Name Accounting Standards Codification
-Section 50
-Paragraph 8
-Publisher FASB
-URI https://asc.fasb.org/1943274/2147483443/250-10-50-8
Reference 14: http://www.xbrl.org/2003/role/disclosureRef
-Topic 250
-SubTopic 10
-Name Accounting Standards Codification
-Section 50
-Paragraph 11
-Subparagraph (a)
-Publisher FASB
-URI https://asc.fasb.org/1943274/2147483443/250-10-50-11
Reference 15: http://www.xbrl.org/2003/role/disclosureRef
-Topic 250
-SubTopic 10
-Name Accounting Standards Codification
-Section 50
-Paragraph 11
-Subparagraph (b)
-Publisher FASB
-URI https://asc.fasb.org/1943274/2147483443/250-10-50-11
Reference 16: http://www.xbrl.org/2003/role/disclosureRef
-Topic 250
-SubTopic 10
-Name Accounting Standards Codification
-Section 50
-Paragraph 4
-Publisher FASB
-URI https://asc.fasb.org/1943274/2147483443/250-10-50-4
Reference 17: http://www.xbrl.org/2003/role/exampleRef
-Topic 946
-SubTopic 830
-Name Accounting Standards Codification
-Section 55
-Paragraph 10
-Publisher FASB
-URI https://asc.fasb.org/1943274/2147479168/946-830-55-10
Reference 18: http://www.xbrl.org/2003/role/disclosureRef
-Topic 946
-SubTopic 220
-Name Accounting Standards Codification
-Section 45
-Paragraph 7
-Publisher FASB
-URI https://asc.fasb.org/1943274/2147479105/946-220-45-7
Reference 19: http://www.xbrl.org/2003/role/disclosureRef
-Topic 944
-SubTopic 220
-Name Accounting Standards Codification
-Section S99
-Paragraph 1
-Subparagraph (SX 210.7-04(18))
-Publisher FASB
-URI https://asc.fasb.org/1943274/2147477250/944-220-S99-1
Reference 20: http://www.xbrl.org/2003/role/disclosureRef
-Topic 946
-SubTopic 220
-Name Accounting Standards Codification
-Section S99
-Paragraph 1
-Subparagraph (SX 210.6-07(9))
-Publisher FASB
-URI https://asc.fasb.org/1943274/2147479134/946-220-S99-1
Reference 21: http://www.xbrl.org/2003/role/disclosureRef
-Topic 946
-SubTopic 220
-Name Accounting Standards Codification
-Section S99
-Paragraph 3
-Subparagraph (SX 210.6-09(1)(d))
-Publisher FASB
-URI https://asc.fasb.org/1943274/2147479134/946-220-S99-3
Reference 22: http://www.xbrl.org/2003/role/disclosureRef
-Topic 470
-SubTopic 10
-Name Accounting Standards Codification
-Section S99
-Paragraph 1A
-Subparagraph (SX 210.13-01(a)(4)(i))
-Publisher FASB
-URI https://asc.fasb.org/1943274/2147480097/470-10-S99-1A
Reference 23: http://www.xbrl.org/2009/role/commonPracticeRef
-Topic 470
-SubTopic 10
-Name Accounting Standards Codification
-Section S99
-Paragraph 1A
-Subparagraph (SX 210.13-01(a)(4)(ii))
-Publisher FASB
-URI https://asc.fasb.org/1943274/2147480097/470-10-S99-1A
Reference 24: http://www.xbrl.org/2003/role/disclosureRef
-Topic 470
-SubTopic 10
-Name Accounting Standards Codification
-Section S99
-Paragraph 1A
-Subparagraph (SX 210.13-01(a)(4)(iii)(A))
-Publisher FASB
-URI https://asc.fasb.org/1943274/2147480097/470-10-S99-1A
Reference 25: http://www.xbrl.org/2003/role/disclosureRef
-Topic 470
-SubTopic 10
-Name Accounting Standards Codification
-Section S99
-Paragraph 1A
-Subparagraph (SX 210.13-01(a)(4)(iv))
-Publisher FASB
-URI https://asc.fasb.org/1943274/2147480097/470-10-S99-1A
Reference 26: http://www.xbrl.org/2003/role/disclosureRef
-Topic 470
-SubTopic 10
-Name Accounting Standards Codification
-Section S99
-Paragraph 1A
-Subparagraph (SX 210.13-01(a)(5))
-Publisher FASB
-URI https://asc.fasb.org/1943274/2147480097/470-10-S99-1A
Reference 27: http://www.xbrl.org/2003/role/disclosureRef
-Topic 470
-SubTopic 10
-Name Accounting Standards Codification
-Section S99
-Paragraph 1B
-Subparagraph (SX 210.13-02(a)(4)(i))
-Publisher FASB
-URI https://asc.fasb.org/1943274/2147480097/470-10-S99-1B
Reference 28: http://www.xbrl.org/2003/role/disclosureRef
-Topic 470
-SubTopic 10
-Name Accounting Standards Codification
-Section S99
-Paragraph 1B
-Subparagraph (SX 210.13-02(a)(4)(iii)(A))
-Publisher FASB
-URI https://asc.fasb.org/1943274/2147480097/470-10-S99-1B
Reference 29: http://www.xbrl.org/2003/role/disclosureRef
-Topic 470
-SubTopic 10
-Name Accounting Standards Codification
-Section S99
-Paragraph 1B
-Subparagraph (SX 210.13-02(a)(4)(iii)(B))
-Publisher FASB
-URI https://asc.fasb.org/1943274/2147480097/470-10-S99-1B
Reference 30: http://www.xbrl.org/2003/role/disclosureRef
-Topic 470
-SubTopic 10
-Name Accounting Standards Codification
-Section S99
-Paragraph 1B
-Subparagraph (SX 210.13-02(a)(4)(iv))
-Publisher FASB
-URI https://asc.fasb.org/1943274/2147480097/470-10-S99-1B
Reference 31: http://www.xbrl.org/2003/role/disclosureRef
-Topic 470
-SubTopic 10
-Name Accounting Standards Codification
-Section S99
-Paragraph 1B
-Subparagraph (SX 210.13-02(a)(5))
-Publisher FASB
-URI https://asc.fasb.org/1943274/2147480097/470-10-S99-1B
Reference 32: http://www.xbrl.org/2003/role/disclosureRef
-Topic 260
-SubTopic 10
-Name Accounting Standards Codification
-Section 45
-Paragraph 60B
-Subparagraph (a)
-Publisher FASB
-URI https://asc.fasb.org/1943274/2147482689/260-10-45-60B
Reference 33: http://www.xbrl.org/2003/role/disclosureRef
-Topic 205
-SubTopic 20
-Name Accounting Standards Codification
-Section 50
-Paragraph 7
-Publisher FASB
-URI https://asc.fasb.org/1943274/2147483499/205-20-50-7
Reference 34: http://fasb.org/us-gaap/role/ref/legacyRef
-Topic 230
-SubTopic 10
-Name Accounting Standards Codification
-Section 45
-Paragraph 28
-Publisher FASB
-URI https://asc.fasb.org/1943274/2147482740/230-10-45-28
Reference 35: http://www.xbrl.org/2003/role/disclosureRef
-Topic 220
-SubTopic 10
-Name Accounting Standards Codification
-Section 45
-Paragraph 1A
-Subparagraph (a)
-Publisher FASB
-URI https://asc.fasb.org/1943274/2147482790/220-10-45-1A
Reference 36: http://www.xbrl.org/2003/role/disclosureRef
-Topic 220
-SubTopic 10
-Name Accounting Standards Codification
-Section 45
-Paragraph 1B
-Subparagraph (a)
-Publisher FASB
-URI https://asc.fasb.org/1943274/2147482790/220-10-45-1B
Reference 37: http://fasb.org/us-gaap/role/ref/legacyRef
-Topic 942
-SubTopic 220
-Name Accounting Standards Codification
-Section S99
-Paragraph 1
-Subparagraph (SX 210.9-04(22))
-Publisher FASB
-URI https://asc.fasb.org/1943274/2147478524/942-220-S99-1
| Name: |
us-gaap_NetIncomeLoss |
| Namespace Prefix: |
us-gaap_ |
| Data Type: |
xbrli:monetaryItemType |
| Balance Type: |
credit |
| Period Type: |
duration |
|
v3.25.0.1
Award Timing Disclosure
|
12 Months Ended |
|
Dec. 31, 2024 |
Feb. 09, 2024
USD ($)
shares
$ / shares
|
| Award Timing Disclosures [Line Items] |
|
|
| Award Timing MNPI Disclosure |
Our current and historical practice is to grant equity awards only during periods when our trading window for insiders is open pursuant to our Insider Trading Policy. The annual equity grant, including to our executive officers, usually occurs within one week after we publicly announce our financial results for the fourth quarter and full fiscal year and our interim equity grants during the year (for example, to newly hired or promoted employees) usually occurs within one week after we publicly announce our financial results for a financial quarter. In 2024, the Compensation, People and Culture Committee of our Board approved the annual grant of equity awards on February 9, 2024, which was the day the trading window for insiders opened after we announced our 2023 fourth quarter and full year financial results. We filed our 2023 Annual Report on Form 10-K with the SEC on February 7, 2024; however, our filing occurred after the SEC’s filing cutoff time and our 2023 Annual Report on Form 10-K received a filing date of February 8, 2024. As a result, the annual grant of equity awards to our named executive officers, including the grant of the SOSARs listed in the table below, occurred one business day after the filing of our 2023 Annual Report on Form 10-K with the SEC.
|
|
| Award Timing Method |
The annual equity grant, including to our executive officers, usually occurs within one week after we publicly announce our financial results for the fourth quarter and full fiscal year and our interim equity grants during the year (for example, to newly hired or promoted employees) usually occurs within one week after we publicly announce our financial results for a financial quarter. In 2024, the Compensation, People and Culture Committee of our Board approved the annual grant of equity awards on February 9, 2024, which was the day the trading window for insiders opened after we announced our 2023 fourth quarter and full year financial results.
|
|
| Award Timing Predetermined |
true
|
|
| Award Timing MNPI Considered |
true
|
|
| Award Timing, How MNPI Considered |
In 2024, the Compensation, People and Culture Committee of our Board approved the annual grant of equity awards on February 9, 2024, which was the day the trading window for insiders opened after we announced our 2023 fourth quarter and full year financial results. We filed our 2023 Annual Report on Form 10-K with the SEC on February 7, 2024; however, our filing occurred after the SEC’s filing cutoff time and our 2023 Annual Report on Form 10-K received a filing date of February 8, 2024. As a result, the annual grant of equity awards to our named executive officers, including the grant of the SOSARs listed in the table below, occurred one business day after the filing of our 2023 Annual Report on Form 10-K with the SEC.
|
|
| MNPI Disclosure Timed for Compensation Value |
false
|
|
| Awards Close in Time to MNPI Disclosures, Table |
| | | | | | | | | | | | | | | | | | | | | | | | | | | | | | | Name | Grant Date | | Number of securities underly the award | | Exercise price of the award
($/SH) | | Grant date fair value of the award | | Percentage change in the closing market price of the securities underlying the award between the trading day ending immediately prior to the disclosure of material nonpublic information and the trading day beginning immediately following the disclosure of material nonpublic information | | Brian Niccol | 2/9/2024 | | 476,800 | | $ | 52.77 | | $ | 8,048,384 | | (1.08)% | | Jack Hartung | 2/9/2024 | | 154,000 | | $ | 52.77 | | $ | 2,599,520 | | (1.08)% | | Curt Garner | 2/9/2024 | | 148,100 | | $ | 52.77 | | $ | 2,499,928 | | (1.08)% | | Scott Boatwright | 2/9/2024 | | 118,500 | | $ | 52.77 | | $ | 2,002,800 | | (1.08)% | | Chris Brandt | 2/9/2024 | | 56,300 | | $ | 52.77 | | $ | 950,592 | | (1.08)% |
|
|
| Brian Niccol [Member] |
|
|
| Awards Close in Time to MNPI Disclosures |
|
|
| Name |
|
Brian Niccol
|
| Underlying Securities | shares |
|
476,800
|
| Exercise Price | $ / shares |
|
$ 52.77
|
| Fair Value as of Grant Date | $ |
|
$ 8,048,384
|
| Underlying Security Market Price Change |
|
(0.0108)
|
| Jack Hartung [Member] |
|
|
| Awards Close in Time to MNPI Disclosures |
|
|
| Name |
|
Jack Hartung
|
| Underlying Securities | shares |
|
154,000
|
| Exercise Price | $ / shares |
|
$ 52.77
|
| Fair Value as of Grant Date | $ |
|
$ 2,599,520
|
| Underlying Security Market Price Change |
|
(0.0108)
|
| Curt Garner [Member] |
|
|
| Awards Close in Time to MNPI Disclosures |
|
|
| Name |
|
Curt Garner
|
| Underlying Securities | shares |
|
148,100
|
| Exercise Price | $ / shares |
|
$ 52.77
|
| Fair Value as of Grant Date | $ |
|
$ 2,499,928
|
| Underlying Security Market Price Change |
|
(0.0108)
|
| Scott Boatwright [Member] |
|
|
| Awards Close in Time to MNPI Disclosures |
|
|
| Name |
|
Scott Boatwright
|
| Underlying Securities | shares |
|
118,500
|
| Exercise Price | $ / shares |
|
$ 52.77
|
| Fair Value as of Grant Date | $ |
|
$ 2,002,800
|
| Underlying Security Market Price Change |
|
(0.0108)
|
| Chris Brandt [Member] |
|
|
| Awards Close in Time to MNPI Disclosures |
|
|
| Name |
|
Chris Brandt
|
| Underlying Securities | shares |
|
56,300
|
| Exercise Price | $ / shares |
|
$ 52.77
|
| Fair Value as of Grant Date | $ |
|
$ 950,592
|
| Underlying Security Market Price Change |
|
(0.0108)
|
| X |
- ReferencesReference 1: http://www.xbrl.org/2003/role/presentationRef
-Publisher SEC
-Name Regulation S-K
-Number 229
-Section 402
-Subsection x
-Paragraph 2
-Subparagraph ii
-Sentence D
| Name: |
ecd_AwardExrcPrice |
| Namespace Prefix: |
ecd_ |
| Data Type: |
dtr-types:perShareItemType |
| Balance Type: |
na |
| Period Type: |
instant |
|
| X |
- ReferencesReference 1: http://www.xbrl.org/2003/role/presentationRef
-Publisher SEC
-Name Regulation S-K
-Number 229
-Section 402
-Subsection x
-Paragraph 2
-Subparagraph ii
-Sentence E
| Name: |
ecd_AwardGrantDateFairValue |
| Namespace Prefix: |
ecd_ |
| Data Type: |
xbrli:monetaryItemType |
| Balance Type: |
na |
| Period Type: |
instant |
|
| X |
- ReferencesReference 1: http://www.xbrl.org/2003/role/presentationRef
-Publisher SEC
-Name Regulation S-K
-Number 229
-Section 402
-Subsection x
-Paragraph 1
| Name: |
ecd_AwardTmgDiscLineItems |
| Namespace Prefix: |
ecd_ |
| Data Type: |
xbrli:stringItemType |
| Balance Type: |
na |
| Period Type: |
duration |
|
| X |
- ReferencesReference 1: http://www.xbrl.org/2003/role/presentationRef
-Publisher SEC
-Name Regulation S-K
-Number 229
-Section 402
-Subsection x
-Paragraph 1
| Name: |
ecd_AwardTmgHowMnpiCnsdrdTextBlock |
| Namespace Prefix: |
ecd_ |
| Data Type: |
dtr-types:textBlockItemType |
| Balance Type: |
na |
| Period Type: |
duration |
|
| X |
- ReferencesReference 1: http://www.xbrl.org/2003/role/presentationRef
-Publisher SEC
-Name Regulation S-K
-Number 229
-Section 402
-Subsection x
-Paragraph 1
| Name: |
ecd_AwardTmgMethodTextBlock |
| Namespace Prefix: |
ecd_ |
| Data Type: |
dtr-types:textBlockItemType |
| Balance Type: |
na |
| Period Type: |
duration |
|
| X |
- ReferencesReference 1: http://www.xbrl.org/2003/role/presentationRef
-Publisher SEC
-Name Regulation S-K
-Number 229
-Section 402
-Subsection x
-Paragraph 1
| Name: |
ecd_AwardTmgMnpiCnsdrdFlag |
| Namespace Prefix: |
ecd_ |
| Data Type: |
xbrli:booleanItemType |
| Balance Type: |
na |
| Period Type: |
duration |
|
| X |
- ReferencesReference 1: http://www.xbrl.org/2003/role/presentationRef
-Publisher SEC
-Name Regulation S-K
-Number 229
-Section 402
-Subsection x
-Paragraph 1
| Name: |
ecd_AwardTmgMnpiDiscTextBlock |
| Namespace Prefix: |
ecd_ |
| Data Type: |
dtr-types:textBlockItemType |
| Balance Type: |
na |
| Period Type: |
duration |
|
| X |
- ReferencesReference 1: http://www.xbrl.org/2003/role/presentationRef
-Publisher SEC
-Name Regulation S-K
-Number 229
-Section 402
-Subsection x
-Paragraph 1
| Name: |
ecd_AwardTmgPredtrmndFlag |
| Namespace Prefix: |
ecd_ |
| Data Type: |
xbrli:booleanItemType |
| Balance Type: |
na |
| Period Type: |
duration |
|
| X |
- ReferencesReference 1: http://www.xbrl.org/2003/role/presentationRef
-Publisher SEC
-Name Regulation S-K
-Number 229
-Section 402
-Subsection x
-Paragraph 2
-Subparagraph ii
-Sentence C
| Name: |
ecd_AwardUndrlygSecuritiesAmt |
| Namespace Prefix: |
ecd_ |
| Data Type: |
xbrli:decimalItemType |
| Balance Type: |
na |
| Period Type: |
instant |
|
| X |
- ReferencesReference 1: http://www.xbrl.org/2003/role/presentationRef
-Publisher SEC
-Name Regulation S-K
-Number 229
-Section 402
-Subsection x
-Paragraph 2
-Subparagraph ii
-Sentence A
| Name: |
ecd_AwardsCloseToMnpiDiscIndName |
| Namespace Prefix: |
ecd_ |
| Data Type: |
xbrli:stringItemType |
| Balance Type: |
na |
| Period Type: |
instant |
|
| X |
- ReferencesReference 1: http://www.xbrl.org/2003/role/presentationRef
-Publisher SEC
-Name Regulation S-K
-Number 229
-Section 402
-Subsection x
-Paragraph 2
| Name: |
ecd_AwardsCloseToMnpiDiscTable |
| Namespace Prefix: |
ecd_ |
| Data Type: |
xbrli:stringItemType |
| Balance Type: |
na |
| Period Type: |
duration |
|
| X |
- ReferencesReference 1: http://www.xbrl.org/2003/role/presentationRef
-Publisher SEC
-Name Regulation S-K
-Number 229
-Section 402
-Subsection x
-Paragraph 2
| Name: |
ecd_AwardsCloseToMnpiDiscTableTextBlock |
| Namespace Prefix: |
ecd_ |
| Data Type: |
dtr-types:textBlockItemType |
| Balance Type: |
na |
| Period Type: |
duration |
|
| X |
- ReferencesReference 1: http://www.xbrl.org/2003/role/presentationRef
-Publisher SEC
-Name Regulation S-K
-Number 229
-Section 402
-Subsection x
-Paragraph 1
| Name: |
ecd_MnpiDiscTimedForCompValFlag |
| Namespace Prefix: |
ecd_ |
| Data Type: |
xbrli:booleanItemType |
| Balance Type: |
na |
| Period Type: |
duration |
|
| X |
- ReferencesReference 1: http://www.xbrl.org/2003/role/presentationRef
-Publisher SEC
-Name Regulation S-K
-Number 229
-Section 402
-Subsection x
-Paragraph 2
-Subparagraph ii
-Sentence F
| Name: |
ecd_UndrlygSecurityMktPriceChngPct |
| Namespace Prefix: |
ecd_ |
| Data Type: |
xbrli:pureItemType |
| Balance Type: |
na |
| Period Type: |
instant |
|
| X |
- Details
| Name: |
ecd_IndividualAxis=cmg_BrianNiccolMember |
| Namespace Prefix: |
|
| Data Type: |
na |
| Balance Type: |
|
| Period Type: |
|
|
| X |
- Details
| Name: |
ecd_IndividualAxis=cmg_JackHartungMember |
| Namespace Prefix: |
|
| Data Type: |
na |
| Balance Type: |
|
| Period Type: |
|
|
| X |
- Details
| Name: |
ecd_IndividualAxis=cmg_CurtGarnerMember |
| Namespace Prefix: |
|
| Data Type: |
na |
| Balance Type: |
|
| Period Type: |
|
|
| X |
- Details
| Name: |
ecd_IndividualAxis=cmg_ScottBoatwrightMember |
| Namespace Prefix: |
|
| Data Type: |
na |
| Balance Type: |
|
| Period Type: |
|
|
| X |
- Details
| Name: |
ecd_IndividualAxis=cmg_ChrisBrandtMember |
| Namespace Prefix: |
|
| Data Type: |
na |
| Balance Type: |
|
| Period Type: |
|
|
v3.25.0.1
Insider Trading Arrangements
|
3 Months Ended |
12 Months Ended |
|
Dec. 31, 2024
shares
|
Dec. 31, 2024
shares
|
| Trading Arrangements, by Individual |
|
|
| Non-Rule 10b5-1 Arrangement Adopted |
false
|
|
| Rule 10b5-1 Arrangement Terminated |
false
|
|
| Non-Rule 10b5-1 Arrangement Terminated |
false
|
|
| Scott Boatwright [Member] |
|
|
| Trading Arrangements, by Individual |
|
|
| Material Terms of Trading Arrangement |
|
Scott Boatwright, our Chief Executive Officer, adopted a new written trading plan on December 6, 2024 for the sale of up to 247,050 shares of the Company’s common stock, subject to certain conditions, from March 5, 2025, at the earliest, until December 31, 2025, at the latest. This trading plan was adopted during an open trading window and complies with the Company’s Insider Trading Policy. Actual transactions will be disclosed in Section 16 filings made with the SEC in accordance with applicable securities laws, rules and regulations.
|
| Name |
Scott Boatwright
|
|
| Title |
Chief Executive Officer
|
|
| Rule 10b5-1 Arrangement Adopted |
true
|
|
| Adoption Date |
December 6, 2024
|
|
| Expiration Date |
December 31, 2025
|
|
| Arrangement Duration |
301 days
|
|
| Aggregate Available |
247,050
|
247,050
|
| X |
- ReferencesReference 1: http://www.xbrl.org/2003/role/presentationRef
-Publisher SEC
-Name Regulation S-K
-Number 229
-Section 408
-Subsection a
-Paragraph 1
| Name: |
ecd_MtrlTermsOfTrdArrTextBlock |
| Namespace Prefix: |
ecd_ |
| Data Type: |
dtr-types:textBlockItemType |
| Balance Type: |
na |
| Period Type: |
duration |
|
| X |
- ReferencesReference 1: http://www.xbrl.org/2003/role/presentationRef
-Publisher SEC
-Name Regulation S-K
-Number 229
-Section 408
-Subsection a
-Paragraph 1
| Name: |
ecd_NonRule10b51ArrAdoptedFlag |
| Namespace Prefix: |
ecd_ |
| Data Type: |
xbrli:booleanItemType |
| Balance Type: |
na |
| Period Type: |
duration |
|
| X |
- ReferencesReference 1: http://www.xbrl.org/2003/role/presentationRef
-Publisher SEC
-Name Regulation S-K
-Number 229
-Section 408
-Subsection a
-Paragraph 1
| Name: |
ecd_NonRule10b51ArrTrmntdFlag |
| Namespace Prefix: |
ecd_ |
| Data Type: |
xbrli:booleanItemType |
| Balance Type: |
na |
| Period Type: |
duration |
|
| X |
- ReferencesReference 1: http://www.xbrl.org/2003/role/presentationRef
-Publisher SEC
-Name Regulation S-K
-Number 229
-Section 408
-Subsection a
-Paragraph 1
| Name: |
ecd_Rule10b51ArrAdoptedFlag |
| Namespace Prefix: |
ecd_ |
| Data Type: |
xbrli:booleanItemType |
| Balance Type: |
na |
| Period Type: |
duration |
|
| X |
- ReferencesReference 1: http://www.xbrl.org/2003/role/presentationRef
-Publisher SEC
-Name Regulation S-K
-Number 229
-Section 408
-Subsection a
-Paragraph 1
| Name: |
ecd_Rule10b51ArrTrmntdFlag |
| Namespace Prefix: |
ecd_ |
| Data Type: |
xbrli:booleanItemType |
| Balance Type: |
na |
| Period Type: |
duration |
|
| X |
- ReferencesReference 1: http://www.xbrl.org/2003/role/presentationRef
-Publisher SEC
-Name Regulation S-K
-Number 229
-Section 408
-Subsection a
-Paragraph 2
-Subparagraph A
| Name: |
ecd_TradingArrByIndTable |
| Namespace Prefix: |
ecd_ |
| Data Type: |
xbrli:stringItemType |
| Balance Type: |
na |
| Period Type: |
duration |
|
| X |
- ReferencesReference 1: http://www.xbrl.org/2003/role/presentationRef
-Publisher SEC
-Name Regulation S-K
-Number 229
-Section 408
-Subsection a
-Paragraph 2
-Subparagraph B
| Name: |
ecd_TrdArrAdoptionDate |
| Namespace Prefix: |
ecd_ |
| Data Type: |
xbrli:stringItemType |
| Balance Type: |
na |
| Period Type: |
duration |
|
| X |
- ReferencesReference 1: http://www.xbrl.org/2003/role/presentationRef
-Publisher SEC
-Name Regulation S-K
-Number 229
-Section 408
-Subsection a
-Paragraph 2
-Subparagraph C
| Name: |
ecd_TrdArrDuration |
| Namespace Prefix: |
ecd_ |
| Data Type: |
xbrli:durationItemType |
| Balance Type: |
na |
| Period Type: |
duration |
|
| X |
- ReferencesReference 1: http://www.xbrl.org/2003/role/presentationRef
-Publisher SEC
-Name Regulation S-K
-Number 229
-Section 408
-Subsection a
-Paragraph 2
-Subparagraph C
| Name: |
ecd_TrdArrExpirationDate |
| Namespace Prefix: |
ecd_ |
| Data Type: |
xbrli:stringItemType |
| Balance Type: |
na |
| Period Type: |
duration |
|
| X |
- ReferencesReference 1: http://www.xbrl.org/2003/role/presentationRef
-Publisher SEC
-Name Regulation S-K
-Number 229
-Section 408
-Subsection a
-Paragraph 2
-Subparagraph A
| Name: |
ecd_TrdArrIndName |
| Namespace Prefix: |
ecd_ |
| Data Type: |
xbrli:stringItemType |
| Balance Type: |
na |
| Period Type: |
duration |
|
| X |
- ReferencesReference 1: http://www.xbrl.org/2003/role/presentationRef
-Publisher SEC
-Name Regulation S-K
-Number 229
-Section 408
-Subsection a
-Paragraph 2
-Subparagraph A
| Name: |
ecd_TrdArrIndTitle |
| Namespace Prefix: |
ecd_ |
| Data Type: |
xbrli:stringItemType |
| Balance Type: |
na |
| Period Type: |
duration |
|
| X |
- ReferencesReference 1: http://www.xbrl.org/2003/role/presentationRef
-Publisher SEC
-Name Regulation S-K
-Number 229
-Section 408
-Subsection a
-Paragraph 2
-Subparagraph D
| Name: |
ecd_TrdArrSecuritiesAggAvailAmt |
| Namespace Prefix: |
ecd_ |
| Data Type: |
xbrli:sharesItemType |
| Balance Type: |
na |
| Period Type: |
instant |
|
| X |
- Details
| Name: |
ecd_IndividualAxis=cmg_ScottBoatwrightMember |
| Namespace Prefix: |
|
| Data Type: |
na |
| Balance Type: |
|
| Period Type: |
|
|
v3.25.0.1
| X |
- ReferencesReference 1: http://www.xbrl.org/2003/role/presentationRef
-Publisher SEC
-Name Regulation S-K
-Number 229
-Section 408
-Subsection b
-Paragraph 1
Reference 2: http://www.xbrl.org/2003/role/presentationRef
-Publisher SEC
-Name Form 20-F
-Section 16
-Subsection J
-Paragraph a
| Name: |
ecd_InsiderTradingPoliciesProcLineItems |
| Namespace Prefix: |
ecd_ |
| Data Type: |
xbrli:stringItemType |
| Balance Type: |
na |
| Period Type: |
duration |
|
| X |
- ReferencesReference 1: http://www.xbrl.org/2003/role/presentationRef
-Publisher SEC
-Name Regulation S-K
-Number 229
-Section 408
-Subsection b
-Paragraph 1
Reference 2: http://www.xbrl.org/2003/role/presentationRef
-Publisher SEC
-Name Form 20-F
-Section 16
-Subsection J
-Paragraph a
| Name: |
ecd_InsiderTrdPoliciesProcAdoptedFlag |
| Namespace Prefix: |
ecd_ |
| Data Type: |
xbrli:booleanItemType |
| Balance Type: |
na |
| Period Type: |
duration |
|
v3.25.0.1
Cybersecurity Risk Management and Strategy Disclosure
|
12 Months Ended |
Dec. 31, 2024 |
|---|
| Cybersecurity Risk Management, Strategy, and Governance [Line Items] |
|
| Cybersecurity Risk Management Processes for Assessing, Identifying, and Managing Threats [Text Block] |
As a global company, we are regularly subject to cyberattacks and other cybersecurity incidents. In response, we have implemented cybersecurity processes, technologies, and controls to aid in our efforts to assess, identify, and manage cybersecurity risks. Our enterprise risk management framework considers cybersecurity risk alongside other company risks as part of our overall risk assessment process. Our enterprise risk management team collaborates with our Information Security function, led by our Chief Information Security Officer (“CISO”) and our Chief Customer and Technology Officer (“CCTO”), to gather insights for assessing, identifying and managing cybersecurity threat risks, their severity, and potential mitigations. We also are a member of an industry cybersecurity intelligence and risk sharing organization to stay abreast of changes in the cybersecurity environment. We assess Chipotle’s Information Security program using an industry cybersecurity framework from the National Institute of Standards and Technology. This program includes policies, processes and procedures that help assess and identify our cybersecurity risks and inform how security measures and controls are developed, implemented and maintained. The risk assessment along with risk-based analysis and judgment are used to select security controls to address risks. During this process, the following factors, among others, are considered: likelihood and severity of risk, impact on the Company and others if a risk materializes, feasibility and cost of controls and impact of controls on operations. We maintain internal resources to perform penetration testing designed to simulate evolving tactics and techniques of real-world threat actors, engage with industry partners and law enforcement and intelligence communities and conduct tabletop exercises and periodic risk interviews across our business. We also engage an independent third party to periodically perform internal and external penetration testing of Chipotle's information security environment and engage other third parties to periodically conduct assessments of our cybersecurity capabilities. In addition, we continue to expand training and awareness practices to mitigate risk from human error, including mandatory computer-based training and internal communications for employees. Our employees undergo cybersecurity awareness training and regular phishing awareness campaigns that are based upon and designed to emulate real-world contemporary threats. We provide prompt feedback (and, if necessary, additional training or remedial action) based on the results of such exercises. Our processes also address cybersecurity risks associated with our use of third-party service providers including suppliers, software and cloud-based service providers, as well as third-party security firms used in different capacities to provide or operate some of our cybersecurity controls and technology systems. We proactively evaluate the cybersecurity risk of a third party by utilizing a repository of risk assessments, external monitoring sources, threat intelligence and predictive analytics to better inform Chipotle during contracting and vendor selection processes. Additionally, when third party risks are identified, we require those third parties to agree by contract to implement appropriate security controls. Security issues are documented and tracked, and periodic monitoring of third parties is conducted in an effort to mitigate risk. In addition to the processes, technologies, and controls that we have in place to reduce the likelihood of a material cybersecurity incident (or series of related cybersecurity incidents), Chipotle has a written incident response plan outlining how to address cybersecurity events that occur. The plan sets forth the steps for coordination among various corporate functions and governance groups and serves as a framework for the execution of responsibilities across businesses and operational roles. Our incident response plan is designed to help us coordinate actions to prepare for, detect, respond to and recover from cybersecurity incidents, and includes processes to triage, assess severity, escalate, contain, investigate, and remediate the incident, as well as to assess the need for disclosure, comply with applicable legal obligations and mitigate the impact to our brand and reputation and on impacted parties. We also maintain insurance coverage that, subject to its terms and conditions, is intended to help us cover certain costs associated with cybersecurity incidents and information system failures. In addition to our cybersecurity incident response plan, we conduct tabletop exercises to enhance our incident response preparedness. We maintain business continuity and disaster recovery plans to prepare for and respond to the potential for a disruption in the technology we rely on. Chipotle (or the third parties it relies on) may not be able to fully, continuously, or effectively implement security controls as intended. As described above, we utilize a risk-based approach and judgment to determine whether and how to implement certain security controls and it is possible that we may not implement the necessary controls if we are unable to recognize or underestimate a particular risk. In addition, security controls, no matter how well designed or implemented, may only mitigate and not fully eliminate cybersecurity risks. Cybersecurity events, when detected by security tools or third parties, may not always be identified immediately or addressed in the manner intended by our cybersecurity incident response plan.
|
| Cybersecurity Risk Management Processes Integrated [Flag] |
true
|
| Cybersecurity Risk Management Processes Integrated [Text Block] |
As a global company, we are regularly subject to cyberattacks and other cybersecurity incidents. In response, we have implemented cybersecurity processes, technologies, and controls to aid in our efforts to assess, identify, and manage cybersecurity risks. Our enterprise risk management framework considers cybersecurity risk alongside other company risks as part of our overall risk assessment process. Our enterprise risk management team collaborates with our Information Security function, led by our Chief Information Security Officer (“CISO”) and our Chief Customer and Technology Officer (“CCTO”), to gather insights for assessing, identifying and managing cybersecurity threat risks, their severity, and potential mitigations. We also are a member of an industry cybersecurity intelligence and risk sharing organization to stay abreast of changes in the cybersecurity environment.
|
| Cybersecurity Risk Management Third Party Engaged [Flag] |
true
|
| Cybersecurity Risk Third Party Oversight and Identification Processes [Flag] |
true
|
| Cybersecurity Risk Materially Affected or Reasonably Likely to Materially Affect Registrant [Flag] |
true
|
| Cybersecurity Risk Board of Directors Oversight [Text Block] |
We assess Chipotle’s Information Security program using an industry cybersecurity framework from the National Institute of Standards and Technology. This program includes policies, processes and procedures that help assess and identify our cybersecurity risks and inform how security measures and controls are developed, implemented and maintained. The risk assessment along with risk-based analysis and judgment are used to select security controls to address risks. During this process, the following factors, among others, are considered: likelihood and severity of risk, impact on the Company and others if a risk materializes, feasibility and cost of controls and impact of controls on operations. Our cybersecurity risk management and strategy processes are led by our CISO and our CCTO. These individuals have collectively over 50 years of professional experience in various roles across multiple industries involving managing information security, developing cybersecurity strategy, implementing effective information and cybersecurity programs and managing multiple industry and regulatory compliance environments. Both individuals previously held positions similar to their current roles at other large publicly traded organizations. Cybersecurity is an important part of our risk management processes and an area of focus for our Board of Directors (the “Board”) and management. Although cybersecurity risk oversight continues to remain a top priority for the Board, the Audit and Risk Committee of our Board has primary oversight responsibility for the Company’s cybersecurity and other technology risks. The Committee regularly reviews with and discusses cybersecurity, privacy and data security programs, the status of projects to strengthen internal cybersecurity, results from third-party assessments, and any significant cybersecurity incidents, including recent incidents at other companies and the emerging threat landscape with our CISO and CCTO. The Committee also reviews with management the implementation and effectiveness of the Company’s controls to monitor and mitigate cybersecurity risks. In addition, our Board receives an annual report and quarterly written updates regarding our cybersecurity program.
|
| Cybersecurity Risk Board Committee or Subcommittee Responsible for Oversight [Text Block] |
Cybersecurity is an important part of our risk management processes and an area of focus for our Board of Directors (the “Board”) and management. Although cybersecurity risk oversight continues to remain a top priority for the Board, the Audit and Risk Committee of our Board has primary oversight responsibility for the Company’s cybersecurity and other technology risks.
|
| Cybersecurity Risk Process for Informing Board Committee or Subcommittee Responsible for Oversight [Text Block] |
Cybersecurity is an important part of our risk management processes and an area of focus for our Board of Directors (the “Board”) and management. Although cybersecurity risk oversight continues to remain a top priority for the Board, the Audit and Risk Committee of our Board has primary oversight responsibility for the Company’s cybersecurity and other technology risks. The Committee regularly reviews with and discusses cybersecurity, privacy and data security programs, the status of projects to strengthen internal cybersecurity, results from third-party assessments, and any significant cybersecurity incidents, including recent incidents at other companies and the emerging threat landscape with our CISO and CCTO. The Committee also reviews with management the implementation and effectiveness of the Company’s controls to monitor and mitigate cybersecurity risks. In addition, our Board receives an annual report and quarterly written updates regarding our cybersecurity program.
|
| Cybersecurity Risk Role of Management [Text Block] |
Our cybersecurity risk management and strategy processes are led by our CISO and our CCTO. These individuals have collectively over 50 years of professional experience in various roles across multiple industries involving managing information security, developing cybersecurity strategy, implementing effective information and cybersecurity programs and managing multiple industry and regulatory compliance environments. Both individuals previously held positions similar to their current roles at other large publicly traded organizations. Cybersecurity is an important part of our risk management processes and an area of focus for our Board of Directors (the “Board”) and management. Although cybersecurity risk oversight continues to remain a top priority for the Board, the Audit and Risk Committee of our Board has primary oversight responsibility for the Company’s cybersecurity and other technology risks. The Committee regularly reviews with and discusses cybersecurity, privacy and data security programs, the status of projects to strengthen internal cybersecurity, results from third-party assessments, and any significant cybersecurity incidents, including recent incidents at other companies and the emerging threat landscape with our CISO and CCTO. The Committee also reviews with management the implementation and effectiveness of the Company’s controls to monitor and mitigate cybersecurity risks. In addition, our Board receives an annual report and quarterly written updates regarding our cybersecurity program.
|
| Cybersecurity Risk Management Positions or Committees Responsible [Flag] |
true
|
| Cybersecurity Risk Management Positions or Committees Responsible [Text Block] |
Our cybersecurity risk management and strategy processes are led by our CISO and our CCTO.
|
| Cybersecurity Risk Management Expertise of Management Responsible [Text Block] |
Our cybersecurity risk management and strategy processes are led by our CISO and our CCTO. These individuals have collectively over 50 years of professional experience in various roles across multiple industries involving managing information security, developing cybersecurity strategy, implementing effective information and cybersecurity programs and managing multiple industry and regulatory compliance environments. Both individuals previously held positions similar to their current roles at other large publicly traded organizations.
|
| Cybersecurity Risk Process for Informing Management or Committees Responsible [Text Block] |
In addition to the processes, technologies, and controls that we have in place to reduce the likelihood of a material cybersecurity incident (or series of related cybersecurity incidents), Chipotle has a written incident response plan outlining how to address cybersecurity events that occur. The plan sets forth the steps for coordination among various corporate functions and governance groups and serves as a framework for the execution of responsibilities across businesses and operational roles. Our incident response plan is designed to help us coordinate actions to prepare for, detect, respond to and recover from cybersecurity incidents, and includes processes to triage, assess severity, escalate, contain, investigate, and remediate the incident, as well as to assess the need for disclosure, comply with applicable legal obligations and mitigate the impact to our brand and reputation and on impacted parties. We also maintain insurance coverage that, subject to its terms and conditions, is intended to help us cover certain costs associated with cybersecurity incidents and information system failures.
|
| Cybersecurity Risk Management Positions or Committees Responsible Report to Board [Flag] |
true
|
| X |
- ReferencesReference 1: http://www.xbrl.org/2003/role/presentationRef
-Publisher SEC
-Name Regulation S-K
-Section 106
-Subsection c
-Paragraph 1
Reference 2: http://www.xbrl.org/2003/role/presentationRef
-Publisher SEC
-Name Form 20-F
-Section 16K
-Subsection c
-Paragraph 1
| Name: |
cyd_CybersecurityRiskBoardCommitteeOrSubcommitteeResponsibleForOversightTextBlock |
| Namespace Prefix: |
cyd_ |
| Data Type: |
dtr-types:textBlockItemType |
| Balance Type: |
na |
| Period Type: |
duration |
|
| X |
- ReferencesReference 1: http://www.xbrl.org/2003/role/presentationRef
-Publisher SEC
-Name Regulation S-K
-Section 106
-Subsection c
-Paragraph 1
Reference 2: http://www.xbrl.org/2003/role/presentationRef
-Publisher SEC
-Name Form 20-F
-Section 16K
-Subsection c
-Paragraph 1
| Name: |
cyd_CybersecurityRiskBoardOfDirectorsOversightTextBlock |
| Namespace Prefix: |
cyd_ |
| Data Type: |
dtr-types:textBlockItemType |
| Balance Type: |
na |
| Period Type: |
duration |
|
| X |
- ReferencesReference 1: http://www.xbrl.org/2003/role/presentationRef
-Publisher SEC
-Name Regulation S-K
-Section 106
-Subsection c
-Paragraph 2
-Subparagraph i
Reference 2: http://www.xbrl.org/2003/role/presentationRef
-Publisher SEC
-Name Form 20-F
-Section 16K
-Subsection c
-Paragraph 2
-Subparagraph i
| Name: |
cyd_CybersecurityRiskManagementExpertiseOfManagementResponsibleTextBlock |
| Namespace Prefix: |
cyd_ |
| Data Type: |
dtr-types:textBlockItemType |
| Balance Type: |
na |
| Period Type: |
duration |
|
| X |
- ReferencesReference 1: http://www.xbrl.org/2003/role/presentationRef
-Publisher SEC
-Name Regulation S-K
-Section 106
-Subsection c
-Paragraph 2
-Subparagraph i
Reference 2: http://www.xbrl.org/2003/role/presentationRef
-Publisher SEC
-Name Form 20-F
-Section 16K
-Subsection c
-Paragraph 2
-Subparagraph i
| Name: |
cyd_CybersecurityRiskManagementPositionsOrCommitteesResponsibleFlag |
| Namespace Prefix: |
cyd_ |
| Data Type: |
i:booleanItemType |
| Balance Type: |
na |
| Period Type: |
duration |
|
| X |
- ReferencesReference 1: http://www.xbrl.org/2003/role/presentationRef
-Publisher SEC
-Name Regulation S-K
-Section 106
-Subsection c
-Paragraph 2
-Subparagraph iii
Reference 2: http://www.xbrl.org/2003/role/presentationRef
-Publisher SEC
-Name Form 20-F
-Section 16K
-Subsection c
-Paragraph 2
-Subparagraph iii
| Name: |
cyd_CybersecurityRiskManagementPositionsOrCommitteesResponsibleReportToBoardFlag |
| Namespace Prefix: |
cyd_ |
| Data Type: |
i:booleanItemType |
| Balance Type: |
na |
| Period Type: |
duration |
|
| X |
- ReferencesReference 1: http://www.xbrl.org/2003/role/presentationRef
-Publisher SEC
-Name Regulation S-K
-Section 106
-Subsection c
-Paragraph 2
-Subparagraph i
Reference 2: http://www.xbrl.org/2003/role/presentationRef
-Publisher SEC
-Name Form 20-F
-Section 16K
-Subsection c
-Paragraph 2
-Subparagraph i
| Name: |
cyd_CybersecurityRiskManagementPositionsOrCommitteesResponsibleTextBlock |
| Namespace Prefix: |
cyd_ |
| Data Type: |
dtr-types:textBlockItemType |
| Balance Type: |
na |
| Period Type: |
duration |
|
| X |
- ReferencesReference 1: http://www.xbrl.org/2003/role/presentationRef
-Publisher SEC
-Name Regulation S-K
-Section 106
-Subsection b
-Paragraph 1
Reference 2: http://www.xbrl.org/2003/role/presentationRef
-Publisher SEC
-Name Form 20-F
-Section 16K
-Subsection b
-Paragraph 1
| Name: |
cyd_CybersecurityRiskManagementProcessesForAssessingIdentifyingAndManagingThreatsTextBlock |
| Namespace Prefix: |
cyd_ |
| Data Type: |
dtr-types:textBlockItemType |
| Balance Type: |
na |
| Period Type: |
duration |
|
| X |
- ReferencesReference 1: http://www.xbrl.org/2003/role/presentationRef
-Publisher SEC
-Name Regulation S-K
-Section 106
-Subsection b
-Paragraph 1
-Subparagraph i
Reference 2: http://www.xbrl.org/2003/role/presentationRef
-Publisher SEC
-Name Form 20-F
-Section 16K
-Subsection b
-Paragraph 1
-Subparagraph i
| Name: |
cyd_CybersecurityRiskManagementProcessesIntegratedFlag |
| Namespace Prefix: |
cyd_ |
| Data Type: |
i:booleanItemType |
| Balance Type: |
na |
| Period Type: |
duration |
|
| X |
- ReferencesReference 1: http://www.xbrl.org/2003/role/presentationRef
-Publisher SEC
-Name Regulation S-K
-Section 106
-Subsection b
-Paragraph 1
-Subparagraph i
Reference 2: http://www.xbrl.org/2003/role/presentationRef
-Publisher SEC
-Name Form 20-F
-Section 16K
-Subsection b
-Paragraph 1
-Subparagraph i
| Name: |
cyd_CybersecurityRiskManagementProcessesIntegratedTextBlock |
| Namespace Prefix: |
cyd_ |
| Data Type: |
dtr-types:textBlockItemType |
| Balance Type: |
na |
| Period Type: |
duration |
|
| X |
- ReferencesReference 1: http://www.xbrl.org/2003/role/presentationRef
-Publisher SEC
-Name Regulation S-K
-Section 106
Reference 2: http://www.xbrl.org/2003/role/presentationRef
-Publisher SEC
-Name Form 20-F
-Section 16K
| Name: |
cyd_CybersecurityRiskManagementStrategyAndGovernanceLineItems |
| Namespace Prefix: |
cyd_ |
| Data Type: |
i:stringItemType |
| Balance Type: |
na |
| Period Type: |
duration |
|
| X |
- ReferencesReference 1: http://www.xbrl.org/2003/role/presentationRef
-Publisher SEC
-Name Regulation S-K
-Section 106
-Subsection b
-Paragraph 1
-Subparagraph ii
Reference 2: http://www.xbrl.org/2003/role/presentationRef
-Publisher SEC
-Name Form 20-F
-Section 16K
-Subsection b
-Paragraph 1
-Subparagraph ii
| Name: |
cyd_CybersecurityRiskManagementThirdPartyEngagedFlag |
| Namespace Prefix: |
cyd_ |
| Data Type: |
i:booleanItemType |
| Balance Type: |
na |
| Period Type: |
duration |
|
| X |
- ReferencesReference 1: http://www.xbrl.org/2003/role/presentationRef
-Publisher SEC
-Name Regulation S-K
-Section 106
-Subsection b
-Paragraph 2
Reference 2: http://www.xbrl.org/2003/role/presentationRef
-Publisher SEC
-Name Form 20-F
-Section 16K
-Subsection b
-Paragraph 2
| Name: |
cyd_CybersecurityRiskMateriallyAffectedOrReasonablyLikelyToMateriallyAffectRegistrantFlag |
| Namespace Prefix: |
cyd_ |
| Data Type: |
i:booleanItemType |
| Balance Type: |
na |
| Period Type: |
duration |
|
| X |
- ReferencesReference 1: http://www.xbrl.org/2003/role/presentationRef
-Publisher SEC
-Name Regulation S-K
-Section 106
-Subsection c
-Paragraph 1
Reference 2: http://www.xbrl.org/2003/role/presentationRef
-Publisher SEC
-Name Form 20-F
-Section 16K
-Subsection c
-Paragraph 1
| Name: |
cyd_CybersecurityRiskProcessForInformingBoardCommitteeOrSubcommitteeResponsibleForOversightTextBlock |
| Namespace Prefix: |
cyd_ |
| Data Type: |
dtr-types:textBlockItemType |
| Balance Type: |
na |
| Period Type: |
duration |
|
| X |
- ReferencesReference 1: http://www.xbrl.org/2003/role/presentationRef
-Publisher SEC
-Name Regulation S-K
-Section 106
-Subsection c
-Paragraph 2
-Subparagraph ii
Reference 2: http://www.xbrl.org/2003/role/presentationRef
-Publisher SEC
-Name Form 20-F
-Section 16K
-Subsection c
-Paragraph 2
-Subparagraph ii
| Name: |
cyd_CybersecurityRiskProcessForInformingManagementOrCommitteesResponsibleTextBlock |
| Namespace Prefix: |
cyd_ |
| Data Type: |
dtr-types:textBlockItemType |
| Balance Type: |
na |
| Period Type: |
duration |
|
| X |
- ReferencesReference 1: http://www.xbrl.org/2003/role/presentationRef
-Publisher SEC
-Name Regulation S-K
-Section 106
-Subsection c
-Paragraph 2
Reference 2: http://www.xbrl.org/2003/role/presentationRef
-Publisher SEC
-Name Form 20-F
-Section 16K
-Subsection c
-Paragraph 2
| Name: |
cyd_CybersecurityRiskRoleOfManagementTextBlock |
| Namespace Prefix: |
cyd_ |
| Data Type: |
dtr-types:textBlockItemType |
| Balance Type: |
na |
| Period Type: |
duration |
|
| X |
- ReferencesReference 1: http://www.xbrl.org/2003/role/presentationRef
-Publisher SEC
-Name Regulation S-K
-Section 106
-Subsection b
-Paragraph 1
-Subparagraph iii
Reference 2: http://www.xbrl.org/2003/role/presentationRef
-Publisher SEC
-Name Form 20-F
-Section 16K
-Subsection b
-Paragraph 1
-Subparagraph iii
| Name: |
cyd_CybersecurityRiskThirdPartyOversightAndIdentificationProcessesFlag |
| Namespace Prefix: |
cyd_ |
| Data Type: |
i:booleanItemType |
| Balance Type: |
na |
| Period Type: |
duration |
|
v3.25.0.1
Description of Business and Summary of Significant Accounting Policies (Policies)
|
12 Months Ended |
Dec. 31, 2024 |
|---|
| Accounting Policies [Abstract] |
|
| Principles of Consolidation and Basis of Presentation |
Principles of Consolidation and Basis of Presentation Our consolidated financial statements include our accounts, our wholly and majority owned subsidiaries and investees we control after elimination of all intercompany accounts and transactions.
|
| Management Estimates |
Management Estimates The preparation of financial statements in conformity with U.S. generally accepted accounting principles requires management to make estimates and assumptions that affect the reported amounts of assets and liabilities and the disclosure of contingent assets and liabilities as of the date of the financial statements, as well as the reported amounts of revenue and expenses during the reporting period. Actual results could differ from those estimates under different assumptions or conditions.
|
| Cash and Cash Equivalents |
Cash and Cash Equivalents We consider highly liquid investment instruments purchased with an initial maturity of three months or less to be cash equivalents. Amounts receivable from credit card companies are also considered cash equivalents as they are both short-term and highly liquid in nature. We maintain cash and cash equivalent balances that exceed federally-insured limits with a number of financial institutions.
|
| Restricted Cash |
Restricted Cash We maintain certain cash balances restricted as to withdrawal or use. Restricted cash assets are primarily insurance-related restricted trust assets.
|
| Accounts Receivable |
Accounts Receivable Accounts receivable primarily consists of receivables from third party gift card distributors, delivery partners, interest receivable, insurance liabilities covered by third-party insurance carriers and vendor rebates.
|
| Allowance for Credit Losses |
Allowance for Credit Losses We closely monitor accounts receivable and held to maturity investment balances and estimate the allowance for credit losses when lifetime credit losses are expected by management. Our estimate is based on historical collection experience, external market data and other factors, including those related to current market conditions and events. We do not recognize a reserve for expected credit losses related to our U.S. Treasury security investments as management has concluded there is no risk of non-payment. As of December 31, 2024 and 2023, our allowance for credit losses was $2,953 and $2,742, respectively.
|
| Inventory |
Inventory Inventory, consisting principally of food, beverages, and supplies, is valued at the lower of first-in, first-out cost or net realizable value.
|
| Equity Method Investments |
Equity Method Investments Investments are accounted for under the equity method if we are able to exercise significant influence, but not control, over an investee. Our share of the earnings or losses as reported by the investees is included in interest and other income, net on the consolidated statements of income and comprehensive income. The investments are evaluated for impairment annually and when facts and circumstances indicate that the carrying value may not be recoverable. If a decline in fair value is determined to be other-than-temporary, an impairment charge is recorded in interest income and other income, net on our consolidated statements of income and comprehensive income.
|
| Investments |
Investments Investments classified as trading securities are carried at fair value with any unrealized gain or loss being recorded in interest and other income, net on the consolidated statements of income and comprehensive income. Investments classified as available-for-sale are carried at fair value with unrealized gains and losses, net of tax, included as a component of other comprehensive income (loss), net of income taxes on the consolidated statements of income and comprehensive income. Held-to-maturity securities are carried at amortized cost. Non-marketable equity investments are measured at cost, less impairments, if any, plus or minus changes resulting from observable price changes in orderly transactions for the identical or similar investment of the same issuer. These gains or losses are included in interest and other income, net on the consolidated statements of income and comprehensive income. Our held-to-maturity investments are comprised of U.S. Treasury securities and corporate debt securities, which are held at amortized cost. We also have investments in notes receivable. Convertible notes are held at fair value. We have elected to fund certain deferred compensation plan obligations, as described further in Note 8. “Stock-Based Compensation and Employee Benefit Plans”, through a rabbi trust, the assets of which are designated as trading securities. The rabbi trust is subject to creditor claims in the event of insolvency, but the assets held in the rabbi trust are not available for general corporate purposes. Amounts in the rabbi trust are invested in mutual funds, consistent with the investment choices selected by participants in their Deferred Plan accounts, which are designated as trading securities, carried at fair value, and are included in other assets on the consolidated balance sheets. We record trading gains and losses, along with the offsetting amount related to the increase or decrease in deferred compensation to reflect our exposure to liabilities for payment under the deferred plan in general and administrative expenses on the consolidated statements of income and comprehensive income.
|
| Fair Value Measurements |
Fair Value Measurements Fair value is the price we would receive to sell an asset or pay to transfer a liability (exit price) in an orderly transaction between market participants. For assets and liabilities recorded or disclosed at fair value, we determine fair value based on the following: Level 1: Quoted prices in active markets for identical assets or liabilities that the entity has the ability to access. Level 2: Observable inputs other than prices included in Level 1, such as quoted prices for similar assets and liabilities in active markets; quoted prices for identical or similar assets and liabilities in markets that are not active; or other inputs that are observable or can be corroborated with observable market data. Level 3: Unobservable inputs for the asset or liability. This includes certain pricing models, discounted cash flow methodologies and similar techniques that use significant unobservable inputs.
|
| Foreign Currency Translation |
Foreign Currency Translation The functional currency of our foreign entities is the currency of the primary economic environment in which the entity operates. The operations, assets, and liabilities of our entities outside the U.S. are initially measured using the functional currency of that entity. Gains and losses arising from the impact of foreign currency exchange rate fluctuations on transactions in foreign currency are included as a separate component of other comprehensive income (loss), net of income taxes on the consolidated statements of income and comprehensive income. Assets and liabilities of these foreign entities are translated at exchange rates in effect as of the balance sheet date. Income and expense accounts are translated monthly using average monthly exchange rates. Resulting translation adjustments are recorded in accumulated other comprehensive loss on the consolidated balance sheets.
|
| Leasehold Improvements, Property and Equipment |
Leasehold Improvements, Property and Equipment Leasehold improvements, property and equipment are recorded at cost. Internal costs directly associated with the acquisition, development and construction of a restaurant are capitalized. During the years ended December 31, 2024, 2023 and 2022, we capitalized $17,624, $15,385, and $12,695 of internal costs, respectively. Expenditures for refurbishments and improvements that significantly add to the productivity capacity or extend the useful life are capitalized, while expenditures for maintenance and repairs are expensed as incurred. Capitalized software includes the costs of developing or obtaining internal-use software, such as external direct costs of materials and services, payroll and benefits costs, additional functionality, and costs to develop or obtain software that allows for access or conversion of historical data by new systems. We capitalize costs when the preliminary project stage is complete, management has authorized and committed to funding the software project, it is probable that the software project will be completed, and it is probable that the software will be used to perform the intended function. Depreciation is calculated using the straight-line method over the estimated useful lives of the assets. Leasehold improvements are amortized over the shorter of the lease term, which generally includes option periods that are reasonably certain, or the estimated useful lives of the assets. Upon retirement or disposal of assets, asset cost and accumulated depreciation are derecognized and any related gain or loss is reflected in impairment, closure costs, and asset disposals in the consolidated statements of income and comprehensive income. Assets to be disposed of are reported at the lower of their carrying amount or fair value less estimated costs to sell. At least annually, or when impairment indicators are present, we evaluate, and adjust when necessary, the estimated useful lives of leasehold improvements, property and equipment. The changes in estimated useful lives did not have a material impact on depreciation in any period. The estimated useful lives are: | | | | | | | Leasehold improvements and buildings | 3-20 years | | Furniture and fixtures | 4-7 years | | Equipment | 3-10 years |
|
| Leases |
Leases The majority of our operating leases consist of restaurant locations and office space. We determine if a contract contains a lease at inception. Our leases generally have remaining terms of 1-20 years and most include options to extend the leases for additional 5-year periods. Generally, the lease term is the minimum of the noncancelable period of the lease or the lease term inclusive of reasonably certain renewal periods up to a term of 20 years. We recognize an operating lease asset and operating lease liability for each lease with a contractual term greater than 12 months at the time of lease inception. We do not record leases with an initial term of 12 months or less on our consolidated balance sheet but continue to record rent expense on a straight-line basis over the lease term. Operating lease assets and liabilities are recognized at the lease commencement date, which is the date we control the use of the property. Operating lease liabilities represent the present value of lease payments not yet paid. We made the policy election to combine lease and non-lease components. We consider fixed CAM part of our fixed future lease payments; therefore, fixed CAM is also included in our lease liability. To determine the present value of lease payments not yet paid, we estimate incremental borrowing rates corresponding to the lease term including reasonably certain renewal periods. As we have no outstanding debt nor committed credit facilities, secured or otherwise, we estimate this rate based on prevailing financial market conditions, comparable company and credit analysis, and management judgment. Total lease costs, which are recorded primarily as occupancy costs, include fixed operating lease costs, variable lease costs and short-term lease costs. Most of our real estate leases require we pay certain expenses, such as CAM costs, real estate taxes and insurance, of which the fixed portion is included in operating lease costs. We recognize operating lease costs on a straight-line basis over the lease term. In addition to the above costs, variable lease costs also include amounts based on a percentage of gross sales in excess of specified levels and are recognized when probable and are not included in determining the present value of our operating lease liability. Operating lease assets represent our right to use an underlying asset and are based upon the operating lease liabilities adjusted for lease payments made at or before the lease commencement date, initial direct costs, lease incentives, and impairment of operating lease assets. For operating leases, operating lease assets are reduced over the lease term by the recognized straight-line lease expense less the amount of accretion of the lease liability. Additionally, tenant incentives used to fund leasehold improvements are generally recognized when earned and reduce our right-of-use asset related to the lease. These are amortized through the operating lease asset as reductions of expense over the lease term. Our lease agreements do not contain any material residual value guarantees or material restrictive covenants. We have not entered into any leases with related parties.
|
| Goodwill |
Goodwill Goodwill is not subject to amortization, but instead is tested for impairment annually in the fourth quarter, or more frequently when impairment indicators are present, and we are required to record any necessary impairment adjustments. Impairment is measured as the excess of the carrying value over the fair value of the goodwill. No impairment charges were recognized on goodwill for the years ended December 31, 2024, 2023 and 2022.
|
| Insurance Liability |
Insurance Liability We are self-insured for a significant portion of our employee health benefits programs, and carry significant retentions for risks and associated liabilities with respect to workers’ compensation, general liability, property and auto damage, employment practices liability, cyber liability and directors’ and officers’ liability. Predetermined loss limits have been arranged with third party insurance companies to limit exposure to these claims. We record a liability that represents our estimated cost of claims incurred and unpaid as of the balance sheet date. Our estimated liability is not discounted and is based on a number of assumptions and factors, including historical trends, actuarial assumptions and economic conditions, and is closely monitored and adjusted when warranted by changing circumstances.
|
| Reserves/Contingencies for Litigation and Other Matters |
Reserves/Contingencies for Litigation and Other Matters We are involved in various claims and legal actions that arise in the ordinary course of business. We record an accrual for legal contingencies when we determine that it is probable that we have incurred a liability and we can reasonably estimate the amount of the loss.
|
| Income Taxes |
Income Taxes We compute income taxes using the asset and liability method, under which deferred income tax assets and liabilities are recognized based on the differences between the financial reporting bases and the respective tax bases of assets and liabilities. Deferred tax assets and liabilities are measured using enacted tax rates expected to apply to taxable income in the years in which we expect the temporary differences to reverse. Any effects of changes in income tax rates or tax laws are included in the provision for income taxes in the period that includes the enactment date. We routinely assess the realizability of our deferred tax assets by jurisdiction and may record a valuation allowance if, based on all available positive and negative evidence, we determine that some portion of the deferred tax assets may not be realized prior to expiration. If we determine that we may be able to realize our deferred tax assets in the future in excess of their net recorded amount, we would make an adjustment to the deferred tax asset valuation allowance, which would reduce the provision for income taxes during the period in which the determination was made that the deferred tax asset can be realized. We evaluate our tax filing positions and recognize a tax benefit from an uncertain tax position only if it is more likely than not that based on its technical merits the tax position will be sustained upon examination by the relevant taxing authorities, including resolutions of any related appeals or litigation processes. The tax benefits recognized in the financial statements from such a position are measured based on the largest tax benefit that has a greater than 50% likelihood of being realized upon settlement with a taxing authority. For uncertain tax positions that do not meet this threshold, we record a related tax reserve in the period in which it arises. We adjust our unrecognized tax benefit liability and provision for income taxes in the period in which the uncertain tax position is effectively settled, the statute of limitations expires for the relevant taxing authority to examine the tax position or when new information becomes available that requires a change in recognition and/or measurement of the liability. We recognize interest to be paid on an underpayment of income taxes in interest expense and any related statutory penalties in the provision for income taxes in our consolidated statements of income and comprehensive income. Accrued interest and penalties are included within the related tax reserve on our consolidated balance sheets.
|
| Revenue Recognition |
Revenue Recognition We generally recognize revenue, net of discounts and incentives, when payment is tendered at the point of sale. We report revenue net of sales-related taxes collected from guests and remitted to governmental taxing authorities. Food and beverage revenue primarily relates to the sale of food and beverages. Delivery service revenue is comprised of delivery and related service fees charged to guests on sales made through Chipotle’s app and website. Delivery Delivery services are fulfilled by third-party service providers. In some cases, we make delivery sales through our website Chipotle.com or the Chipotle App (“White Label Sales”). In other cases, we make delivery sales through a non-Chipotle owned channel, such as the delivery partner’s website or mobile app (“Marketplace Sales”). With respect to White Label Sales, we control the delivery services and generally recognize revenue, including delivery fees, when the delivery partner transfers food to the guest. For these sales, we receive payment directly from the guest at the time of sale. With respect to Marketplace Sales, we generally recognize revenue, excluding delivery fees collected by the delivery partner, when control of the food is transferred to the guest. We receive payment from the delivery partner subsequent to the transfer of food and the payment terms are short-term in nature. Gift Cards We sell gift cards, which do not have expiration dates and we do not deduct non-usage fees from outstanding gift card balances. Gift card balances are initially recorded as unearned revenue. We recognize revenue from gift cards when the gift card is redeemed by the guest. Historically, the majority of gift cards are redeemed within one year. In addition, a portion of gift cards are not expected to be redeemed and will be recognized as breakage over time in proportion to gift card redemptions. The gift card breakage rate is based on company and program specific information, including historical redemption patterns, and expected remittance to government agencies under unclaimed property laws, if applicable. We evaluate our gift card breakage rate estimate annually, or more frequently as circumstances warrant, and apply that rate to gift card redemptions. Gift card liability balances are typically highest at the end of each calendar year following increased gift card sales during the holiday season; accordingly, revenue recognized from gift card liability balances is highest in the first quarter of each calendar year. Chipotle Rewards We have a loyalty program called Chipotle Rewards. Guests who enroll in the program generally earn points for every dollar spent. We may also periodically offer promotions, which typically provide the guest with the opportunity to earn bonus points or other rewards. Guests may redeem earned points for various rewards, which are primarily comprised of free food and beverage items. Earned rewards generally expire one month to two months after they are issued, and points generally expire if an account is inactive for a period of six months. We defer revenue associated with the estimated selling price of points or rewards earned by guests as each point or reward is earned, net of points or rewards we do not expect to be redeemed. The estimated selling price of each point or reward earned is based on the estimated value of the product for which the reward is expected to be redeemed. Our estimate of points and rewards we expect to be redeemed is based on historical and other company specific data. The costs associated with rewards redeemed are primarily included in food, beverage, and packaging on our consolidated statements of income and comprehensive income. We evaluate Chipotle Rewards point breakage annually, or more frequently as circumstances warrant. We recognize revenue associated with Chipotle Rewards within food and beverage revenue on the consolidated statements of income and comprehensive income when a guest redeems an earned reward. Deferred revenue associated with Chipotle Rewards is included in unearned revenue on our consolidated balance sheets.
|
| Food, Beverage and Packaging Costs |
Food, Beverage and Packaging Costs Food, beverage and packaging costs include inventory, warehousing and related purchasing and distribution costs.
|
| Other Operating Costs |
Other Operating Costs Other operating costs include marketing and promotional costs, delivery expense, bank and credit card processing fees, restaurant utilities, technology costs, maintenance costs and other costs that directly support the operation and sales-related activities of our restaurants.
|
| Consideration Received from Vendors |
Consideration Received from Vendors We receive consideration for a variety of vendor-sponsored programs, such as volume rebates and promotions. Vendor consideration is recorded as a reduction of food, beverage and packaging or other operating costs on our consolidated statements of income and comprehensive income depending on the classification of the related costs.
|
| Advertising, Marketing and Promotional Costs |
Advertising, Marketing and Promotional Costs Advertising, marketing and promotional costs are expensed as incurred and totaled $286,044, $264,085 and $250,673 for the years ended December 31, 2024, 2023 and 2022, respectively. Advertising, marketing and promotional costs include costs related to free food which a guest does not need to make a purchase to earn. These costs are included in other operating costs on the consolidated statements of income and comprehensive income.
|
| Stock-Based Compensation |
Stock-Based Compensation RSUs and SOSARs generally vest equally on the second and third anniversaries of the grant date, and SOSARs expire after seven years. PSUs generally vest on the third anniversary of the grant date, depending on performance levels achieved relative to the target market and performance factors in each PSU agreement. Stock-based compensation expense is generally recognized on a straight-line basis for each separate vesting portion. The grant date fair value of RSUs is based on the closing price of Chipotle common stock on the award date. The grant date fair value of PSUs that contain only performance conditions is based on the closing price of Chipotle common stock on the award date, where the grant date fair value of PSUs that also contain market conditions consider the output of the Monte Carlo simulation in the grant date fair value, as applicable. The grant date fair value of SOSARs is determined using the Black-Scholes valuation model. Compensation expense related to employees eligible to retire and retain full rights to the awards is recognized over 12 months which coincides with the service period required to earn the full award. We estimate forfeitures based on historical data when determining the amount of stock-based compensation costs to be recognized in each period. PSUs with performance or market vesting conditions generally vest based on our achievement versus stated targets or criteria over a three-year performance and service period. Performance goals are determined by the Board and include measures such as average restaurant operating margin, restaurant cash flow dollars, new restaurant unit growth, and total shareholder return relative to our peer group. Compensation expense on stock awards subject to performance conditions, which is based on the quantity of awards we have determined are probable of vesting, is recognized over the longer of the estimated performance goal attainment period or time vesting period. Compensation expense is recognized ratably for awards subject to market conditions regardless of whether the market condition is satisfied, provided that the requisite service has been met. Some stock-based compensation awards are made to employees involved in our new restaurant development activities, and expense for these awards is recognized as capitalized development and included in leasehold improvements, property and equipment, net, on the consolidated balance sheets.
|
| Restaurant Pre-Opening Costs |
Restaurant Pre-Opening Costs Pre-opening costs, including rent, wages, benefits and travel for training and opening teams, food and other restaurant operating costs, are expensed as incurred prior to a restaurant opening for business.
|
| Impairment of Long-Lived Assets |
Impairment of Long-Lived Assets Long-lived assets are reviewed for impairment whenever events or changes in circumstances indicate that the carrying amount of an asset may not be recoverable. Long-lived assets are grouped at the lowest level for which identifiable cash flows are largely independent of the cash flows of other assets and liabilities. For restaurant assets we test impairment at the individual restaurant asset group level, which includes leasehold improvements, property and equipment and operating lease assets. The fair value measurement for asset impairment is generally based on Level 3 inputs. See “Fair Value Measurements” above for a description of level inputs. We first compare the carrying value of the asset (or asset group, referred interchangeably throughout as asset) to the asset’s estimated future undiscounted cash flows. If the estimated undiscounted future cash flows are less than the carrying value of the asset, we determine if we have an impairment loss by comparing the carrying value of the asset to the asset's estimated fair value. The estimated fair value of the asset is generally determined using the income approach to measure the fair value, which is based on the present value of estimated future cash flows. Key inputs to the income approach for restaurant assets include the discount rate, projected restaurant revenues and expenses, and sublease income if we are closing the restaurant. In certain cases, management uses other market information, when available, to estimate the fair value of an asset. The impairment charges represent the excess of each asset’s carrying amount over its estimated fair value and are allocated among the long-lived asset or assets of the group.
|
| Earnings per Share |
Earnings per Share Basic earnings per share is calculated by dividing income available to common shareholders by the weighted-average number of shares of common stock outstanding during each period. Diluted earnings per share (“diluted EPS”) is calculated using income available to common shareholders divided by diluted weighted-average shares of common stock outstanding during each period. Potentially dilutive securities include shares of common stock underlying SOSARs and non-vested stock awards (collectively “stock awards”). Diluted EPS considers the impact of potentially dilutive securities except in periods in which there is a loss because the inclusion of the potential common shares would have an anti-dilutive effect. Stock awards are excluded from the calculation of diluted EPS in the event they are subject to performance conditions or are antidilutive.
|
| Recently Issued Accounting Standards |
Recently Issued Accounting Standards Recently Adopted Accounting Pronouncement In November 2023, the FASB issued ASU No. 2023-07, “Segment Reporting (Topic 280): Improvements to Reportable Segment Disclosure.” The ASU updates reportable segment disclosure requirements, primarily through requiring enhanced disclosures about significant segment expenses and information used to assess segment performance. The amendments do not change how segments are determined, aggregated, or how thresholds are applied to determine reportable segments. We adopted ASU No. 2023-07 during the year ended December 31, 2024. See Note 14 "Segment Reporting" in the accompanying notes to the consolidated financial statements for further detail. Recent Accounting Pronouncements Not Yet Adopted In December 2023, the FASB issued ASU No. 2023-09, “Income Taxes (Topic 740): Improvements to Income Tax Disclosures.” The ASU includes amendments requiring enhanced income tax disclosures, primarily related to standardization and disaggregation of rate reconciliation categories and income taxes paid by jurisdiction. The guidance is effective for fiscal years beginning after December 15, 2024, with early adoption permitted, and should be applied either prospectively or retrospectively. We are currently evaluating the impact of adopting this ASU on our consolidated financial statements and related disclosures. In March 2024, the Securities and Exchange Commission ("SEC") issued its final climate disclosure rules. The rules require disclosure of climate-related information outside of the audited financial statements and disclosure in the footnotes addressing specified financial statement effects of severe weather events and other natural conditions above certain financial thresholds, certain carbon offsets and renewable energy credits or certificates, if material. Disclosure requirements will begin phasing in for fiscal years beginning on or after January 1, 2025. On April 4, 2024, the SEC determined to voluntarily stay the effective date of the final rules pending certain legal challenges. We are currently evaluating the impact of adopting the new rules and continue to monitor the status of the related legal challenges. In November 2024, the FASB issued ASU No. 2024-03, "Disaggregation of Income Statement Expenses (Subtopic 220-40)." The ASU requires public entities to disaggregate, in a tabular presentation, certain income statement expenses into different categories, such as purchases of inventory, employee compensation, depreciation, and intangible asset amortization. The guidance is effective for fiscal years beginning after December 15, 2026, with early adoption permitted, and may be applied retrospectively. We are currently evaluating the impact of adopting the new ASU on our consolidated financial statements and related disclosures. We reviewed all other recently issued accounting pronouncements and concluded that they were either not applicable or not expected to have a significant impact to the consolidated financial statements.
|
| X |
- DefinitionConsideration Received from Vendors.
| Name: |
cmg_ConsiderationReceivedFromVendorsPolicyTextBlock |
| Namespace Prefix: |
cmg_ |
| Data Type: |
dtr-types:textBlockItemType |
| Balance Type: |
na |
| Period Type: |
duration |
|
| X |
- DefinitionFood, beverage and packaging costs.
| Name: |
cmg_FoodBeverageAndPackagingCostsPolicyTextBlock |
| Namespace Prefix: |
cmg_ |
| Data Type: |
dtr-types:textBlockItemType |
| Balance Type: |
na |
| Period Type: |
duration |
|
| X |
- DefinitionOther Operating Costs [Policy Text Block]
| Name: |
cmg_OtherOperatingCostsPolicyTextBlock |
| Namespace Prefix: |
cmg_ |
| Data Type: |
dtr-types:textBlockItemType |
| Balance Type: |
na |
| Period Type: |
duration |
|
| X |
- References
+ Details
| Name: |
us-gaap_AccountingPoliciesAbstract |
| Namespace Prefix: |
us-gaap_ |
| Data Type: |
xbrli:stringItemType |
| Balance Type: |
na |
| Period Type: |
duration |
|
| X |
- DefinitionDisclosure of accounting policy for advertising cost. Reference 1: http://www.xbrl.org/2003/role/disclosureRef
-Name Accounting Standards Codification
-Section 50
-Paragraph 1
-Subparagraph (a)
-SubTopic 35
-Topic 720
-Publisher FASB
-URI https://asc.fasb.org/1943274/2147483406/720-35-50-1
| Name: |
us-gaap_AdvertisingCostsPolicyTextBlock |
| Namespace Prefix: |
us-gaap_ |
| Data Type: |
dtr-types:textBlockItemType |
| Balance Type: |
na |
| Period Type: |
duration |
|
| X |
- DefinitionDisclosure of accounting policy for cash and cash equivalents, including the policy for determining which items are treated as cash equivalents. Other information that may be disclosed includes (1) the nature of any restrictions on the entity's use of its cash and cash equivalents, (2) whether the entity's cash and cash equivalents are insured or expose the entity to credit risk, (3) the classification of any negative balance accounts (overdrafts), and (4) the carrying basis of cash equivalents (for example, at cost) and whether the carrying amount of cash equivalents approximates fair value. Reference 1: http://fasb.org/us-gaap/role/ref/legacyRef
-Name Accounting Standards Codification
-Topic 230
-SubTopic 10
-Section 50
-Paragraph 1
-Publisher FASB
-URI https://asc.fasb.org/1943274/2147482913/230-10-50-1
| Name: |
us-gaap_CashAndCashEquivalentsPolicyTextBlock |
| Namespace Prefix: |
us-gaap_ |
| Data Type: |
dtr-types:textBlockItemType |
| Balance Type: |
na |
| Period Type: |
duration |
|
| X |
- DefinitionEntity's cash and cash equivalents accounting policy with respect to restricted balances. Restrictions may include legally restricted deposits held as compensating balances against short-term borrowing arrangements, contracts entered into with others, or company statements of intention with regard to particular deposits; however, time deposits and short-term certificates of deposit are not generally included in legally restricted deposits. Reference 1: http://fasb.org/us-gaap/role/ref/legacyRef
-Topic 942
-SubTopic 210
-Name Accounting Standards Codification
-Section S99
-Paragraph 1
-Subparagraph (SX 210.9-03(1)(a))
-Publisher FASB
-URI https://asc.fasb.org/1943274/2147478546/942-210-S99-1
Reference 2: http://fasb.org/us-gaap/role/ref/legacyRef
-Name Accounting Standards Codification
-Topic 230
-SubTopic 10
-Section 50
-Paragraph 1
-Publisher FASB
-URI https://asc.fasb.org/1943274/2147482913/230-10-50-1
| Name: |
us-gaap_CashAndCashEquivalentsRestrictedCashAndCashEquivalentsPolicy |
| Namespace Prefix: |
us-gaap_ |
| Data Type: |
dtr-types:textBlockItemType |
| Balance Type: |
na |
| Period Type: |
duration |
|
| X |
- DefinitionDisclosure of accounting policy for commitments and contingencies, which may include policies for recognizing and measuring loss and gain contingencies. Reference 1: http://www.xbrl.org/2003/role/disclosureRef
-Topic 954
-SubTopic 450
-Name Accounting Standards Codification
-Section 50
-Paragraph 1
-Publisher FASB
-URI https://asc.fasb.org/1943274/2147477850/954-450-50-1
Reference 2: http://fasb.org/us-gaap/role/ref/legacyRef
-Name Accounting Standards Codification
-Topic 460
-SubTopic 10
-Section 50
-Paragraph 8
-Subparagraph (b)
-Publisher FASB
-URI https://asc.fasb.org/1943274/2147482425/460-10-50-8
| Name: |
us-gaap_CommitmentsAndContingenciesPolicyTextBlock |
| Namespace Prefix: |
us-gaap_ |
| Data Type: |
dtr-types:textBlockItemType |
| Balance Type: |
na |
| Period Type: |
duration |
|
| X |
- DefinitionDisclosure of accounting policy regarding (1) the principles it follows in consolidating or combining the separate financial statements, including the principles followed in determining the inclusion or exclusion of subsidiaries or other entities in the consolidated or combined financial statements and (2) its treatment of interests (for example, common stock, a partnership interest or other means of exerting influence) in other entities, for example consolidation or use of the equity or cost methods of accounting. The accounting policy may also address the accounting treatment for intercompany accounts and transactions, noncontrolling interest, and the income statement treatment in consolidation for issuances of stock by a subsidiary. Reference 1: http://www.xbrl.org/2003/role/exampleRef
-Topic 235
-SubTopic 10
-Name Accounting Standards Codification
-Section 50
-Paragraph 4
-Subparagraph (a)
-Publisher FASB
-URI https://asc.fasb.org/1943274/2147483426/235-10-50-4
Reference 2: http://fasb.org/us-gaap/role/ref/legacyRef
-Name Accounting Standards Codification
-Topic 810
-SubTopic 10
-Section 50
-Paragraph 1
-Publisher FASB
-URI https://asc.fasb.org/1943274/2147481203/810-10-50-1
| Name: |
us-gaap_ConsolidationPolicyTextBlock |
| Namespace Prefix: |
us-gaap_ |
| Data Type: |
dtr-types:textBlockItemType |
| Balance Type: |
na |
| Period Type: |
duration |
|
| X |
- DefinitionDisclosure of accounting policy for credit loss on financial instrument measured at amortized cost basis, net investment in lease, off-balance sheet credit exposure, and available-for-sale debt security. Includes, but is not limited to, methodology used to estimate allowance for credit loss, how writeoff of uncollectible amount is recognized, and determination of past due status and nonaccrual status. Reference 1: http://www.xbrl.org/2003/role/disclosureRef
-Topic 326
-SubTopic 20
-Name Accounting Standards Codification
-Section S99
-Paragraph 1
-Subparagraph (SAB Topic 6.M.2.Q4)
-Publisher FASB
-URI https://asc.fasb.org/1943274/2147483530/326-20-S99-1
Reference 2: http://www.xbrl.org/2003/role/disclosureRef
-Topic 326
-SubTopic 20
-Name Accounting Standards Codification
-Section 50
-Paragraph 14
-Publisher FASB
-URI https://asc.fasb.org/1943274/2147479319/326-20-50-14
Reference 3: http://www.xbrl.org/2003/role/disclosureRef
-Topic 326
-SubTopic 20
-Name Accounting Standards Codification
-Section 30
-Paragraph 5A
-Publisher FASB
-URI https://asc.fasb.org/1943274/2147479391/326-20-30-5A
Reference 4: http://www.xbrl.org/2003/role/disclosureRef
-Topic 326
-SubTopic 20
-Name Accounting Standards Codification
-Section 50
-Paragraph 3C
-Publisher FASB
-URI https://asc.fasb.org/1943274/2147479319/326-20-50-3C
Reference 5: http://www.xbrl.org/2003/role/disclosureRef
-Topic 326
-SubTopic 20
-Name Accounting Standards Codification
-Section 35
-Paragraph 8A
-Publisher FASB
-URI https://asc.fasb.org/1943274/2147479366/326-20-35-8A
Reference 6: http://www.xbrl.org/2003/role/disclosureRef
-Topic 326
-SubTopic 20
-Name Accounting Standards Codification
-Section 50
-Paragraph 3D
-Publisher FASB
-URI https://asc.fasb.org/1943274/2147479319/326-20-50-3D
Reference 7: http://www.xbrl.org/2003/role/disclosureRef
-Topic 326
-SubTopic 20
-Name Accounting Standards Codification
-Section 45
-Paragraph 5
-Publisher FASB
-URI https://asc.fasb.org/1943274/2147479344/326-20-45-5
Reference 8: http://www.xbrl.org/2003/role/disclosureRef
-Topic 326
-SubTopic 30
-Name Accounting Standards Codification
-Section 30
-Paragraph 1B
-Publisher FASB
-URI https://asc.fasb.org/1943274/2147479175/326-30-30-1B
Reference 9: http://www.xbrl.org/2003/role/disclosureRef
-Topic 326
-SubTopic 30
-Name Accounting Standards Codification
-Section 50
-Paragraph 3C
-Publisher FASB
-URI https://asc.fasb.org/1943274/2147479106/326-30-50-3C
Reference 10: http://www.xbrl.org/2003/role/disclosureRef
-Topic 326
-SubTopic 30
-Name Accounting Standards Codification
-Section 50
-Paragraph 3A
-Publisher FASB
-URI https://asc.fasb.org/1943274/2147479106/326-30-50-3A
Reference 11: http://www.xbrl.org/2003/role/disclosureRef
-Topic 326
-SubTopic 30
-Name Accounting Standards Codification
-Section 50
-Paragraph 3D
-Publisher FASB
-URI https://asc.fasb.org/1943274/2147479106/326-30-50-3D
Reference 12: http://www.xbrl.org/2003/role/disclosureRef
-Topic 326
-SubTopic 30
-Name Accounting Standards Codification
-Section 35
-Paragraph 13A
-Publisher FASB
-URI https://asc.fasb.org/1943274/2147479148/326-30-35-13A
Reference 13: http://www.xbrl.org/2003/role/disclosureRef
-Topic 326
-SubTopic 20
-Name Accounting Standards Codification
-Section 30
-Paragraph 4A
-Publisher FASB
-URI https://asc.fasb.org/1943274/2147479391/326-20-30-4A
Reference 14: http://www.xbrl.org/2003/role/disclosureRef
-Topic 326
-SubTopic 30
-Name Accounting Standards Codification
-Section 35
-Paragraph 7A
-Publisher FASB
-URI https://asc.fasb.org/1943274/2147479148/326-30-35-7A
Reference 15: http://www.xbrl.org/2003/role/disclosureRef
-Topic 326
-SubTopic 20
-Name Accounting Standards Codification
-Section 50
-Paragraph 21
-Publisher FASB
-URI https://asc.fasb.org/1943274/2147479319/326-20-50-21
Reference 16: http://www.xbrl.org/2003/role/disclosureRef
-Topic 326
-SubTopic 20
-Name Accounting Standards Codification
-Section 50
-Paragraph 11
-Publisher FASB
-URI https://asc.fasb.org/1943274/2147479319/326-20-50-11
Reference 17: http://www.xbrl.org/2003/role/disclosureRef
-Topic 326
-SubTopic 30
-Name Accounting Standards Codification
-Section 50
-Paragraph 7
-Publisher FASB
-URI https://asc.fasb.org/1943274/2147479106/326-30-50-7
Reference 18: http://www.xbrl.org/2003/role/disclosureRef
-Topic 326
-SubTopic 20
-Name Accounting Standards Codification
-Section 50
-Paragraph 17
-Publisher FASB
-URI https://asc.fasb.org/1943274/2147479319/326-20-50-17
| Name: |
us-gaap_CreditLossFinancialInstrumentPolicyTextBlock |
| Namespace Prefix: |
us-gaap_ |
| Data Type: |
dtr-types:textBlockItemType |
| Balance Type: |
na |
| Period Type: |
duration |
|
| X |
- DefinitionDisclosure of accounting policy for computing basic and diluted earnings or loss per share for each class of common stock and participating security. Addresses all significant policy factors, including any antidilutive items that have been excluded from the computation and takes into account stock dividends, splits and reverse splits that occur after the balance sheet date of the latest reporting period but before the issuance of the financial statements. Reference 1: http://www.xbrl.org/2003/role/disclosureRef
-Topic 260
-SubTopic 10
-Name Accounting Standards Codification
-Section 50
-Paragraph 1
-Subparagraph (d)
-Publisher FASB
-URI https://asc.fasb.org/1943274/2147482662/260-10-50-1
Reference 2: http://fasb.org/us-gaap/role/ref/legacyRef
-Name Accounting Standards Codification
-Topic 260
-SubTopic 10
-Section 50
-Paragraph 1
-Subparagraph (c)
-Publisher FASB
-URI https://asc.fasb.org/1943274/2147482662/260-10-50-1
Reference 3: http://fasb.org/us-gaap/role/ref/legacyRef
-Name Accounting Standards Codification
-Topic 260
-SubTopic 10
-Section 50
-Paragraph 2
-Publisher FASB
-URI https://asc.fasb.org/1943274/2147482662/260-10-50-2
| Name: |
us-gaap_EarningsPerSharePolicyTextBlock |
| Namespace Prefix: |
us-gaap_ |
| Data Type: |
dtr-types:textBlockItemType |
| Balance Type: |
na |
| Period Type: |
duration |
|
| X |
- DefinitionDisclosure of accounting policy for equity method of accounting for investments and other interests. Investment includes, but is not limited to, unconsolidated subsidiary, corporate joint venture, noncontrolling interest in real estate venture, limited partnership, and limited liability company. Information includes, but is not limited to, ownership percentage, reason equity method is or is not considered appropriate, and accounting policy election for distribution received. Reference 1: http://www.xbrl.org/2003/role/disclosureRef
-Topic 323
-SubTopic 10
-Name Accounting Standards Codification
-Section 50
-Paragraph 3
-Subparagraph (a)(2)
-Publisher FASB
-URI https://asc.fasb.org/1943274/2147481687/323-10-50-3
Reference 2: http://fasb.org/us-gaap/role/ref/legacyRef
-Name Accounting Standards Codification
-Topic 825
-SubTopic 10
-Section 50
-Paragraph 28
-Subparagraph (f)
-Publisher FASB
-URI https://asc.fasb.org/1943274/2147482907/825-10-50-28
Reference 3: http://fasb.org/us-gaap/role/ref/legacyRef
-Name Accounting Standards Codification
-Section 45
-Paragraph 21D
-SubTopic 10
-Topic 230
-Publisher FASB
-URI https://asc.fasb.org/1943274/2147482740/230-10-45-21D
| Name: |
us-gaap_EquityMethodInvestmentsPolicy |
| Namespace Prefix: |
us-gaap_ |
| Data Type: |
dtr-types:textBlockItemType |
| Balance Type: |
na |
| Period Type: |
duration |
|
| X |
- DefinitionDisclosure of accounting policy for fair value measurements of financial and non-financial assets, liabilities and instruments classified in shareholders' equity. Disclosures include, but are not limited to, how an entity that manages a group of financial assets and liabilities on the basis of its net exposure measures the fair value of those assets and liabilities.
| Name: |
us-gaap_FairValueMeasurementPolicyPolicyTextBlock |
| Namespace Prefix: |
us-gaap_ |
| Data Type: |
dtr-types:textBlockItemType |
| Balance Type: |
na |
| Period Type: |
duration |
|
| X |
- DefinitionDisclosure of accounting policy for (1) transactions denominated in a currency other than the reporting enterprise's functional currency, (2) translating foreign currency financial statements that are incorporated into the financial statements of the reporting enterprise by consolidation, combination, or the equity method of accounting, and (3) remeasurement of the financial statements of a foreign reporting enterprise in a hyperinflationary economy. Reference 1: http://www.xbrl.org/2003/role/disclosureRef
-Topic 830
-Name Accounting Standards Codification
-Publisher FASB
-URI https://asc.fasb.org/830/tableOfContent
| Name: |
us-gaap_ForeignCurrencyTransactionsAndTranslationsPolicyTextBlock |
| Namespace Prefix: |
us-gaap_ |
| Data Type: |
dtr-types:textBlockItemType |
| Balance Type: |
na |
| Period Type: |
duration |
|
| X |
- DefinitionDisclosure of accounting policy for goodwill. This accounting policy also may address how an entity assesses and measures impairment of goodwill, how reporting units are determined, how goodwill is allocated to such units, and how the fair values of the reporting units are determined. Reference 1: http://www.xbrl.org/2003/role/exampleRef
-Topic 350
-SubTopic 20
-Name Accounting Standards Codification
-Section 55
-Paragraph 24
-Publisher FASB
-URI https://asc.fasb.org/1943274/2147482548/350-20-55-24
Reference 2: http://www.xbrl.org/2003/role/disclosureRef
-Topic 350
-SubTopic 20
-Name Accounting Standards Codification
-Section 50
-Paragraph 2
-Subparagraph (b)
-Publisher FASB
-URI https://asc.fasb.org/1943274/2147482573/350-20-50-2
Reference 3: http://www.xbrl.org/2003/role/disclosureRef
-Topic 350
-SubTopic 20
-Name Accounting Standards Codification
-Publisher FASB
-URI https://asc.fasb.org/350-20/tableOfContent
| Name: |
us-gaap_GoodwillAndIntangibleAssetsGoodwillPolicy |
| Namespace Prefix: |
us-gaap_ |
| Data Type: |
dtr-types:textBlockItemType |
| Balance Type: |
na |
| Period Type: |
duration |
|
| X |
- DefinitionDisclosure of accounting policy for recognizing and measuring the impairment of long-lived assets. An entity also may disclose its accounting policy for long-lived assets to be sold. This policy excludes goodwill and intangible assets. Reference 1: http://fasb.org/us-gaap/role/ref/legacyRef
-Topic 360
-SubTopic 10
-Name Accounting Standards Codification
-Section S99
-Paragraph 2
-Subparagraph (SAB Topic 5.CC)
-Publisher FASB
-URI https://asc.fasb.org/1943274/2147480091/360-10-S99-2
Reference 2: http://fasb.org/us-gaap/role/ref/legacyRef
-Name Accounting Standards Codification
-Section 05
-Paragraph 4
-SubTopic 10
-Topic 360
-Publisher FASB
-URI https://asc.fasb.org/1943274/2147482338/360-10-05-4
| Name: |
us-gaap_ImpairmentOrDisposalOfLongLivedAssetsPolicyTextBlock |
| Namespace Prefix: |
us-gaap_ |
| Data Type: |
dtr-types:textBlockItemType |
| Balance Type: |
na |
| Period Type: |
duration |
|
| X |
- DefinitionDisclosure of accounting policy for income taxes, which may include its accounting policies for recognizing and measuring deferred tax assets and liabilities and related valuation allowances, recognizing investment tax credits, operating loss carryforwards, tax credit carryforwards, and other carryforwards, methodologies for determining its effective income tax rate and the characterization of interest and penalties in the financial statements. Reference 1: http://www.xbrl.org/2003/role/disclosureRef
-Topic 740
-SubTopic 10
-Name Accounting Standards Codification
-Section 50
-Paragraph 20
-Publisher FASB
-URI https://asc.fasb.org/1943274/2147482685/740-10-50-20
Reference 2: http://www.xbrl.org/2003/role/disclosureRef
-Topic 740
-SubTopic 10
-Name Accounting Standards Codification
-Section 50
-Paragraph 19
-Publisher FASB
-URI https://asc.fasb.org/1943274/2147482685/740-10-50-19
Reference 3: http://www.xbrl.org/2003/role/disclosureRef
-Topic 740
-SubTopic 10
-Name Accounting Standards Codification
-Section 45
-Paragraph 25
-Publisher FASB
-URI https://asc.fasb.org/1943274/2147482525/740-10-45-25
Reference 4: http://www.xbrl.org/2003/role/disclosureRef
-Topic 946
-SubTopic 10
-Name Accounting Standards Codification
-Section S99
-Paragraph 3
-Subparagraph (SX 210.6-03(h)(1))
-Publisher FASB
-URI https://asc.fasb.org/1943274/2147479886/946-10-S99-3
Reference 5: http://www.xbrl.org/2003/role/disclosureRef
-Topic 740
-SubTopic 10
-Name Accounting Standards Codification
-Section 50
-Paragraph 17
-Subparagraph (b)
-Publisher FASB
-URI https://asc.fasb.org/1943274/2147482685/740-10-50-17
Reference 6: http://www.xbrl.org/2003/role/disclosureRef
-Topic 740
-SubTopic 10
-Name Accounting Standards Codification
-Section 50
-Paragraph 9
-Publisher FASB
-URI https://asc.fasb.org/1943274/2147482685/740-10-50-9
Reference 7: http://www.xbrl.org/2003/role/disclosureRef
-Topic 740
-SubTopic 10
-Name Accounting Standards Codification
-Section 45
-Paragraph 28
-Publisher FASB
-URI https://asc.fasb.org/1943274/2147482525/740-10-45-28
Reference 8: http://www.xbrl.org/2003/role/disclosureRef
-Topic 220
-SubTopic 10
-Name Accounting Standards Codification
-Section 50
-Paragraph 1
-Publisher FASB
-URI https://asc.fasb.org/1943274/2147482765/220-10-50-1
| Name: |
us-gaap_IncomeTaxPolicyTextBlock |
| Namespace Prefix: |
us-gaap_ |
| Data Type: |
dtr-types:textBlockItemType |
| Balance Type: |
na |
| Period Type: |
duration |
|
| X |
- DefinitionDisclosure of inventory accounting policy for inventory classes, including, but not limited to, basis for determining inventory amounts, methods by which amounts are added and removed from inventory classes, loss recognition on impairment of inventories, and situations in which inventories are stated above cost. Reference 1: http://www.xbrl.org/2003/role/disclosureRef
-Topic 210
-SubTopic 10
-Name Accounting Standards Codification
-Section S99
-Paragraph 1
-Subparagraph (SX 210.5-02(6)(b))
-Publisher FASB
-URI https://asc.fasb.org/1943274/2147480566/210-10-S99-1
Reference 2: http://www.xbrl.org/2003/role/disclosureRef
-Topic 330
-SubTopic 10
-Name Accounting Standards Codification
-Section 50
-Paragraph 1
-Publisher FASB
-URI https://asc.fasb.org/1943274/2147483080/330-10-50-1
Reference 3: http://www.xbrl.org/2003/role/disclosureRef
-Topic 210
-SubTopic 10
-Name Accounting Standards Codification
-Section 50
-Paragraph 1
-Publisher FASB
-URI https://asc.fasb.org/1943274/2147483489/210-10-50-1
Reference 4: http://www.xbrl.org/2003/role/exampleRef
-Topic 235
-SubTopic 10
-Name Accounting Standards Codification
-Section 50
-Paragraph 4
-Subparagraph (d)
-Publisher FASB
-URI https://asc.fasb.org/1943274/2147483426/235-10-50-4
Reference 5: http://www.xbrl.org/2003/role/disclosureRef
-Topic 912
-SubTopic 330
-Name Accounting Standards Codification
-Section 50
-Paragraph 1
-Publisher FASB
-URI https://asc.fasb.org/1943274/2147478411/912-330-50-1
Reference 6: http://www.xbrl.org/2003/role/disclosureRef
-Topic 330
-Name Accounting Standards Codification
-Publisher FASB
-URI https://asc.fasb.org/330/tableOfContent
Reference 7: http://www.xbrl.org/2003/role/disclosureRef
-Topic 330
-SubTopic 10
-Name Accounting Standards Codification
-Section 50
-Paragraph 4
-Publisher FASB
-URI https://asc.fasb.org/1943274/2147483080/330-10-50-4
Reference 8: http://www.xbrl.org/2003/role/disclosureRef
-Name Accounting Standards Codification
-Section 45
-Paragraph 6
-Subparagraph (a)
-SubTopic 10
-Topic 270
-Publisher FASB
-URI https://asc.fasb.org/1943274/2147482989/270-10-45-6
| Name: |
us-gaap_InventoryPolicyTextBlock |
| Namespace Prefix: |
us-gaap_ |
| Data Type: |
dtr-types:textBlockItemType |
| Balance Type: |
na |
| Period Type: |
duration |
|
| X |
- DefinitionDisclosure of accounting policy for investment in financial asset. Reference 1: http://www.xbrl.org/2003/role/disclosureRef
-Topic 944
-SubTopic 220
-Name Accounting Standards Codification
-Section S99
-Paragraph 1
-Subparagraph (SX 210.7-04(3)(b))
-Publisher FASB
-URI https://asc.fasb.org/1943274/2147477250/944-220-S99-1
Reference 2: http://www.xbrl.org/2003/role/disclosureRef
-Topic 946
-SubTopic 10
-Name Accounting Standards Codification
-Section S99
-Paragraph 3
-Subparagraph (SX 210.6-03(d))
-Publisher FASB
-URI https://asc.fasb.org/1943274/2147479886/946-10-S99-3
Reference 3: http://www.xbrl.org/2003/role/disclosureRef
-Topic 946
-SubTopic 10
-Name Accounting Standards Codification
-Section S99
-Paragraph 3
-Subparagraph (SX 210.6-03(f)(1))
-Publisher FASB
-URI https://asc.fasb.org/1943274/2147479886/946-10-S99-3
Reference 4: http://www.xbrl.org/2003/role/disclosureRef
-Topic 946
-SubTopic 10
-Name Accounting Standards Codification
-Section S99
-Paragraph 3
-Subparagraph (SX 210.6-03(f)(2))
-Publisher FASB
-URI https://asc.fasb.org/1943274/2147479886/946-10-S99-3
Reference 5: http://www.xbrl.org/2003/role/disclosureRef
-Topic 946
-SubTopic 10
-Name Accounting Standards Codification
-Section S99
-Paragraph 3
-Subparagraph (SX 210.6-03(f)(3))
-Publisher FASB
-URI https://asc.fasb.org/1943274/2147479886/946-10-S99-3
Reference 6: http://www.xbrl.org/2003/role/disclosureRef
-Topic 946
-SubTopic 320
-Name Accounting Standards Codification
-Section S99
-Paragraph 12
-Subparagraph (i)
-Publisher FASB
-URI https://asc.fasb.org/1943274/2147477271/946-320-S99-12
Reference 7: http://www.xbrl.org/2003/role/disclosureRef
-Topic 946
-SubTopic 320
-Name Accounting Standards Codification
-Section S99
-Paragraph 19
-Subparagraph (2)
-Publisher FASB
-URI https://asc.fasb.org/1943274/2147477271/946-320-S99-19
| Name: |
us-gaap_InvestmentPolicyTextBlock |
| Namespace Prefix: |
us-gaap_ |
| Data Type: |
dtr-types:textBlockItemType |
| Balance Type: |
na |
| Period Type: |
duration |
|
| X |
- DefinitionDisclosure of accounting policy for leasing arrangement entered into by lessee. Reference 1: http://www.xbrl.org/2003/role/disclosureRef
-Topic 842
-SubTopic 20
-Name Accounting Standards Codification
-Section 50
-Paragraph 1
-Subparagraph (b)
-Publisher FASB
-URI https://asc.fasb.org/1943274/2147478964/842-20-50-1
| Name: |
us-gaap_LesseeLeasesPolicyTextBlock |
| Namespace Prefix: |
us-gaap_ |
| Data Type: |
dtr-types:textBlockItemType |
| Balance Type: |
na |
| Period Type: |
duration |
|
| X |
- DefinitionDisclosure of accounting policy for estimating its liability as of the balance sheet date for the ultimate cost of settling reported and unreported claims incurred and claims adjustment expenses (including effects of inflation and other societal and economic factors). Reference 1: http://www.xbrl.org/2009/role/commonPracticeRef
-Topic 944
-SubTopic 40
-Name Accounting Standards Codification
-Publisher FASB
-URI https://asc.fasb.org/944-40/tableOfContent
| Name: |
us-gaap_LiabilityReserveEstimatePolicy |
| Namespace Prefix: |
us-gaap_ |
| Data Type: |
dtr-types:textBlockItemType |
| Balance Type: |
na |
| Period Type: |
duration |
|
| X |
- DefinitionDisclosure of accounting policy pertaining to new accounting pronouncements that may impact the entity's financial reporting. Includes, but is not limited to, quantification of the expected or actual impact.
| Name: |
us-gaap_NewAccountingPronouncementsPolicyPolicyTextBlock |
| Namespace Prefix: |
us-gaap_ |
| Data Type: |
dtr-types:textBlockItemType |
| Balance Type: |
na |
| Period Type: |
duration |
|
| X |
- DefinitionDisclosure of accounting policy for long-lived, physical asset used in normal conduct of business and not intended for resale. Includes, but is not limited to, work of art, historical treasure, and similar asset classified as collections. Reference 1: http://fasb.org/us-gaap/role/ref/legacyRef
-Name Accounting Standards Codification
-Section 50
-Paragraph 1
-SubTopic 10
-Topic 360
-Publisher FASB
-URI https://asc.fasb.org/1943274/2147482099/360-10-50-1
Reference 2: http://www.xbrl.org/2003/role/disclosureRef
-Topic 944
-SubTopic 210
-Name Accounting Standards Codification
-Section S99
-Paragraph 1
-Subparagraph (SX 210.7-03(a)(8)(a))
-Publisher FASB
-URI https://asc.fasb.org/1943274/2147478777/944-210-S99-1
Reference 3: http://www.xbrl.org/2003/role/disclosureRef
-Name Accounting Standards Codification
-Section 50
-Paragraph 6
-SubTopic 360
-Topic 958
-Publisher FASB
-URI https://asc.fasb.org/1943274/2147477798/958-360-50-6
Reference 4: http://www.xbrl.org/2003/role/disclosureRef
-Name Accounting Standards Codification
-Section 50
-Paragraph 1
-Subparagraph (d)
-SubTopic 360
-Topic 958
-Publisher FASB
-URI https://asc.fasb.org/1943274/2147477798/958-360-50-1
| Name: |
us-gaap_PropertyPlantAndEquipmentPolicyTextBlock |
| Namespace Prefix: |
us-gaap_ |
| Data Type: |
dtr-types:textBlockItemType |
| Balance Type: |
na |
| Period Type: |
duration |
|
| X |
- DefinitionDisclosure of accounting policy for receivable. Includes, but is not limited to, accounts receivable and financing receivable. Reference 1: http://www.xbrl.org/2009/role/commonPracticeRef
-Topic 310
-SubTopic 10
-Name Accounting Standards Codification
-Section 50
-Paragraph 2
-Subparagraph (c)
-Publisher FASB
-URI https://asc.fasb.org/1943274/2147481962/310-10-50-2
Reference 2: http://www.xbrl.org/2003/role/disclosureRef
-Topic 310
-SubTopic 20
-Name Accounting Standards Codification
-Section 50
-Paragraph 1
-Publisher FASB
-URI https://asc.fasb.org/1943274/2147481569/310-20-50-1
Reference 3: http://www.xbrl.org/2003/role/disclosureRef
-Topic 310
-SubTopic 10
-Name Accounting Standards Codification
-Section 50
-Paragraph 2
-Subparagraph (d)
-Publisher FASB
-URI https://asc.fasb.org/1943274/2147481962/310-10-50-2
Reference 4: http://www.xbrl.org/2003/role/disclosureRef
-Topic 310
-SubTopic 10
-Name Accounting Standards Codification
-Section 50
-Paragraph 2
-Subparagraph (b)
-Publisher FASB
-URI https://asc.fasb.org/1943274/2147481962/310-10-50-2
Reference 5: http://www.xbrl.org/2003/role/disclosureRef
-Topic 310
-SubTopic 10
-Name Accounting Standards Codification
-Section 50
-Paragraph 2
-Subparagraph (a)
-Publisher FASB
-URI https://asc.fasb.org/1943274/2147481962/310-10-50-2
| Name: |
us-gaap_ReceivablesPolicyTextBlock |
| Namespace Prefix: |
us-gaap_ |
| Data Type: |
dtr-types:textBlockItemType |
| Balance Type: |
na |
| Period Type: |
duration |
|
| X |
- DefinitionDisclosure of accounting policy for revenue. Includes revenue from contract with customer and from other sources. Reference 1: http://www.xbrl.org/2003/role/disclosureRef
-Topic 946
-SubTopic 220
-Name Accounting Standards Codification
-Section S99
-Paragraph 1
-Subparagraph (SX 210.6-07(1))
-Publisher FASB
-URI https://asc.fasb.org/1943274/2147479134/946-220-S99-1
Reference 2: http://www.xbrl.org/2003/role/exampleRef
-Topic 235
-SubTopic 10
-Name Accounting Standards Codification
-Section 50
-Paragraph 4
-Subparagraph (f)
-Publisher FASB
-URI https://asc.fasb.org/1943274/2147483426/235-10-50-4
Reference 3: http://www.xbrl.org/2003/role/exampleRef
-Name Accounting Standards Codification
-Section 50
-Paragraph 4
-Subparagraph (e)
-SubTopic 10
-Topic 235
-Publisher FASB
-URI https://asc.fasb.org/1943274/2147483426/235-10-50-4
| Name: |
us-gaap_RevenueRecognitionPolicyTextBlock |
| Namespace Prefix: |
us-gaap_ |
| Data Type: |
dtr-types:textBlockItemType |
| Balance Type: |
na |
| Period Type: |
duration |
|
| X |
- DefinitionDisclosure of accounting policy for award under share-based payment arrangement. Includes, but is not limited to, methodology and assumption used in measuring cost. Reference 1: http://www.xbrl.org/2003/role/disclosureRef
-Topic 718
-SubTopic 10
-Name Accounting Standards Codification
-Section 50
-Paragraph 2
-Subparagraph (f)(1)
-Publisher FASB
-URI https://asc.fasb.org/1943274/2147480429/718-10-50-2
Reference 2: http://www.xbrl.org/2003/role/disclosureRef
-Topic 718
-SubTopic 10
-Name Accounting Standards Codification
-Section 50
-Paragraph 2
-Subparagraph (f)(2)(i)
-Publisher FASB
-URI https://asc.fasb.org/1943274/2147480429/718-10-50-2
Reference 3: http://www.xbrl.org/2003/role/disclosureRef
-Topic 718
-SubTopic 10
-Name Accounting Standards Codification
-Section 50
-Paragraph 2
-Subparagraph (f)(2)(ii)
-Publisher FASB
-URI https://asc.fasb.org/1943274/2147480429/718-10-50-2
Reference 4: http://www.xbrl.org/2003/role/disclosureRef
-Topic 718
-SubTopic 10
-Name Accounting Standards Codification
-Section 50
-Paragraph 2
-Subparagraph (f)(2)(v)
-Publisher FASB
-URI https://asc.fasb.org/1943274/2147480429/718-10-50-2
Reference 5: http://www.xbrl.org/2003/role/disclosureRef
-Topic 718
-SubTopic 10
-Name Accounting Standards Codification
-Section S99
-Paragraph 1
-Subparagraph (SAB Topic 14.C.Q3)
-Publisher FASB
-URI https://asc.fasb.org/1943274/2147479830/718-10-S99-1
Reference 6: http://www.xbrl.org/2003/role/disclosureRef
-Topic 718
-SubTopic 10
-Name Accounting Standards Codification
-Section S99
-Paragraph 1
-Subparagraph (SAB Topic 14.D.1.Q5)
-Publisher FASB
-URI https://asc.fasb.org/1943274/2147479830/718-10-S99-1
Reference 7: http://www.xbrl.org/2003/role/disclosureRef
-Topic 718
-SubTopic 10
-Name Accounting Standards Codification
-Section S99
-Paragraph 1
-Subparagraph (SAB Topic 14.D.3.Q2)
-Publisher FASB
-URI https://asc.fasb.org/1943274/2147479830/718-10-S99-1
Reference 8: http://www.xbrl.org/2003/role/disclosureRef
-Topic 718
-SubTopic 10
-Name Accounting Standards Codification
-Section S99
-Paragraph 1
-Subparagraph (SAB Topic 14.D.2.Q6)
-Publisher FASB
-URI https://asc.fasb.org/1943274/2147479830/718-10-S99-1
Reference 9: http://www.xbrl.org/2003/role/disclosureRef
-Topic 718
-Name Accounting Standards Codification
-Publisher FASB
-URI https://asc.fasb.org/718/tableOfContent
Reference 10: http://www.xbrl.org/2003/role/disclosureRef
-Topic 718
-SubTopic 10
-Name Accounting Standards Codification
-Section 50
-Paragraph 2
-Subparagraph (b)
-Publisher FASB
-URI https://asc.fasb.org/1943274/2147480429/718-10-50-2
Reference 11: http://www.xbrl.org/2003/role/disclosureRef
-Topic 718
-SubTopic 10
-Name Accounting Standards Codification
-Section 50
-Paragraph 2
-Subparagraph (f)(2)
-Publisher FASB
-URI https://asc.fasb.org/1943274/2147480429/718-10-50-2
| Name: |
us-gaap_ShareBasedCompensationOptionAndIncentivePlansPolicy |
| Namespace Prefix: |
us-gaap_ |
| Data Type: |
dtr-types:textBlockItemType |
| Balance Type: |
na |
| Period Type: |
duration |
|
| X |
- DefinitionDisclosure of accounting policy for start-up costs. Start-up activities include those one-time activities related to opening a new facility, introducing a new product or service, conducting business in a new territory, conducting business with a new class of customer or beneficiary, initiating a new process in an existing facility, or commencing some new operation. Start-up activities include activities related to organizing a new entity (commonly referred to as organization costs).
| Name: |
us-gaap_StartUpActivitiesCostPolicy |
| Namespace Prefix: |
us-gaap_ |
| Data Type: |
dtr-types:textBlockItemType |
| Balance Type: |
na |
| Period Type: |
duration |
|
| X |
- DefinitionDisclosure of accounting policy for the use of estimates in the preparation of financial statements in conformity with generally accepted accounting principles. Reference 1: http://fasb.org/us-gaap/role/ref/legacyRef
-Name Accounting Standards Codification
-Topic 275
-SubTopic 10
-Section 50
-Paragraph 9
-Publisher FASB
-URI https://asc.fasb.org/1943274/2147482861/275-10-50-9
Reference 2: http://fasb.org/us-gaap/role/ref/legacyRef
-Name Accounting Standards Codification
-Topic 275
-SubTopic 10
-Section 50
-Paragraph 4
-Publisher FASB
-URI https://asc.fasb.org/1943274/2147482861/275-10-50-4
Reference 3: http://www.xbrl.org/2003/role/disclosureRef
-Name Accounting Standards Codification
-Section 50
-Paragraph 1
-Subparagraph (b)
-SubTopic 10
-Topic 275
-Publisher FASB
-URI https://asc.fasb.org/1943274/2147482861/275-10-50-1
Reference 4: http://www.xbrl.org/2003/role/disclosureRef
-Name Accounting Standards Codification
-Section 50
-Paragraph 1
-Subparagraph (c)
-SubTopic 10
-Topic 275
-Publisher FASB
-URI https://asc.fasb.org/1943274/2147482861/275-10-50-1
Reference 5: http://www.xbrl.org/2003/role/disclosureRef
-Name Accounting Standards Codification
-Section 50
-Paragraph 11
-SubTopic 10
-Topic 275
-Publisher FASB
-URI https://asc.fasb.org/1943274/2147482861/275-10-50-11
Reference 6: http://www.xbrl.org/2003/role/disclosureRef
-Name Accounting Standards Codification
-Section 50
-Paragraph 12
-SubTopic 10
-Topic 275
-Publisher FASB
-URI https://asc.fasb.org/1943274/2147482861/275-10-50-12
Reference 7: http://fasb.org/us-gaap/role/ref/legacyRef
-Name Accounting Standards Codification
-Topic 275
-SubTopic 10
-Section 50
-Paragraph 8
-Publisher FASB
-URI https://asc.fasb.org/1943274/2147482861/275-10-50-8
| Name: |
us-gaap_UseOfEstimates |
| Namespace Prefix: |
us-gaap_ |
| Data Type: |
dtr-types:textBlockItemType |
| Balance Type: |
na |
| Period Type: |
duration |
|
v3.25.0.1
| X |
- DefinitionProperty, Plant and Equipment, Useful Life [Table Text Block]
| Name: |
cmg_PropertyPlantAndEquipmentUsefulLifeTableTextBlock |
| Namespace Prefix: |
cmg_ |
| Data Type: |
dtr-types:textBlockItemType |
| Balance Type: |
na |
| Period Type: |
duration |
|
| X |
- References
+ Details
| Name: |
us-gaap_AccountingPoliciesAbstract |
| Namespace Prefix: |
us-gaap_ |
| Data Type: |
xbrli:stringItemType |
| Balance Type: |
na |
| Period Type: |
duration |
|
v3.25.0.1
Supplemental Balance Sheet Information (Tables)
|
12 Months Ended |
Dec. 31, 2024 |
|---|
| Supplemental Balance Sheet Information [Abstract] |
|
| Schedule of Prepaid Expenses and Other Current Assets |
Prepaid expenses and other current assets were as follows: | | | | | | | | | | | | | December 31, | | 2024 | | 2023 | | Prepaid expenses | $ | 80,253 | | $ | 97,670 | | Other current assets | 17,285 | | 19,792 | | Prepaid expenses and other current assets | $ | 97,538 | | $ | 117,462 |
|
| Schedule of Leasehold Improvements, Property, and Equipment |
Leasehold improvements, property and equipment, net were as follows: | | | | | | | | | | | | | December 31, | | 2024 | | 2023 | | Land | $ | 12,943 | | $ | 12,943 | | Leasehold improvements and buildings | 2,918,408 | | 2,595,866 | | Furniture and fixtures | 293,841 | | 267,294 | | Equipment | 1,221,290 | | 1,114,236 | | Construction in Progress | 192,945 | | 161,721 | | Leasehold improvements, property and equipment, gross | 4,639,427 | | 4,152,060 | | Accumulated depreciation | (2,249,301) | | | (1,982,022) | | | Leasehold improvements, property and equipment, net | $ | 2,390,126 | | $ | 2,170,038 |
|
| Schedule of Accrued Payroll and Benefits |
Accrued payroll and benefits were as follows: | | | | | | | | | | | | | December 31, | | 2024 | | 2023 | | Workers' compensation liability | $ | 35,242 | | $ | 30,520 | | Accrued payroll, bonuses and taxes | 195,660 | | 170,251 | | Other accrued payroll and benefits | 31,011 | | 26,766 | | Accrued payroll and benefits | $ | 261,913 | | $ | 227,537 |
|
| Schedule of Accrued Liabilities |
Accrued liabilities were as follows: | | | | | | | | | | | | | December 31, | | 2024 | | 2023 | | Sales and use tax payable | $ | 47,206 | | $ | 42,071 | | General, product and automobile insurance reserves | 34,404 | | 30,169 | | Other accrued liabilities | 98,137 | | 75,448 | | Accrued liabilities | $ | 179,747 | | $ | 147,688 |
|
| X |
- DefinitionSchedule of Accrued Payroll and Benefits [Table Text Block]
| Name: |
cmg_ScheduleOfAccruedPayrollAndBenefitsTableTextBlock |
| Namespace Prefix: |
cmg_ |
| Data Type: |
dtr-types:textBlockItemType |
| Balance Type: |
na |
| Period Type: |
duration |
|
| X |
- DefinitionTabular disclosure of the amounts paid in advance for capitalized costs that will be expensed with the passage of time or the occurrence of a triggering event, and will be charged against earnings within one year or the normal operating cycle, if longer; the aggregate carrying amount of current assets, not separately presented elsewhere in the balance sheet; and other deferred costs.
| Name: |
us-gaap_DeferredCostsCapitalizedPrepaidAndOtherAssetsDisclosureTextBlock |
| Namespace Prefix: |
us-gaap_ |
| Data Type: |
dtr-types:textBlockItemType |
| Balance Type: |
na |
| Period Type: |
duration |
|
| X |
- DefinitionTabular disclosure of physical assets used in the normal conduct of business and not intended for resale. Includes, but is not limited to, balances by class of assets, depreciation and depletion expense and method used, including composite depreciation, and accumulated deprecation. Reference 1: http://fasb.org/us-gaap/role/ref/legacyRef
-Name Accounting Standards Codification
-Section 50
-Paragraph 1
-SubTopic 10
-Topic 360
-Publisher FASB
-URI https://asc.fasb.org/1943274/2147482099/360-10-50-1
| Name: |
us-gaap_PropertyPlantAndEquipmentTextBlock |
| Namespace Prefix: |
us-gaap_ |
| Data Type: |
dtr-types:textBlockItemType |
| Balance Type: |
na |
| Period Type: |
duration |
|
| X |
- DefinitionTabular disclosure of the components of accrued liabilities.
| Name: |
us-gaap_ScheduleOfAccruedLiabilitiesTableTextBlock |
| Namespace Prefix: |
us-gaap_ |
| Data Type: |
dtr-types:textBlockItemType |
| Balance Type: |
na |
| Period Type: |
duration |
|
v3.25.0.1
Revenue Recognition (Tables)
|
12 Months Ended |
Dec. 31, 2024 |
|---|
| Revenue from Contract with Customer [Abstract] |
|
| Schedule of Liability Included in Unearned Revenue |
The gift card liability included in unearned revenue on the consolidated balance sheets was as follows: | | | | | | | | | | | | | | December 31, | | | 2024 | | 2023 | | Gift card liability | $ | 181,771 | | | $ | 164,930 | |
|
| Schedule of Revenue Recognized from Liability Balances |
Revenue recognized from the redemption of gift cards that was included in unearned revenue at the beginning of the year was as follows: | | | | | | | | | | | | | | | | | | | | Year ended December 31, | | | 2024 | | 2023 | | 2022 | | Revenue recognized from gift card liability balance at the beginning of the year | $ | 80,067 | | $ | 61,389 | | $ | 59,175 |
|
| Schedule of Changes in Liability Balance |
Changes in our Chipotle Rewards liability included in unearned revenue on the consolidated balance sheets were as follows: | | | | | | | | | | | | | | | | | | | | Year ended December 31, | | | 2024 | | 2023 | | 2022 | | Chipotle Rewards liability, beginning balance | $ | 44,750 | | $ | 38,057 | | $ | 25,572 | | Revenue deferred | 164,986 | | 135,490 | | 121,406 | | Revenue recognized | (152,930) | | | (128,797) | | | (108,921) | | | Chipotle Rewards liability, ending balance | $ | 56,806 | | $ | 44,750 | | $ | 38,057 |
|
| X |
- DefinitionSummary Of Liability Included In Unearned Revenue [Table Text Block]
| Name: |
cmg_SummaryOfLiabilityIncludedInUnearnedRevenueTableTextBlock |
| Namespace Prefix: |
cmg_ |
| Data Type: |
dtr-types:textBlockItemType |
| Balance Type: |
na |
| Period Type: |
duration |
|
| X |
- DefinitionTabular disclosure of receivable, contract asset, and contract liability from contract with customer. Includes, but is not limited to, change in contract asset and contract liability. Reference 1: http://www.xbrl.org/2009/role/commonPracticeRef
-Topic 606
-SubTopic 10
-Name Accounting Standards Codification
-Section 50
-Paragraph 10
-Publisher FASB
-URI https://asc.fasb.org/1943274/2147479806/606-10-50-10
| Name: |
us-gaap_ContractWithCustomerAssetAndLiabilityTableTextBlock |
| Namespace Prefix: |
us-gaap_ |
| Data Type: |
dtr-types:textBlockItemType |
| Balance Type: |
na |
| Period Type: |
duration |
|
| X |
- DefinitionTabular disclosure of disaggregation of revenue into categories depicting how nature, amount, timing, and uncertainty of revenue and cash flows are affected by economic factor. Reference 1: http://www.xbrl.org/2009/role/commonPracticeRef
-Topic 606
-SubTopic 10
-Name Accounting Standards Codification
-Section 50
-Paragraph 5
-Publisher FASB
-URI https://asc.fasb.org/1943274/2147479806/606-10-50-5
| Name: |
us-gaap_DisaggregationOfRevenueTableTextBlock |
| Namespace Prefix: |
us-gaap_ |
| Data Type: |
dtr-types:textBlockItemType |
| Balance Type: |
na |
| Period Type: |
duration |
|
| X |
- References
+ Details
| Name: |
us-gaap_RevenueFromContractWithCustomerAbstract |
| Namespace Prefix: |
us-gaap_ |
| Data Type: |
xbrli:stringItemType |
| Balance Type: |
na |
| Period Type: |
duration |
|
v3.25.0.1
Fair Value Measurements (Tables)
|
12 Months Ended |
Dec. 31, 2024 |
|---|
| Fair Value Disclosures [Abstract] |
|
| Schedule of Cash, Cash Equivalents and Debt Investments by Significant Category |
The following tables show our cash, cash equivalents, and debt investments by significant investment category as of December 31, 2024 and 2023: | | | | | | | | | | | | | | | | | | | | | | | | | | | | | | | | | | | | | | | | | | | December 31, 2024 | | Adjusted cost | | Unrealized Gains | | Unrealized Losses | | Fair Value | | Cash and Cash Equivalents | | Current Investments | | Long-term Investments | | Cash | $ | 95,969 | | | $ | - | | | $ | - | | | $ | 95,969 | | | $ | 95,969 | | | $ | - | | | $ | - | | | Level 1 | | | | | | | | | | | | | | | Money market funds | 574,689 | | | - | | | - | | | 574,689 | | | 574,689 | | | - | | | - | | | Time deposits | 77,879 | | | - | | | - | | | 77,879 | | | 77,879 | | | - | | | - | | | U.S. Treasury securities | 1,404,777 | | | 4,831 | | | 693 | | | 1,408,915 | | | - | | | 635,392 | | | 769,385 | | | Corporate debt securities | 48,210 | | | 116 | | | - | | | 48,326 | | | - | | | 34,736 | | | 13,474 | | | Subtotal | 2,105,555 | | | 4,947 | | | 693 | | | 2,109,809 | | | 652,568 | | | 670,128 | | | 782,859 | | | Level 3 | | | | | | | | | | | | | | Corporate debt security(1) | 16,401 | | | 11 | | | - | | | 16,412 | | | - | | | 2,000 | | | 14,401 | | Notes receivable(2) | 3,763 | | | 250 | | | - | | | 4,013 | | | - | | | 2,250 | | | 1,763 | | | Subtotal | 20,164 | | | 261 | | | - | | | 20,425 | | | - | | | 4,250 | | | 16,164 | | | Total | $ | 2,221,688 | | | $ | 5,208 | | | $ | 693 | | | $ | 2,226,203 | | | $ | 748,537 | | | $ | 674,378 | | | $ | 799,023 | |
| | | | | | | | | | | | | | | | | | | | | | | | | | | | | | | | | | | | | | | | | | | December 31, 2023 | | Adjusted cost | | Unrealized Gains | | Unrealized Losses | | Fair Value | | Cash and Cash Equivalents | | Current Investments | | Long-term Investments | | Cash | $ | 128,458 | | | $ | - | | | $ | - | | | $ | 128,458 | | | $ | 128,458 | | | $ | - | | | $ | - | | | Level 1 | | | | | | | | | | | | | | | Money market funds | 355,872 | | | - | | | - | | | 355,872 | | | 355,872 | | | - | | | - | | | Time deposits | 76,279 | | | - | | | - | | | 76,279 | | | 76,279 | | | - | | | - | | | U.S. Treasury securities | 1,200,658 | | | 4,352 | | | 4,083 | | | 1,200,927 | | | - | | | 731,339 | | | 469,319 | | | Corporate debt securities | 19,755 | | | 13 | | | 7 | | | 19,761 | | | - | | | - | | | 19,755 | | | Subtotal | 1,652,564 | | | 4,365 | | | 4,090 | | | 1,652,839 | | | 432,151 | | | 731,339 | | | 489,074 | | | Level 3 | | | | | | | | | | | | | | Corporate debt security(1) | 17,401 | | | - | | | 27 | | | 17,374 | | | - | | | 999 | | | 16,402 | | Notes receivable(2) | 14,500 | | | 1,289 | | | 141 | | | 15,648 | | | - | | | 2,500 | | | 13,148 | | | Subtotal | 31,901 | | | 1,289 | | | 168 | | | 33,022 | | | - | | | 3,499 | | | 29,550 | | | Total | $ | 1,812,923 | | | $ | 5,654 | | | $ | 4,258 | | | $ | 1,814,319 | | | $ | 560,609 | | | $ | 734,838 | | | $ | 518,624 | |
(1)The fair value of the corporate debt security is measured using Level 3 (unobservable) inputs. We determined the fair value for the corporate debt security using an internally-developed valuation model and unobservable inputs include credit and liquidity spreads and effective maturity. (2)We have elected to measure our investment in convertible notes receivable of private companies at fair value under the fair value option. The fair value of the notes receivable are measured using Level 3 (unobservable) inputs. We determined the fair value for the notes receivable using an internally-developed valuation model and unobservable inputs include estimates of the equity value of the underlying business and the timing and probability of future financing events.
|
| X |
- DefinitionSchedule of Cash, Cash Equivalents and Debt Investments by Significant Category
| Name: |
cmg_ScheduleOfCashCashEquivalentsAndDebtInvestmentsBySignificantCategoryTableTextBlock |
| Namespace Prefix: |
cmg_ |
| Data Type: |
dtr-types:textBlockItemType |
| Balance Type: |
na |
| Period Type: |
duration |
|
| X |
- References
+ Details
| Name: |
us-gaap_FairValueDisclosuresAbstract |
| Namespace Prefix: |
us-gaap_ |
| Data Type: |
xbrli:stringItemType |
| Balance Type: |
na |
| Period Type: |
duration |
|
v3.25.0.1
| X |
- DefinitionSchedule of Equity Investments [Table Text Block]
| Name: |
cmg_ScheduleOfEquityInvestmentsTableTextBlock |
| Namespace Prefix: |
cmg_ |
| Data Type: |
dtr-types:textBlockItemType |
| Balance Type: |
na |
| Period Type: |
duration |
|
| X |
- References
+ Details
| Name: |
us-gaap_InvestmentsDebtAndEquitySecuritiesAbstract |
| Namespace Prefix: |
us-gaap_ |
| Data Type: |
xbrli:stringItemType |
| Balance Type: |
na |
| Period Type: |
duration |
|
v3.25.0.1
Income Taxes (Tables)
|
12 Months Ended |
Dec. 31, 2024 |
|---|
| Income Tax Disclosure [Abstract] |
|
| Summary of Income |
Income before income taxes, classified by source of income, was as follows: | | | | | | | | | | | | | | | | | | | Year ended December 31, | | 2024 | | 2023 | | 2022 | | Domestic | $ | 2,031,759 | | $ | 1,637,756 | | $ | 1,192,004 | | Foreign | (21,529) | | | (17,250) | | | (10,473) | | | Income before income taxes | $ | 2,010,230 | | $ | 1,620,506 | | $ | 1,181,531 |
|
| Schedule of Components of Provision for Income Taxes |
The components of the provision for income taxes were as follows: | | | | | | | | | | | | | | | | | | | Year ended December 31, | | 2024 | | 2023 | | 2022 | | Current tax: | | | | | | | U.S. Federal | $ | 412,943 | | | $ | 314,757 | | | $ | 246,210 | | U.S. State and Local | 104,478 | | | 85,355 | | | 79,041 | | | Foreign | 1,636 | | | 1,162 | | | 374 | | | 519,057 | | | 401,274 | | | 325,625 | | Deferred tax: | | | | | | | U.S. Federal | (32,751) | | (7,992) | | (23,502) | | | U.S. State and Local | (10,195) | | (1,532) | | | (19,940) | | Foreign | (4,385) | | | (7,606) | | 3,771 | | (47,331) | | (17,130) | | (39,671) | | | Valuation allowance | 4,394 | | 7,625 | | | (3,524) | | | Provision for income taxes | $ | 476,120 | | | $ | 391,769 | | | $ | 282,430 | |
|
| Schedule of Effective Tax Rate |
The effective tax rate differs from the statutory tax rates as follows: | | | | | | | | | | | | | | | | | | | Year ended December 31, | | 2024 | | 2023 | | 2022 | | Statutory U.S. federal income tax rate | 21.0% | | 21.0% | | 21.0% | | State income tax, net of related federal income tax benefit | 3.7 | | 4.0 | | 3.8 | | Federal tax credits | (0.9) | | | (1.0) | | | (1.0) | | | Executive compensation disallowed | 0.5 | | 0.8 | | 0.8 | | Valuation allowance | 0.3 | | 0.3 | | 0.2 | | Uncertain tax position reserves | - | | 0.4 | | 0.3 | | Other | 0.2 | | 0.2 | | 0.6 | | Return to provision and other discrete items | (0.1) | | | (0.2) | | | (0.1) | | Equity compensation related adjustments | (1.0) | | | (1.3) | | | (1.7) | | | | | | | | | Effective income tax rate | 23.7% | | 24.2% | | 23.9% |
|
| Schedule of Deferred Income Tax Liabilities and Assets |
The components of the deferred income tax assets and liabilities for continuing operations were as follows: | | | | | | | | | | | | | December 31, | | 2024 | | 2023 | | Deferred income tax liability: | | | | | Leasehold improvements, property and equipment, net | $ | 262,692 | | $ | 272,017 | | Goodwill and other assets | 1,753 | | 1,743 | | Operating lease assets | 1,088,934 | | 972,835 | | Total deferred income tax liability | 1,353,379 | | 1,246,595 | | Deferred income tax asset: | | | | | Gift card liability | 19,087 | | 18,101 | | Capitalized transaction costs | 323 | | 323 | | Stock-based compensation and other employee benefits | 61,574 | | 50,954 | | Foreign net operating loss carry-forwards | 35,215 | | 32,252 | | State credits | 872 | | 1,838 | | Operating lease liabilities | 1,159,788 | | 1,038,911 | | Allowances, reserves and other | 26,105 | | 12,870 | | Capitalized research costs | 29,122 | | 25,990 | | Prepaid assets and other | 10,334 | | 6,637 | | State net operating loss carry-forwards | 3,867 | | 4,332 | | Valuation allowance | (39,116) | | | (34,722) | | | Total deferred income tax asset | 1,307,171 | | 1,157,486 | | Deferred income tax liabilities | $ | 46,208 | | $ | 89,109 |
|
| Schedule of Unrecognized Tax Benefits Roll Forward |
A reconciliation of the unrecognized tax benefits was as follows: | | | | | | | | | | | | | | | | | | | Year ended December 31, | | 2024 | | 2023 | | 2022 | | Beginning of year | $ | 16,488 | | $ | 8,902 | | $ | 5,262 | | Increase resulting from prior year tax positions | 3,737 | | 7,561 | | 3,937 | | Decrease resulting from prior year tax positions | (3,748) | | | (295) | | - | | | Increase resulting from current year tax positions | 916 | | 783 | | 312 | | Settlements with taxing authorities | - | | | (6) | | - | | Lapsing of statutes of limitations | (505) | | | (457) | | | (609) | | | End of year | $ | 16,888 | | $ | 16,488 | | $ | 8,902 |
|
| X |
- DefinitionTabular disclosure of the components of income tax expense attributable to continuing operations for each year presented including, but not limited to: current tax expense (benefit), deferred tax expense (benefit), investment tax credits, government grants, the benefits of operating loss carryforwards, tax expense that results from allocating certain tax benefits either directly to contributed capital or to reduce goodwill or other noncurrent intangible assets of an acquired entity, adjustments of a deferred tax liability or asset for enacted changes in tax laws or rates or a change in the tax status of the entity, and adjustments of the beginning-of-the-year balances of a valuation allowance because of a change in circumstances that causes a change in judgment about the realizability of the related deferred tax asset in future years. Reference 1: http://www.xbrl.org/2009/role/commonPracticeRef
-Topic 740
-SubTopic 10
-Name Accounting Standards Codification
-Section 50
-Paragraph 9
-Publisher FASB
-URI https://asc.fasb.org/1943274/2147482685/740-10-50-9
| Name: |
us-gaap_ScheduleOfComponentsOfIncomeTaxExpenseBenefitTableTextBlock |
| Namespace Prefix: |
us-gaap_ |
| Data Type: |
dtr-types:textBlockItemType |
| Balance Type: |
na |
| Period Type: |
duration |
|
| X |
- DefinitionTabular disclosure of the components of net deferred tax asset or liability recognized in an entity's statement of financial position, including the following: the total of all deferred tax liabilities, the total of all deferred tax assets, the total valuation allowance recognized for deferred tax assets. Reference 1: http://www.xbrl.org/2009/role/commonPracticeRef
-Topic 740
-SubTopic 10
-Name Accounting Standards Codification
-Section 50
-Paragraph 2
-Publisher FASB
-URI https://asc.fasb.org/1943274/2147482685/740-10-50-2
| Name: |
us-gaap_ScheduleOfDeferredTaxAssetsAndLiabilitiesTableTextBlock |
| Namespace Prefix: |
us-gaap_ |
| Data Type: |
dtr-types:textBlockItemType |
| Balance Type: |
na |
| Period Type: |
duration |
|
| X |
- DefinitionTabular disclosure of the reconciliation using percentage or dollar amounts of the reported amount of income tax expense attributable to continuing operations for the year to the amount of income tax expense that would result from applying domestic federal statutory tax rates to pretax income from continuing operations. Reference 1: http://www.xbrl.org/2003/role/exampleRef
-Topic 740
-SubTopic 10
-Name Accounting Standards Codification
-Section 55
-Paragraph 231
-Publisher FASB
-URI https://asc.fasb.org/1943274/2147482663/740-10-55-231
Reference 2: http://www.xbrl.org/2003/role/disclosureRef
-Topic 740
-SubTopic 10
-Name Accounting Standards Codification
-Section 50
-Paragraph 12A
-Publisher FASB
-URI https://asc.fasb.org/1943274/2147482685/740-10-50-12A
Reference 3: http://www.xbrl.org/2009/role/commonPracticeRef
-Topic 740
-SubTopic 10
-Name Accounting Standards Codification
-Section 50
-Paragraph 12
-Publisher FASB
-URI https://asc.fasb.org/1943274/2147482685/740-10-50-12
| Name: |
us-gaap_ScheduleOfEffectiveIncomeTaxRateReconciliationTableTextBlock |
| Namespace Prefix: |
us-gaap_ |
| Data Type: |
dtr-types:textBlockItemType |
| Balance Type: |
na |
| Period Type: |
duration |
|
| X |
- DefinitionTabular disclosure of income before income tax between domestic and foreign jurisdictions. Reference 1: http://www.xbrl.org/2009/role/commonPracticeRef
-Topic 235
-SubTopic 10
-Name Accounting Standards Codification
-Section S99
-Paragraph 1
-Subparagraph (SX 210.4-08(h)(1)(Note 1))
-Publisher FASB
-URI https://asc.fasb.org/1943274/2147480678/235-10-S99-1
| Name: |
us-gaap_ScheduleOfIncomeBeforeIncomeTaxDomesticAndForeignTableTextBlock |
| Namespace Prefix: |
us-gaap_ |
| Data Type: |
dtr-types:textBlockItemType |
| Balance Type: |
na |
| Period Type: |
duration |
|
| X |
- DefinitionTabular disclosure of the change in unrecognized tax benefits. Reference 1: http://www.xbrl.org/2003/role/exampleRef
-Topic 740
-SubTopic 10
-Name Accounting Standards Codification
-Section 55
-Paragraph 217
-Publisher FASB
-URI https://asc.fasb.org/1943274/2147482663/740-10-55-217
Reference 2: http://www.xbrl.org/2003/role/disclosureRef
-Topic 740
-SubTopic 10
-Name Accounting Standards Codification
-Section 50
-Paragraph 15A
-Subparagraph (a)
-Publisher FASB
-URI https://asc.fasb.org/1943274/2147482685/740-10-50-15A
| Name: |
us-gaap_ScheduleOfUnrecognizedTaxBenefitsRollForwardTableTextBlock |
| Namespace Prefix: |
us-gaap_ |
| Data Type: |
dtr-types:textBlockItemType |
| Balance Type: |
na |
| Period Type: |
duration |
|
v3.25.0.1
Stock-Based Compensation and Employee Benefit Plans (Tables)
|
12 Months Ended |
Dec. 31, 2024 |
|---|
| Share-Based Payment Arrangement [Abstract] |
|
| Summary of Stock-Based Compensation Expense |
Total stock-based compensation expense was as follows: | | | | | | | | | | | | | | | | | | | | Year ended December 31, | | | 2024 | | 2023 | | 2022 | | Stock-based compensation | $ | 134,635 | | $ | 126,686 | | $ | 99,821 | | Stock-based compensation, net of income taxes | $ | 109,996 | | $ | 107,210 | | $ | 84,928 | | Total capitalized stock-based compensation included in leasehold improvements, property and equipment, net on the consolidated balance sheets | $ | 2,905 | | $ | 2,670 | | $ | 1,791 | | Excess tax benefit on stock-based compensation recognized in provision for income taxes on the consolidated statements of income and comprehensive income | $ | 23,419 | | $ | 25,437 | | $ | 24,689 |
|
| Summary of SOSAR Activity Under Incentive Plan |
A summary of SOSAR activity was as follows (in thousands, except years and per share data): | | | | | | | | | | | | | | | | | | | | | | | | | Shares | | Weighted-Average Exercise Price per
Share | | Weighted-Average Remaining
Contractual Life (Years) | | Aggregate Intrinsic Value | | Outstanding, January 1, 2024 | 14,738 | | $ | 26.05 | | 4.4 | | $ | 290,156 | | Granted | 2,533 | | 53.04 | | | | | | Exercised | (5,077) | | 21.83 | | | | | | Forfeited | (1,780) | | 38.56 | | | | | | Outstanding, December 31, 2024 | 10,414 | | 32.53 | | 4.2 | | 289,373 | | Exercisable, December 31, 2024 | 4,152 | | 22.88 | | 2.6 | | 155,371 | | Vested and expected to vest, December 31, 2024 | 9,997 | | 32.07 | | 4.1 | | 282,450 |
|
| Schedule of Assumptions for SOSAR |
The weighted-average assumptions utilized in the Black-Scholes option-pricing model to estimate the fair value of SOSARs granted each year were as follows: | | | | | | | | | | | | | | | | | | | 2024 | | 2023 | | 2022 | | Risk-free interest rate | 4.2% | | 4.1% | | 2.1% | | Expected life (years) | 3.6 | | 3.6 | | 3.6 | | Expected dividend yield | 0.0% | | 0.0% | | 0.0% | | Volatility | 35.7% | | 36.4% | | 36.0% | | Weighted-average Black-Scholes fair value per share at date of grant | $ | 16.98 | | $ | 10.60 | | $ | 9.13 |
|
| Summary of Share-Based Payment Arrangement, Restricted Stock Unit, Activity |
A summary of RSU award activity was as follows (in thousands, except per share data): | | | | | | | | | | | | | Shares | | Weighted-Average Grant Date Fair Value
per Share | | Outstanding, January 1, 2024 | 3,002 | | $ | 32.08 | | | Granted | 2,615 | | 53.67 | | | Vested | (948) | | 31.96 | | | Forfeited | (322) | | 39.58 | | | Outstanding, December 31, 2024 | 4,347 | | 44.54 | | | Vested and expected to vest, December 31, 2024 | 3,919 | | 44.21 | |
|
| Summary of Share-Based Payment Arrangement, Performance Shares, Activity |
A summary of PSU award activity was as follows (in thousands, except per share data): | | | | | | | | | | | | | Shares | | Weighted-Average Grant Date Fair
Value per Share | | Outstanding, January 1, 2024 | 2,794 | | $ | 31.24 | | Granted | 866 | | 52.90 | | Vested | (777) | | 29.59 | | Forfeited | (838) | | 37.89 | | Outstanding, December 31, 2024 | 2,045 | | 38.32 | | Vested and expected to vest, December 31, 2024* | 3,649 | | 37.78 |
*The vested and expected to vest total above represents outstanding base PSUs, adjusted for expected payout amounts in line with current and future estimated performance levels.
|
| Summarization of Estimated Current and Long-Term Cash Requirements for Deferred Compensation |
The following table summarizes estimated current and long-term material cash requirements for our deferred compensation plan as of December 31, 2024: | | | | | | | | | | | | | | | | | | | | | | | | | | | | | | | Payments Due by Fiscal Year | | Total | | 2025 | | 2026-2027 | | 2028-2029 | | Thereafter | Deferred compensation(1) | $ | 36,509 | | $ | 7,172 | | $ | 8,763 | | $ | 8,055 | | $ | 12,518 |
(1)Includes scheduled payments from our deferred compensation plan where payment dates are determinable for employed participants in accordance with the account’s election, and the assumption that active participants will retire at the age of 65 and begin distributions from their accounts at that time. This does not include future contributions, investment earnings, or future participants. Timing and amounts of payments may vary significantly.
|
| X |
- DefinitionDeferred Compensation, Estimated Current and Long-Term Cash Requirements [Table Text Block]
| Name: |
cmg_DeferredCompensationEstimatedCurrentAndLongTermCashRequirementsTableTextBlock |
| Namespace Prefix: |
cmg_ |
| Data Type: |
dtr-types:textBlockItemType |
| Balance Type: |
na |
| Period Type: |
duration |
|
| X |
- DefinitionTabular disclosure of allocation of amount expensed and capitalized for award under share-based payment arrangement to statement of income or comprehensive income and statement of financial position. Includes, but is not limited to, corresponding line item in financial statement. Reference 1: http://fasb.org/us-gaap/role/ref/legacyRef
-Name Accounting Standards Codification
-Topic 718
-SubTopic 10
-Section 50
-Paragraph 2
-Subparagraph (h)(1)
-Publisher FASB
-URI https://asc.fasb.org/1943274/2147480429/718-10-50-2
| Name: |
us-gaap_ScheduleOfEmployeeServiceShareBasedCompensationAllocationOfRecognizedPeriodCostsTextBlock |
| Namespace Prefix: |
us-gaap_ |
| Data Type: |
dtr-types:textBlockItemType |
| Balance Type: |
na |
| Period Type: |
duration |
|
| X |
- DefinitionTabular disclosure of the number and weighted-average grant date fair value for restricted stock units that were outstanding at the beginning and end of the year, and the number of restricted stock units that were granted, vested, or forfeited during the year. Reference 1: http://fasb.org/us-gaap/role/ref/legacyRef
-Topic 718
-SubTopic 10
-Name Accounting Standards Codification
-Section 50
-Paragraph 2
-Subparagraph (c)(1)
-Publisher FASB
-URI https://asc.fasb.org/1943274/2147480429/718-10-50-2
| Name: |
us-gaap_ScheduleOfShareBasedCompensationRestrictedStockUnitsAwardActivityTableTextBlock |
| Namespace Prefix: |
us-gaap_ |
| Data Type: |
dtr-types:textBlockItemType |
| Balance Type: |
na |
| Period Type: |
duration |
|
| X |
- DefinitionTabular disclosure of the number and weighted-average exercise prices (or conversion ratios) for stock appreciation rights awards that were outstanding at the beginning and end of the year, and the number of stock appreciation rights awards that were granted, exercised or converted, forfeited, and expired during the year. Reference 1: http://fasb.org/us-gaap/role/ref/legacyRef
-Topic 718
-SubTopic 10
-Name Accounting Standards Codification
-Section 50
-Paragraph 2
-Subparagraph (c)(1)
-Publisher FASB
-URI https://asc.fasb.org/1943274/2147480429/718-10-50-2
| Name: |
us-gaap_ScheduleOfShareBasedCompensationStockAppreciationRightsAwardActivityTableTextBlock |
| Namespace Prefix: |
us-gaap_ |
| Data Type: |
dtr-types:textBlockItemType |
| Balance Type: |
na |
| Period Type: |
duration |
|
| X |
- DefinitionTabular disclosure of the significant assumptions used during the year to estimate the fair value of stock options, including, but not limited to: (a) expected term of share options and similar instruments, (b) expected volatility of the entity's shares, (c) expected dividends, (d) risk-free rate(s), and (e) discount for post-vesting restrictions. Reference 1: http://fasb.org/us-gaap/role/ref/legacyRef
-Topic 718
-SubTopic 10
-Subparagraph (f)(2)
-Name Accounting Standards Codification
-Paragraph 2
-Section 50
-Publisher FASB
-URI https://asc.fasb.org/1943274/2147480429/718-10-50-2
| Name: |
us-gaap_ScheduleOfShareBasedPaymentAwardStockOptionsValuationAssumptionsTableTextBlock |
| Namespace Prefix: |
us-gaap_ |
| Data Type: |
dtr-types:textBlockItemType |
| Balance Type: |
na |
| Period Type: |
duration |
|
| X |
- DefinitionTabular disclosure of number and weighted-average grant date fair value for nonvested performance shares. Reference 1: http://fasb.org/us-gaap/role/ref/legacyRef
-Name Accounting Standards Codification
-Section 50
-Subparagraph (c)
-Paragraph 2
-SubTopic 10
-Topic 718
-Publisher FASB
-URI https://asc.fasb.org/1943274/2147480429/718-10-50-2
| Name: |
us-gaap_ShareBasedCompensationPerformanceSharesAwardUnvestedActivityTableTextBlock |
| Namespace Prefix: |
us-gaap_ |
| Data Type: |
dtr-types:textBlockItemType |
| Balance Type: |
na |
| Period Type: |
duration |
|
v3.25.0.1
Leases (Tables)
|
12 Months Ended |
Dec. 31, 2024 |
|---|
| Leases [Abstract] |
|
| Schedule of Supplemental Balance Sheet Information Related to Leases |
The weighted-average remaining lease term and discount rate were as follows: | | | | | | | | | | | | | December 31, | | 2024 | | 2023 | | Weighted-average remaining lease term (years) | 13.9 | | 13.7 | | Weighted-average discount rate | 5.30 | % | | 5.10 | % |
|
| Schedule of Lease Expense Components |
The components of lease cost were as follows: | | | | | | | | | | | | | | | | | | | | | | | Year ended December 31, | | Classification | 2024 | | 2023 | | 2022 | | Operating lease cost | Occupancy, Other operating costs, General and administrative expenses and Pre-opening costs | $ | 486,598 | | $ | 436,313 | | $ | 397,112 | | Short-term lease cost | Other operating costs | 572 | | 519 | | 633 | | Variable lease cost | Occupancy, Other operating costs, General and administrative expenses and Pre-opening costs | 120,948 | | 111,896 | | 102,636 | | Sublease income | General and administrative expenses | (3,559) | | | (4,765) | | | (5,444) | | | Total lease cost | | $ | 604,559 | | $ | 543,963 | | $ | 494,937 |
|
| Schedule of Supplemental Cash Flow Related to Leases |
Supplemental disclosures of cash flow information related to leases were as follows: | | | | | | | | | | | | | | | | | | | | Year ended December 31, | | | 2024 | | 2023 | | 2022 | | Cash paid for operating lease liabilities | $ | 466,171 | | $ | 421,591 | | $ | 386,238 | | Operating lease assets obtained in exchange for operating lease liabilities | $ | 692,684 | | $ | 521,759 | | $ | 425,243 | | Derecognition of operating lease assets due to terminations or impairment | $ | 6,899 | | $ | 6,862 | | $ | 14,718 |
|
| Schedule of Maturity of Lease Liabilities |
Maturities of lease liabilities were as follows as of December 31, 2024: | | | | | | | Operating Leases | | 2025 | $ | 464,795 | | 2026 | 507,341 | | 2027 | 499,428 | | 2028 | 484,473 | | 2029 | 467,981 | | Thereafter | 4,133,853 | | Total lease payments | 6,557,871 | | Less: imputed interest | 2,017,253 | | Operating lease liabilities (Current and Long-Term) | $ | 4,540,618 |
|
| X |
- DefinitionSchedule Of Supplemental Balance Sheet Information Related To Leases [Table Text Block]
| Name: |
cmg_ScheduleOfSupplementalBalanceSheetInformationRelatedToLeasesTableTextBlock |
| Namespace Prefix: |
cmg_ |
| Data Type: |
dtr-types:textBlockItemType |
| Balance Type: |
na |
| Period Type: |
duration |
|
| X |
- DefinitionSchedule Of Supplemental Cash Flow Related To Leases [Table Text Block]
| Name: |
cmg_ScheduleOfSupplementalCashFlowRelatedToLeasesTableTextBlock |
| Namespace Prefix: |
cmg_ |
| Data Type: |
dtr-types:textBlockItemType |
| Balance Type: |
na |
| Period Type: |
duration |
|
| X |
- DefinitionTabular disclosure of lessee's lease cost. Includes, but is not limited to, interest expense for finance lease, amortization of right-of-use asset for finance lease, operating lease cost, short-term lease cost, variable lease cost and sublease income. Reference 1: http://www.xbrl.org/2009/role/commonPracticeRef
-Topic 842
-SubTopic 20
-Name Accounting Standards Codification
-Section 50
-Paragraph 4
-Publisher FASB
-URI https://asc.fasb.org/1943274/2147478964/842-20-50-4
| Name: |
us-gaap_LeaseCostTableTextBlock |
| Namespace Prefix: |
us-gaap_ |
| Data Type: |
dtr-types:textBlockItemType |
| Balance Type: |
na |
| Period Type: |
duration |
|
| X |
- References
+ Details
| Name: |
us-gaap_LeasesAbstract |
| Namespace Prefix: |
us-gaap_ |
| Data Type: |
xbrli:stringItemType |
| Balance Type: |
na |
| Period Type: |
duration |
|
| X |
- DefinitionTabular disclosure of undiscounted cash flows of lessee's operating lease liability. Includes, but is not limited to, reconciliation of undiscounted cash flows to operating lease liability recognized in statement of financial position. Reference 1: http://www.xbrl.org/2009/role/commonPracticeRef
-Topic 842
-SubTopic 20
-Name Accounting Standards Codification
-Section 50
-Paragraph 6
-Publisher FASB
-URI https://asc.fasb.org/1943274/2147478964/842-20-50-6
| Name: |
us-gaap_LesseeOperatingLeaseLiabilityMaturityTableTextBlock |
| Namespace Prefix: |
us-gaap_ |
| Data Type: |
dtr-types:textBlockItemType |
| Balance Type: |
na |
| Period Type: |
duration |
|
v3.25.0.1
Earnings Per Share (Tables)
|
12 Months Ended |
Dec. 31, 2024 |
|---|
| Earnings Per Share [Abstract] |
|
| Schedule of Basic and Diluted Earnings Per Share |
The following table sets forth the computations of basic and diluted earnings per share: | | | | | | | | | | | | | | | | | | | | Year ended December 31, | | | 2024 | | 2023 | | 2022 | | Net income | $ | 1,534,110 | | $ | 1,228,737 | | $ | 899,101 | | Shares: | | | | | | | Weighted-average number of common shares outstanding (for basic calculation) | 1,368,343 | | 1,377,768 | | 1,392,543 | | Dilutive stock awards | 8,212 | | 7,732 | | 10,534 | | Weighted-average number of common shares outstanding (for diluted calculation) | 1,376,555 | | 1,385,500 | | 1,403,077 | | Basic earnings per share | $ | 1.12 | | $ | 0.89 | | $ | 0.65 | | Diluted earnings per share | $ | 1.11 | | $ | 0.89 | | $ | 0.64 |
|
| Schedule of Stock Awards Excluded from the Calculation of Diluted EPS |
The following stock awards were excluded from the calculation of diluted earnings per share: | | | | | | | | | | | | | | | | | | | | Year ended December 31, | | | 2024 | | 2023 | | 2022 | | Stock awards subject to performance conditions | 2,179 | | 2,517 | | 2,701 | | Stock awards that were antidilutive | 2,210 | | 3,565 | | 8,149 | | Total stock awards excluded from diluted earnings per share | 4,389 | | 6,082 | | 10,850 |
|
| X |
- DefinitionStock awards excluded from the calculation of diluted EPS - consisting of awards subject to performance conditions and awards that were antidilutive.
| Name: |
cmg_StockAwardsExcludedFromCalculationOfDilutedEpsTableTextBlock |
| Namespace Prefix: |
cmg_ |
| Data Type: |
dtr-types:textBlockItemType |
| Balance Type: |
na |
| Period Type: |
duration |
|
| X |
- References
+ Details
| Name: |
us-gaap_EarningsPerShareAbstract |
| Namespace Prefix: |
us-gaap_ |
| Data Type: |
xbrli:stringItemType |
| Balance Type: |
na |
| Period Type: |
duration |
|
| X |
- DefinitionTabular disclosure of an entity's basic and diluted earnings per share calculations, including a reconciliation of numerators and denominators of the basic and diluted per-share computations for income from continuing operations. Reference 1: http://www.xbrl.org/2009/role/commonPracticeRef
-Topic 260
-SubTopic 10
-Name Accounting Standards Codification
-Section 50
-Paragraph 1
-Subparagraph (a)
-Publisher FASB
-URI https://asc.fasb.org/1943274/2147482662/260-10-50-1
| Name: |
us-gaap_ScheduleOfEarningsPerShareBasicAndDilutedTableTextBlock |
| Namespace Prefix: |
us-gaap_ |
| Data Type: |
dtr-types:textBlockItemType |
| Balance Type: |
na |
| Period Type: |
duration |
|
v3.25.0.1
Segment Reporting (Tables)
|
12 Months Ended |
Dec. 31, 2024 |
|---|
| Segment Reporting [Abstract] |
|
| Schedule of Reportable Segments |
The following tables present selected financial information with respect to our single reportable segment: | | | | | | | | | | | | | | | | | | | Year ended December 31, | | U.S. segment | 2024 | | 2023 | | 2022 | | Food and beverage revenue | $ | 11,045,450 | | $ | 9,652,976 | | $ | 8,439,674 | | Delivery service revenue | 66,282 | | 67,393 | | 76,536 | | U.S. segment total revenue | 11,111,732 | | 9,720,369 | | 8,516,210 | | | | | | | | Reconciliation: | | | | | | All other revenue(1) | 202,121 | | 151,280 | | 118,442 | | Total consolidated revenue | $ | 11,313,853 | | | $ | 9,871,649 | | | $ | 8,634,652 | |
| | | | | | | | | | | | | | | | | | | Year ended December 31, | | 2024 | | 2023 | | 2022 | | U.S. segment total revenue | $ | 11,111,732 | | $ | 9,720,369 | | $ | 8,516,210 | | | | | | | | Less: | | | | | | | Food, beverage and packaging | 3,299,295 | | 2,853,651 | | 2,556,657 | | Labor | 2,741,590 | | 2,402,964 | | 2,168,994 | | Occupancy | 548,688 | | 491,757 | | 450,684 | | Marketing | 283,053 | | 261,358 | | 248,319 | | Other operating costs, excluding marketing | 1,254,512 | | 1,141,850 | | 1,045,025 | | Depreciation and amortization | 300,513 | | 282,521 | | 253,904 | Other segment items(2) | 55,482 | | 64,150 | | 48,019 | | U.S. segment income from operations | 2,628,599 | | 2,222,118 | | 1,744,608 | | | | | | | | Reconciliation: | | | | | | Corporate and other unallocated expenses(3) | 709,426 | | 657,134 | | 574,572 | Other loss from operations(4) | (2,840) | | (7,171) | | (9,633) | | Interest and other income, net | 93,897 | | 62,693 | | 21,128 | | Total consolidated income before income taxes | $ | 2,010,230 | | | $ | 1,620,506 | | | $ | 1,181,531 | |
(1)All other revenue represents sales within our company-owned stores in Canada, Europe and royalty revenue from our international licensed restaurants. (2)Other segment items consist of pre-opening costs, impairment, closure costs, and asset disposals related to the U.S. segment. (3)Corporate and other unallocated expenses represent corporate overhead expenses that have not been allocated to any segment for reporting purposes including general and administrative expenses. (4)Amounts reflect the net loss from operations related to our operations in Canada, Europe and international licensed restaurants.
|
| Schedule of Long-Lived Assets |
The Company's long-lived tangible assets, including the Company's operating lease assets recognized on the consolidated balance sheets were located as follows: | | | | | | | | | | | | | December 31, | | 2024 | | 2023 | | United States | 6,247,406 | | | 5,637,230 | | | International | 142,847 | | | 111,356 | |
|
| X |
- DefinitionTabular disclosure of information concerning material long-lived assets (excluding financial instruments, customer relationships with financial institutions, mortgage and other servicing rights, deferred policy acquisition costs, and deferred taxes assets) located in identified geographic areas and/or the amount of revenue from external customers attributed to that country from which revenue is material. An entity may also provide subtotals of geographic information about groups of countries. Reference 1: http://fasb.org/us-gaap/role/ref/legacyRef
-Topic 220
-SubTopic 10
-Name Accounting Standards Codification
-Section S99
-Paragraph 2
-Subparagraph (SX 210.5-03(1))
-Publisher FASB
-URI https://asc.fasb.org/1943274/2147483621/220-10-S99-2
Reference 2: http://fasb.org/us-gaap/role/ref/legacyRef
-Name Accounting Standards Codification
-Topic 280
-SubTopic 10
-Section 50
-Paragraph 41
-Publisher FASB
-URI https://asc.fasb.org/1943274/2147482810/280-10-50-41
| Name: |
us-gaap_ScheduleOfRevenuesFromExternalCustomersAndLongLivedAssetsByGeographicalAreasTableTextBlock |
| Namespace Prefix: |
us-gaap_ |
| Data Type: |
dtr-types:textBlockItemType |
| Balance Type: |
na |
| Period Type: |
duration |
|
| X |
- DefinitionTabular disclosure of the profit or loss and total assets for each reportable segment. An entity discloses certain information on each reportable segment if the amounts (a) are included in the measure of segment profit or loss reviewed by the chief operating decision maker or (b) are otherwise regularly provided to the chief operating decision maker, even if not included in that measure of segment profit or loss. Reference 1: http://fasb.org/us-gaap/role/ref/legacyRef
-Name Accounting Standards Codification
-Topic 280
-SubTopic 10
-Section 50
-Paragraph 25
-Publisher FASB
-URI https://asc.fasb.org/1943274/2147482810/280-10-50-25
Reference 2: http://fasb.org/us-gaap/role/ref/legacyRef
-Name Accounting Standards Codification
-Topic 280
-SubTopic 10
-Section 50
-Paragraph 22
-Publisher FASB
-URI https://asc.fasb.org/1943274/2147482810/280-10-50-22
Reference 3: http://fasb.org/us-gaap/role/ref/legacyRef
-Name Accounting Standards Codification
-Topic 280
-SubTopic 10
-Section 50
-Paragraph 30
-Publisher FASB
-URI https://asc.fasb.org/1943274/2147482810/280-10-50-30
| Name: |
us-gaap_ScheduleOfSegmentReportingInformationBySegmentTextBlock |
| Namespace Prefix: |
us-gaap_ |
| Data Type: |
dtr-types:textBlockItemType |
| Balance Type: |
na |
| Period Type: |
duration |
|
| X |
- References
+ Details
| Name: |
us-gaap_SegmentReportingAbstract |
| Namespace Prefix: |
us-gaap_ |
| Data Type: |
xbrli:stringItemType |
| Balance Type: |
na |
| Period Type: |
duration |
|
v3.25.0.1
Description of Business and Summary of Significant Accounting Policies - Narrative (Details)
|
|
12 Months Ended |
Jun. 26, 2024 |
Dec. 31, 2024
USD ($)
restaurant
segment
region
$ / shares
|
Dec. 31, 2023
USD ($)
$ / shares
|
Dec. 31, 2022
USD ($)
|
| Product Information [Line Items] |
|
|
|
|
| Number of restaurants | restaurant |
|
3,726
|
|
|
| Number of regions | region |
|
10
|
|
|
| Number of reportable segments | segment |
|
1
|
|
|
| Stock split, conversion ratio |
50
|
|
|
|
| Common stock, par value (in usd per share) | $ / shares |
|
$ 0.01
|
$ 0.01
|
|
| Allowance for credit losses | $ |
|
$ 2,953,000
|
$ 2,742,000
|
|
| Acquisition, development and construction of restaurant capitalized costs | $ |
|
$ 17,624,000
|
15,385,000
|
$ 12,695,000
|
| Option to extend, additional periods |
|
5 years
|
|
|
| Renewal period |
|
20 years
|
|
|
| Long-term debt | $ |
|
$ 0
|
|
|
| Earned points expiration period for inactivity |
|
6 months
|
|
|
| Advertising, marketing and promotional costs | $ |
|
$ 286,044,000
|
$ 264,085,000
|
$ 250,673,000
|
| Vesting period |
|
3 years
|
3 years
|
|
| Compensation expense related to employees eligible to retire and retain full rights to the awards, recognition period |
|
12 months
|
|
|
| Licensed Units | International |
|
|
|
|
| Product Information [Line Items] |
|
|
|
|
| Number of restaurants | restaurant |
|
3
|
|
|
| Minimum |
|
|
|
|
| Product Information [Line Items] |
|
|
|
|
| Remaining lease term |
|
1 year
|
|
|
| Tax benefit percentage for realization with a taxing authority |
|
50.00%
|
|
|
| Earned rewards expiration period |
|
1 month
|
|
|
| Maximum |
|
|
|
|
| Product Information [Line Items] |
|
|
|
|
| Remaining lease term |
|
20 years
|
|
|
| Earned rewards expiration period |
|
2 months
|
|
|
| Chipotle | Geographic Distribution, Domestic |
|
|
|
|
| Product Information [Line Items] |
|
|
|
|
| Number of restaurants | restaurant |
|
3,644
|
|
|
| Chipotle | International |
|
|
|
|
| Product Information [Line Items] |
|
|
|
|
| Number of restaurants | restaurant |
|
82
|
|
|
| RSUs | Tranche One |
|
|
|
|
| Product Information [Line Items] |
|
|
|
|
| Vesting period |
|
2 years
|
|
|
| Award vesting rights, percentage |
|
50.00%
|
|
|
| RSUs | Tranche Two |
|
|
|
|
| Product Information [Line Items] |
|
|
|
|
| Vesting period |
|
3 years
|
|
|
| Award vesting rights, percentage |
|
50.00%
|
|
|
| SOSARS |
|
|
|
|
| Product Information [Line Items] |
|
|
|
|
| Expiration period |
|
7 years
|
|
|
| SOSARS | Tranche One |
|
|
|
|
| Product Information [Line Items] |
|
|
|
|
| Vesting period |
|
2 years
|
|
|
| Award vesting rights, percentage |
|
50.00%
|
|
|
| SOSARS | Tranche Two |
|
|
|
|
| Product Information [Line Items] |
|
|
|
|
| Vesting period |
|
3 years
|
|
|
| Award vesting rights, percentage |
|
50.00%
|
|
|
| Performance Shares |
|
|
|
|
| Product Information [Line Items] |
|
|
|
|
| Vesting period |
|
3 years
|
3 years
|
3 years
|
| X |
- DefinitionRepresents the internal costs directly associated with the acquisition, development and construction of a restaurant.
| Name: |
cmg_CapitalizedDevelopment |
| Namespace Prefix: |
cmg_ |
| Data Type: |
xbrli:monetaryItemType |
| Balance Type: |
debit |
| Period Type: |
duration |
|
| X |
- DefinitionEarned points expiration period for inactivity.
| Name: |
cmg_EarnedPointsExpirationPeriodForInactivity |
| Namespace Prefix: |
cmg_ |
| Data Type: |
xbrli:durationItemType |
| Balance Type: |
na |
| Period Type: |
duration |
|
| X |
- DefinitionPeriod over which unrecognized compensation is expected to be recognized for equity-based compensation plans related to employees eligible to retire.
| Name: |
cmg_EmployeesEligibleToRetireTotalCompensationCostNotYetRecognizedPeriodForRecognition |
| Namespace Prefix: |
cmg_ |
| Data Type: |
xbrli:durationItemType |
| Balance Type: |
na |
| Period Type: |
duration |
|
| X |
- DefinitionLessee, Operating Lease, Option to Extend, Additional Periods.
| Name: |
cmg_LesseeOperatingLeaseOptionToExtendAdditionalPeriods |
| Namespace Prefix: |
cmg_ |
| Data Type: |
xbrli:durationItemType |
| Balance Type: |
na |
| Period Type: |
duration |
|
| X |
- DefinitionThe number of regions by which the Company manages its operations.
| Name: |
cmg_NumberOfRegionsInWhichEntityOperates |
| Namespace Prefix: |
cmg_ |
| Data Type: |
xbrli:integerItemType |
| Balance Type: |
na |
| Period Type: |
duration |
|
| X |
- DefinitionReward program expiration period.
| Name: |
cmg_RewardProgramExpirationPeriod |
| Namespace Prefix: |
cmg_ |
| Data Type: |
xbrli:durationItemType |
| Balance Type: |
na |
| Period Type: |
duration |
|
| X |
- DefinitionTax Benefit Recognized Likelihood Percentage Of Being Realized Upon Settlement With Taxing Authority
| Name: |
cmg_TaxBenefitRecognizedLikelihoodPercentageOfBeingRealizedUponSettlementWithTaxingAuthority |
| Namespace Prefix: |
cmg_ |
| Data Type: |
dtr-types:percentItemType |
| Balance Type: |
na |
| Period Type: |
duration |
|
| X |
- DefinitionAmount of allowance for credit loss of accounts and financing receivables. Includes, but is not limited to, notes and loan receivable. Reference 1: http://www.xbrl.org/2003/role/disclosureRef
-Topic 310
-SubTopic 10
-Name Accounting Standards Codification
-Section 50
-Paragraph 4
-Publisher FASB
-URI https://asc.fasb.org/1943274/2147481962/310-10-50-4
| Name: |
us-gaap_AccountsAndFinancingReceivableAllowanceForCreditLoss |
| Namespace Prefix: |
us-gaap_ |
| Data Type: |
xbrli:monetaryItemType |
| Balance Type: |
credit |
| Period Type: |
instant |
|
| X |
- DefinitionFace amount or stated value per share of common stock. Reference 1: http://fasb.org/us-gaap/role/ref/legacyRef
-Topic 210
-SubTopic 10
-Name Accounting Standards Codification
-Section S99
-Paragraph 1
-Subparagraph (SX 210.5-02(29))
-Publisher FASB
-URI https://asc.fasb.org/1943274/2147480566/210-10-S99-1
| Name: |
us-gaap_CommonStockParOrStatedValuePerShare |
| Namespace Prefix: |
us-gaap_ |
| Data Type: |
dtr-types:perShareItemType |
| Balance Type: |
na |
| Period Type: |
instant |
|
| X |
- DefinitionRemaining lease term of operating lease, in 'PnYnMnDTnHnMnS' format, for example, 'P1Y5M13D' represents reported fact of one year, five months, and thirteen days. Reference 1: http://www.xbrl.org/2003/role/disclosureRef
-Topic 842
-SubTopic 20
-Name Accounting Standards Codification
-Section 50
-Paragraph 7A
-Subparagraph (c)
-Publisher FASB
-URI https://asc.fasb.org/1943274/2147478964/842-20-50-7A
Reference 2: http://www.xbrl.org/2009/role/commonPracticeRef
-Topic 842
-SubTopic 20
-Name Accounting Standards Codification
-Section 50
-Paragraph 3
-Subparagraph (a)(1)
-Publisher FASB
-URI https://asc.fasb.org/1943274/2147478964/842-20-50-3
| Name: |
us-gaap_LesseeOperatingLeaseRemainingLeaseTerm |
| Namespace Prefix: |
us-gaap_ |
| Data Type: |
xbrli:durationItemType |
| Balance Type: |
na |
| Period Type: |
instant |
|
| X |
- DefinitionTerm of lessee's operating lease renewal, in 'PnYnMnDTnHnMnS' format, for example, 'P1Y5M13D' represents reported fact of one year, five months, and thirteen days. Reference 1: http://www.xbrl.org/2009/role/commonPracticeRef
-Topic 842
-SubTopic 20
-Name Accounting Standards Codification
-Section 50
-Paragraph 3
-Subparagraph (a)(3)
-Publisher FASB
-URI https://asc.fasb.org/1943274/2147478964/842-20-50-3
| Name: |
us-gaap_LesseeOperatingLeaseRenewalTerm |
| Namespace Prefix: |
us-gaap_ |
| Data Type: |
xbrli:durationItemType |
| Balance Type: |
na |
| Period Type: |
instant |
|
| X |
- DefinitionAmount, after deduction of unamortized premium (discount) and debt issuance cost, of long-term debt. Excludes lease obligation. Reference 1: http://fasb.org/us-gaap/role/ref/legacyRef
-Name Accounting Standards Codification
-Section S99
-Paragraph 1
-Subparagraph (SX 210.5-02(22))
-SubTopic 10
-Topic 210
-Publisher FASB
-URI https://asc.fasb.org/1943274/2147480566/210-10-S99-1
Reference 2: http://www.xbrl.org/2003/role/exampleRef
-Topic 835
-SubTopic 30
-Name Accounting Standards Codification
-Section 55
-Paragraph 8
-Publisher FASB
-URI https://asc.fasb.org/1943274/2147482949/835-30-55-8
Reference 3: http://fasb.org/us-gaap/role/ref/legacyRef
-Topic 942
-SubTopic 210
-Name Accounting Standards Codification
-Section S99
-Paragraph 1
-Subparagraph (SX 210.9-03(16))
-Publisher FASB
-URI https://asc.fasb.org/1943274/2147478546/942-210-S99-1
Reference 4: http://www.xbrl.org/2003/role/exampleRef
-Topic 470
-SubTopic 20
-Name Accounting Standards Codification
-Section 55
-Paragraph 69B
-Publisher FASB
-URI https://asc.fasb.org/1943274/2147481568/470-20-55-69B
Reference 5: http://www.xbrl.org/2003/role/exampleRef
-Topic 470
-SubTopic 20
-Name Accounting Standards Codification
-Section 55
-Paragraph 69C
-Publisher FASB
-URI https://asc.fasb.org/1943274/2147481568/470-20-55-69C
Reference 6: http://www.xbrl.org/2003/role/disclosureRef
-Topic 470
-SubTopic 20
-Name Accounting Standards Codification
-Section 50
-Paragraph 1D
-Subparagraph (b)
-Publisher FASB
-URI https://asc.fasb.org/1943274/2147481139/470-20-50-1D
Reference 7: http://www.xbrl.org/2009/role/commonPracticeRef
-Topic 944
-SubTopic 210
-Name Accounting Standards Codification
-Section S99
-Paragraph 1
-Subparagraph (SX 210.7-03(a)(16)(a)(2))
-Publisher FASB
-URI https://asc.fasb.org/1943274/2147478777/944-210-S99-1
Reference 8: http://www.xbrl.org/2003/role/disclosureRef
-Topic 470
-SubTopic 20
-Name Accounting Standards Codification
-Section 50
-Paragraph 4
-Subparagraph (b)(3)
-Publisher FASB
-URI https://asc.fasb.org/1943274/2147481139/470-20-50-4
| Name: |
us-gaap_LongTermDebt |
| Namespace Prefix: |
us-gaap_ |
| Data Type: |
xbrli:monetaryItemType |
| Balance Type: |
credit |
| Period Type: |
instant |
|
| X |
- DefinitionThe total expense recognized in the period for promotion, public relations, and brand or product advertising. Reference 1: http://fasb.org/us-gaap/role/ref/legacyRef
-Topic 220
-SubTopic 10
-Name Accounting Standards Codification
-Section S99
-Paragraph 2
-Subparagraph (SX 210.5-03(4))
-Publisher FASB
-URI https://asc.fasb.org/1943274/2147483621/220-10-S99-2
| Name: |
us-gaap_MarketingAndAdvertisingExpense |
| Namespace Prefix: |
us-gaap_ |
| Data Type: |
xbrli:monetaryItemType |
| Balance Type: |
debit |
| Period Type: |
duration |
|
| X |
- DefinitionNumber of segments reported by the entity. A reportable segment is a component of an entity for which there is an accounting requirement to report separate financial information on that component in the entity's financial statements. Reference 1: http://www.xbrl.org/2003/role/exampleRef
-Topic 280
-SubTopic 10
-Name Accounting Standards Codification
-Section 55
-Paragraph 47
-Subparagraph (a)
-Publisher FASB
-URI https://asc.fasb.org/1943274/2147482785/280-10-55-47
Reference 2: http://www.xbrl.org/2003/role/exampleRef
-Topic 280
-SubTopic 10
-Name Accounting Standards Codification
-Section 55
-Paragraph 54
-Subparagraph (e)
-Publisher FASB
-URI https://asc.fasb.org/1943274/2147482785/280-10-55-54
Reference 3: http://www.xbrl.org/2009/role/commonPracticeRef
-Topic 280
-SubTopic 10
-Name Accounting Standards Codification
-Section 50
-Paragraph 18
-Publisher FASB
-URI https://asc.fasb.org/1943274/2147482810/280-10-50-18
| Name: |
us-gaap_NumberOfReportableSegments |
| Namespace Prefix: |
us-gaap_ |
| Data Type: |
xbrli:integerItemType |
| Balance Type: |
na |
| Period Type: |
duration |
|
| X |
- DefinitionRepresents the number of restaurants.
| Name: |
us-gaap_NumberOfRestaurants |
| Namespace Prefix: |
us-gaap_ |
| Data Type: |
xbrli:integerItemType |
| Balance Type: |
na |
| Period Type: |
instant |
|
| X |
- DefinitionPeriod over which grantee's right to exercise award under share-based payment arrangement is no longer contingent on satisfaction of service or performance condition, in 'PnYnMnDTnHnMnS' format, for example, 'P1Y5M13D' represents reported fact of one year, five months, and thirteen days. Includes, but is not limited to, combination of market, performance or service condition. Reference 1: http://www.xbrl.org/2003/role/exampleRef
-Topic 718
-SubTopic 10
-Name Accounting Standards Codification
-Section 50
-Paragraph 2
-Subparagraph (a)(1)
-Publisher FASB
-URI https://asc.fasb.org/1943274/2147480429/718-10-50-2
| Name: |
us-gaap_ShareBasedCompensationArrangementByShareBasedPaymentAwardAwardVestingPeriod1 |
| Namespace Prefix: |
us-gaap_ |
| Data Type: |
xbrli:durationItemType |
| Balance Type: |
na |
| Period Type: |
duration |
|
| X |
- DefinitionPercentage of vesting of award under share-based payment arrangement. Reference 1: http://www.xbrl.org/2009/role/commonPracticeRef
-Topic 718
-SubTopic 10
-Name Accounting Standards Codification
-Section 50
-Paragraph 2
-Subparagraph (a)(1)
-Publisher FASB
-URI https://asc.fasb.org/1943274/2147480429/718-10-50-2
| Name: |
us-gaap_SharebasedCompensationArrangementBySharebasedPaymentAwardAwardVestingRightsPercentage |
| Namespace Prefix: |
us-gaap_ |
| Data Type: |
dtr-types:percentItemType |
| Balance Type: |
na |
| Period Type: |
duration |
|
| X |
- DefinitionPeriod from grant date that an equity-based award expires, in 'PnYnMnDTnHnMnS' format, for example, 'P1Y5M13D' represents the reported fact of one year, five months, and thirteen days. Reference 1: http://www.xbrl.org/2003/role/exampleRef
-Topic 718
-SubTopic 10
-Name Accounting Standards Codification
-Section 50
-Paragraph 2
-Subparagraph (a)(2)
-Publisher FASB
-URI https://asc.fasb.org/1943274/2147480429/718-10-50-2
| Name: |
us-gaap_SharebasedCompensationArrangementBySharebasedPaymentAwardExpirationPeriod |
| Namespace Prefix: |
us-gaap_ |
| Data Type: |
xbrli:durationItemType |
| Balance Type: |
na |
| Period Type: |
duration |
|
| X |
- DefinitionRatio applied to the conversion of stock split, for example but not limited to, one share converted to two or two shares converted to one. Reference 1: http://fasb.org/us-gaap/role/ref/legacyRef
-Topic 505
-SubTopic 10
-Name Accounting Standards Codification
-Section S99
-Paragraph 4
-Subparagraph (SAB Topic 4.C)
-Publisher FASB
-URI https://asc.fasb.org/1943274/2147480008/505-10-S99-4
| Name: |
us-gaap_StockholdersEquityNoteStockSplitConversionRatio1 |
| Namespace Prefix: |
us-gaap_ |
| Data Type: |
xbrli:pureItemType |
| Balance Type: |
na |
| Period Type: |
duration |
|
| X |
- Details
| Name: |
us-gaap_FranchisorDisclosureAxis=cmg_LicensedUnitsMember |
| Namespace Prefix: |
|
| Data Type: |
na |
| Balance Type: |
|
| Period Type: |
|
|
| X |
- Details
| Name: |
us-gaap_GeographicDistributionAxis=us-gaap_GeographicDistributionForeignMember |
| Namespace Prefix: |
|
| Data Type: |
na |
| Balance Type: |
|
| Period Type: |
|
|
| X |
- Details
| Name: |
srt_RangeAxis=srt_MinimumMember |
| Namespace Prefix: |
|
| Data Type: |
na |
| Balance Type: |
|
| Period Type: |
|
|
| X |
- Details
| Name: |
srt_RangeAxis=srt_MaximumMember |
| Namespace Prefix: |
|
| Data Type: |
na |
| Balance Type: |
|
| Period Type: |
|
|
| X |
- Details
| Name: |
srt_ProductOrServiceAxis=cmg_ChipotleMember |
| Namespace Prefix: |
|
| Data Type: |
na |
| Balance Type: |
|
| Period Type: |
|
|
| X |
- Details
| Name: |
us-gaap_GeographicDistributionAxis=us-gaap_GeographicDistributionDomesticMember |
| Namespace Prefix: |
|
| Data Type: |
na |
| Balance Type: |
|
| Period Type: |
|
|
| X |
- Details
| Name: |
us-gaap_AwardTypeAxis=us-gaap_RestrictedStockUnitsRSUMember |
| Namespace Prefix: |
|
| Data Type: |
na |
| Balance Type: |
|
| Period Type: |
|
|
| X |
- Details
| Name: |
us-gaap_VestingAxis=us-gaap_ShareBasedCompensationAwardTrancheOneMember |
| Namespace Prefix: |
|
| Data Type: |
na |
| Balance Type: |
|
| Period Type: |
|
|
| X |
- Details
| Name: |
us-gaap_VestingAxis=us-gaap_ShareBasedCompensationAwardTrancheTwoMember |
| Namespace Prefix: |
|
| Data Type: |
na |
| Balance Type: |
|
| Period Type: |
|
|
| X |
- Details
| Name: |
us-gaap_AwardTypeAxis=us-gaap_StockAppreciationRightsSARSMember |
| Namespace Prefix: |
|
| Data Type: |
na |
| Balance Type: |
|
| Period Type: |
|
|
v3.25.0.1
| X |
- DefinitionLine items represent financial concepts included in a table. These concepts are used to disclose reportable information associated with domain members defined in one or many axes to the table. Reference 1: http://www.xbrl.org/2003/role/disclosureRef
-Topic 842
-SubTopic 20
-Name Accounting Standards Codification
-Section 50
-Paragraph 7A
-Subparagraph (a)
-Publisher FASB
-URI https://asc.fasb.org/1943274/2147478964/842-20-50-7A
| Name: |
us-gaap_PropertyPlantAndEquipmentLineItems |
| Namespace Prefix: |
us-gaap_ |
| Data Type: |
xbrli:stringItemType |
| Balance Type: |
na |
| Period Type: |
duration |
|
| X |
- DefinitionUseful life of long lived, physical assets used in the normal conduct of business and not intended for resale, in 'PnYnMnDTnHnMnS' format, for example, 'P1Y5M13D' represents the reported fact of one year, five months, and thirteen days. Examples include, but not limited to, land, buildings, machinery and equipment, office equipment, furniture and fixtures, and computer equipment.
| Name: |
us-gaap_PropertyPlantAndEquipmentUsefulLife |
| Namespace Prefix: |
us-gaap_ |
| Data Type: |
xbrli:durationItemType |
| Balance Type: |
na |
| Period Type: |
instant |
|
| X |
- Details
| Name: |
us-gaap_PropertyPlantAndEquipmentByTypeAxis=cmg_LeaseholdImprovementsAndBuildingsMember |
| Namespace Prefix: |
|
| Data Type: |
na |
| Balance Type: |
|
| Period Type: |
|
|
| X |
- Details
| Name: |
srt_RangeAxis=srt_MinimumMember |
| Namespace Prefix: |
|
| Data Type: |
na |
| Balance Type: |
|
| Period Type: |
|
|
| X |
- Details
| Name: |
srt_RangeAxis=srt_MaximumMember |
| Namespace Prefix: |
|
| Data Type: |
na |
| Balance Type: |
|
| Period Type: |
|
|
| X |
- Details
| Name: |
us-gaap_PropertyPlantAndEquipmentByTypeAxis=us-gaap_FurnitureAndFixturesMember |
| Namespace Prefix: |
|
| Data Type: |
na |
| Balance Type: |
|
| Period Type: |
|
|
| X |
- Details
| Name: |
us-gaap_PropertyPlantAndEquipmentByTypeAxis=us-gaap_EquipmentMember |
| Namespace Prefix: |
|
| Data Type: |
na |
| Balance Type: |
|
| Period Type: |
|
|
v3.25.0.1
| X |
- DefinitionAmount of current assets classified as other. Reference 1: http://www.xbrl.org/2003/role/exampleRef
-Topic 852
-SubTopic 10
-Name Accounting Standards Codification
-Section 55
-Paragraph 10
-Publisher FASB
-URI https://asc.fasb.org/1943274/2147481372/852-10-55-10
Reference 2: http://www.xbrl.org/2003/role/disclosureRef
-Topic 210
-SubTopic 10
-Name Accounting Standards Codification
-Section S99
-Paragraph 1
-Subparagraph (SX 210.5-02(8))
-Publisher FASB
-URI https://asc.fasb.org/1943274/2147480566/210-10-S99-1
| Name: |
us-gaap_OtherAssetsCurrent |
| Namespace Prefix: |
us-gaap_ |
| Data Type: |
xbrli:monetaryItemType |
| Balance Type: |
debit |
| Period Type: |
instant |
|
| X |
- DefinitionAmount of asset related to consideration paid in advance for costs that provide economic benefits in future periods, and amount of other assets that are expected to be realized or consumed within one year or the normal operating cycle, if longer. Reference 1: http://www.xbrl.org/2009/role/commonPracticeRef
-Topic 210
-SubTopic 10
-Name Accounting Standards Codification
-Section S99
-Paragraph 1
-Subparagraph (SX 210.5-02(9))
-Publisher FASB
-URI https://asc.fasb.org/1943274/2147480566/210-10-S99-1
| Name: |
us-gaap_PrepaidExpenseAndOtherAssetsCurrent |
| Namespace Prefix: |
us-gaap_ |
| Data Type: |
xbrli:monetaryItemType |
| Balance Type: |
debit |
| Period Type: |
instant |
|
| X |
- DefinitionAmount of asset related to consideration paid in advance for costs that provide economic benefits within a future period of one year or the normal operating cycle, if longer. Reference 1: http://www.xbrl.org/2003/role/exampleRef
-Topic 210
-SubTopic 10
-Name Accounting Standards Codification
-Section 45
-Paragraph 1
-Subparagraph (g)
-Publisher FASB
-URI https://asc.fasb.org/1943274/2147483467/210-10-45-1
Reference 2: http://www.xbrl.org/2003/role/disclosureRef
-Topic 210
-SubTopic 10
-Name Accounting Standards Codification
-Section S99
-Paragraph 1
-Subparagraph (SX 210.5-02(7))
-Publisher FASB
-URI https://asc.fasb.org/1943274/2147480566/210-10-S99-1
Reference 3: http://www.xbrl.org/2003/role/disclosureRef
-Topic 340
-SubTopic 10
-Name Accounting Standards Codification
-Section 05
-Paragraph 5
-Publisher FASB
-URI https://asc.fasb.org/1943274/2147482955/340-10-05-5
Reference 4: http://www.xbrl.org/2003/role/disclosureRef
-Topic 340
-SubTopic 10
-Name Accounting Standards Codification
-Section 45
-Paragraph 1
-Publisher FASB
-URI https://asc.fasb.org/1943274/2147483032/340-10-45-1
| Name: |
us-gaap_PrepaidExpenseCurrent |
| Namespace Prefix: |
us-gaap_ |
| Data Type: |
xbrli:monetaryItemType |
| Balance Type: |
debit |
| Period Type: |
instant |
|
v3.25.0.1
Supplemental Balance Sheet Information - Schedule of Leasehold Improvements, Property and Equipment (Details) - USD ($)
$ in Thousands |
Dec. 31, 2024 |
Dec. 31, 2023 |
| Property, Plant and Equipment [Line Items] |
|
|
| Leasehold improvements, property and equipment, gross |
$ 4,639,427
|
$ 4,152,060
|
| Accumulated depreciation |
(2,249,301)
|
(1,982,022)
|
| Leasehold improvements, property and equipment, net |
2,390,126
|
2,170,038
|
| Land |
|
|
| Property, Plant and Equipment [Line Items] |
|
|
| Leasehold improvements, property and equipment, gross |
12,943
|
12,943
|
| Leasehold improvements and buildings |
|
|
| Property, Plant and Equipment [Line Items] |
|
|
| Leasehold improvements, property and equipment, gross |
2,918,408
|
2,595,866
|
| Furniture and fixtures |
|
|
| Property, Plant and Equipment [Line Items] |
|
|
| Leasehold improvements, property and equipment, gross |
293,841
|
267,294
|
| Equipment |
|
|
| Property, Plant and Equipment [Line Items] |
|
|
| Leasehold improvements, property and equipment, gross |
1,221,290
|
1,114,236
|
| Construction in Progress |
|
|
| Property, Plant and Equipment [Line Items] |
|
|
| Leasehold improvements, property and equipment, gross |
$ 192,945
|
$ 161,721
|
| X |
- DefinitionAmount of accumulated depreciation, depletion and amortization for physical assets used in the normal conduct of business to produce goods and services. Reference 1: http://www.xbrl.org/2003/role/disclosureRef
-Topic 944
-SubTopic 210
-Name Accounting Standards Codification
-Section S99
-Paragraph 1
-Subparagraph (SX 210.7-03(a)(8)(b))
-Publisher FASB
-URI https://asc.fasb.org/1943274/2147478777/944-210-S99-1
Reference 2: http://www.xbrl.org/2003/role/disclosureRef
-Topic 210
-SubTopic 10
-Name Accounting Standards Codification
-Section S99
-Paragraph 1
-Subparagraph (SX 210.5-02(14))
-Publisher FASB
-URI https://asc.fasb.org/1943274/2147480566/210-10-S99-1
Reference 3: http://fasb.org/us-gaap/role/ref/legacyRef
-Name Accounting Standards Codification
-Topic 360
-SubTopic 10
-Section 50
-Paragraph 1
-Subparagraph (c)
-Publisher FASB
-URI https://asc.fasb.org/1943274/2147482099/360-10-50-1
| Name: |
us-gaap_AccumulatedDepreciationDepletionAndAmortizationPropertyPlantAndEquipment |
| Namespace Prefix: |
us-gaap_ |
| Data Type: |
xbrli:monetaryItemType |
| Balance Type: |
credit |
| Period Type: |
instant |
|
| X |
- DefinitionAmount before accumulated depreciation, depletion and amortization of physical assets used in the normal conduct of business and not intended for resale. Examples include, but are not limited to, land, buildings, machinery and equipment, office equipment, and furniture and fixtures. Reference 1: http://www.xbrl.org/2003/role/disclosureRef
-Topic 944
-SubTopic 210
-Name Accounting Standards Codification
-Section S99
-Paragraph 1
-Subparagraph (SX 210.7-03(a)(8))
-Publisher FASB
-URI https://asc.fasb.org/1943274/2147478777/944-210-S99-1
Reference 2: http://www.xbrl.org/2003/role/disclosureRef
-Topic 210
-SubTopic 10
-Name Accounting Standards Codification
-Section S99
-Paragraph 1
-Subparagraph (SX 210.5-02(13))
-Publisher FASB
-URI https://asc.fasb.org/1943274/2147480566/210-10-S99-1
Reference 3: http://fasb.org/us-gaap/role/ref/legacyRef
-Topic 360
-SubTopic 10
-Name Accounting Standards Codification
-Section 50
-Paragraph 1
-Subparagraph (b)
-Publisher FASB
-URI https://asc.fasb.org/1943274/2147482099/360-10-50-1
| Name: |
us-gaap_PropertyPlantAndEquipmentGross |
| Namespace Prefix: |
us-gaap_ |
| Data Type: |
xbrli:monetaryItemType |
| Balance Type: |
debit |
| Period Type: |
instant |
|
| X |
- DefinitionLine items represent financial concepts included in a table. These concepts are used to disclose reportable information associated with domain members defined in one or many axes to the table. Reference 1: http://www.xbrl.org/2003/role/disclosureRef
-Topic 842
-SubTopic 20
-Name Accounting Standards Codification
-Section 50
-Paragraph 7A
-Subparagraph (a)
-Publisher FASB
-URI https://asc.fasb.org/1943274/2147478964/842-20-50-7A
| Name: |
us-gaap_PropertyPlantAndEquipmentLineItems |
| Namespace Prefix: |
us-gaap_ |
| Data Type: |
xbrli:stringItemType |
| Balance Type: |
na |
| Period Type: |
duration |
|
| X |
- DefinitionAmount after accumulated depreciation, depletion and amortization of physical assets used in the normal conduct of business to produce goods and services and not intended for resale. Examples include, but are not limited to, land, buildings, machinery and equipment, office equipment, and furniture and fixtures. Reference 1: http://fasb.org/us-gaap/role/ref/legacyRef
-Name Accounting Standards Codification
-Section 50
-Paragraph 1
-SubTopic 10
-Topic 360
-Publisher FASB
-URI https://asc.fasb.org/1943274/2147482099/360-10-50-1
Reference 2: http://www.xbrl.org/2003/role/disclosureRef
-Topic 842
-SubTopic 20
-Name Accounting Standards Codification
-Section 50
-Paragraph 7A
-Subparagraph (a)
-Publisher FASB
-URI https://asc.fasb.org/1943274/2147478964/842-20-50-7A
Reference 3: http://www.xbrl.org/2003/role/exampleRef
-Topic 852
-SubTopic 10
-Name Accounting Standards Codification
-Section 55
-Paragraph 10
-Publisher FASB
-URI https://asc.fasb.org/1943274/2147481372/852-10-55-10
Reference 4: http://www.xbrl.org/2003/role/disclosureRef
-Topic 944
-SubTopic 210
-Name Accounting Standards Codification
-Section S99
-Paragraph 1
-Subparagraph (SX 210.7-03(a)(8))
-Publisher FASB
-URI https://asc.fasb.org/1943274/2147478777/944-210-S99-1
Reference 5: http://www.xbrl.org/2003/role/disclosureRef
-Topic 942
-SubTopic 360
-Name Accounting Standards Codification
-Section 50
-Paragraph 1
-Publisher FASB
-URI https://asc.fasb.org/1943274/2147478451/942-360-50-1
| Name: |
us-gaap_PropertyPlantAndEquipmentNet |
| Namespace Prefix: |
us-gaap_ |
| Data Type: |
xbrli:monetaryItemType |
| Balance Type: |
debit |
| Period Type: |
instant |
|
| X |
- Details
| Name: |
us-gaap_PropertyPlantAndEquipmentByTypeAxis=us-gaap_LandMember |
| Namespace Prefix: |
|
| Data Type: |
na |
| Balance Type: |
|
| Period Type: |
|
|
| X |
- Details
| Name: |
us-gaap_PropertyPlantAndEquipmentByTypeAxis=cmg_LeaseholdImprovementsAndBuildingsMember |
| Namespace Prefix: |
|
| Data Type: |
na |
| Balance Type: |
|
| Period Type: |
|
|
| X |
- Details
| Name: |
us-gaap_PropertyPlantAndEquipmentByTypeAxis=us-gaap_FurnitureAndFixturesMember |
| Namespace Prefix: |
|
| Data Type: |
na |
| Balance Type: |
|
| Period Type: |
|
|
| X |
- Details
| Name: |
us-gaap_PropertyPlantAndEquipmentByTypeAxis=us-gaap_EquipmentMember |
| Namespace Prefix: |
|
| Data Type: |
na |
| Balance Type: |
|
| Period Type: |
|
|
| X |
- Details
| Name: |
us-gaap_PropertyPlantAndEquipmentByTypeAxis=us-gaap_ConstructionInProgressMember |
| Namespace Prefix: |
|
| Data Type: |
na |
| Balance Type: |
|
| Period Type: |
|
|
v3.25.0.1
Supplemental Balance Sheet Information - Schedule of Accrued Payroll and Benefits (Details) - USD ($)
$ in Thousands |
Dec. 31, 2024 |
Dec. 31, 2023 |
| Supplemental Balance Sheet Information [Abstract] |
|
|
| Workers' compensation liability |
$ 35,242
|
$ 30,520
|
| Accrued payroll, bonuses and taxes |
195,660
|
170,251
|
| Other accrued payroll and benefits |
31,011
|
26,766
|
| Accrued payroll and benefits |
$ 261,913
|
$ 227,537
|
| X |
- DefinitionCarrying value as of the balance sheet date of the obligations incurred through that date and payable for employees' services provided. Used to reflect the current portion of the liabilities (due within one year or within the normal operating cycle if longer). Reference 1: http://fasb.org/us-gaap/role/ref/legacyRef
-Topic 210
-SubTopic 10
-Name Accounting Standards Codification
-Section S99
-Paragraph 1
-Subparagraph (SX 210.5-02(20))
-Publisher FASB
-URI https://asc.fasb.org/1943274/2147480566/210-10-S99-1
Reference 2: http://www.xbrl.org/2003/role/exampleRef
-Topic 210
-SubTopic 10
-Name Accounting Standards Codification
-Section 45
-Paragraph 8
-Subparagraph (c)
-Publisher FASB
-URI https://asc.fasb.org/1943274/2147483467/210-10-45-8
| Name: |
us-gaap_AccruedSalariesCurrent |
| Namespace Prefix: |
us-gaap_ |
| Data Type: |
xbrli:monetaryItemType |
| Balance Type: |
credit |
| Period Type: |
instant |
|
| X |
- DefinitionCarrying value as of the balance sheet date of obligations and payables pertaining to claims incurred of a workers compensation nature. Used to reflect the current portion of the liabilities (due within one year or within the normal operating cycle if longer). Reference 1: http://fasb.org/us-gaap/role/ref/legacyRef
-Topic 210
-SubTopic 10
-Name Accounting Standards Codification
-Section S99
-Paragraph 1
-Subparagraph (SX 210.5-02(20))
-Publisher FASB
-URI https://asc.fasb.org/1943274/2147480566/210-10-S99-1
| Name: |
us-gaap_WorkersCompensationLiabilityCurrent |
| Namespace Prefix: |
us-gaap_ |
| Data Type: |
xbrli:monetaryItemType |
| Balance Type: |
credit |
| Period Type: |
instant |
|
v3.25.0.1
Supplemental Balance Sheet Information - Schedule of Accrued Liabilities (Details) - USD ($)
$ in Thousands |
Dec. 31, 2024 |
Dec. 31, 2023 |
| Supplemental Balance Sheet Information [Abstract] |
|
|
| Sales and use tax payable |
$ 47,206
|
$ 42,071
|
| General, product and automobile insurance reserves |
34,404
|
30,169
|
| Other accrued liabilities |
98,137
|
75,448
|
| Accrued liabilities |
$ 179,747
|
$ 147,688
|
| X |
- DefinitionGeneral, product and automobile insurance reserves.
| Name: |
cmg_GeneralProductAndAutomobileInsuranceReserves |
| Namespace Prefix: |
cmg_ |
| Data Type: |
xbrli:monetaryItemType |
| Balance Type: |
credit |
| Period Type: |
instant |
|
| X |
- DefinitionCarrying value as of the balance sheet date of obligations incurred and payable, pertaining to costs that are statutory in nature, are incurred on contractual obligations, or accumulate over time and for which invoices have not yet been received or will not be rendered. Examples include taxes, interest, rent and utilities. Used to reflect the current portion of the liabilities (due within one year or within the normal operating cycle if longer). Reference 1: http://fasb.org/us-gaap/role/ref/legacyRef
-Topic 210
-SubTopic 10
-Name Accounting Standards Codification
-Section S99
-Paragraph 1
-Subparagraph (SX 210.5-02(20))
-Publisher FASB
-URI https://asc.fasb.org/1943274/2147480566/210-10-S99-1
| Name: |
us-gaap_AccruedLiabilitiesCurrent |
| Namespace Prefix: |
us-gaap_ |
| Data Type: |
xbrli:monetaryItemType |
| Balance Type: |
credit |
| Period Type: |
instant |
|
| X |
- DefinitionAmount of expenses incurred but not yet paid classified as other, due within one year or the normal operating cycle, if longer. Reference 1: http://fasb.org/us-gaap/role/ref/legacyRef
-Topic 210
-SubTopic 10
-Name Accounting Standards Codification
-Section S99
-Paragraph 1
-Subparagraph (SX 210.5-02(20))
-Publisher FASB
-URI https://asc.fasb.org/1943274/2147480566/210-10-S99-1
| Name: |
us-gaap_OtherAccruedLiabilitiesCurrent |
| Namespace Prefix: |
us-gaap_ |
| Data Type: |
xbrli:monetaryItemType |
| Balance Type: |
credit |
| Period Type: |
instant |
|
| X |
- DefinitionCarrying value as of the balance sheet date of liabilities incurred through that date and payable for statutory sales and use taxes, including value added tax. Used to reflect the current portion of the liabilities (due within one year or within the normal operating cycle if longer). Reference 1: http://fasb.org/us-gaap/role/ref/legacyRef
-Topic 210
-SubTopic 10
-Name Accounting Standards Codification
-Section S99
-Paragraph 1
-Subparagraph (SX 210.5-02(19)(a))
-Publisher FASB
-URI https://asc.fasb.org/1943274/2147480566/210-10-S99-1
| Name: |
us-gaap_SalesAndExciseTaxPayableCurrent |
| Namespace Prefix: |
us-gaap_ |
| Data Type: |
xbrli:monetaryItemType |
| Balance Type: |
credit |
| Period Type: |
instant |
|
v3.25.0.1
| X |
- DefinitionAmount of obligation to transfer good or service to customer for which consideration has been received or is receivable, classified as current. Reference 1: http://www.xbrl.org/2003/role/disclosureRef
-Topic 606
-SubTopic 10
-Name Accounting Standards Codification
-Section 45
-Paragraph 1
-Publisher FASB
-URI https://asc.fasb.org/1943274/2147479837/606-10-45-1
Reference 2: http://www.xbrl.org/2003/role/disclosureRef
-Topic 606
-SubTopic 10
-Name Accounting Standards Codification
-Section 50
-Paragraph 8
-Subparagraph (a)
-Publisher FASB
-URI https://asc.fasb.org/1943274/2147479806/606-10-50-8
Reference 3: http://www.xbrl.org/2003/role/disclosureRef
-Topic 606
-SubTopic 10
-Name Accounting Standards Codification
-Section 45
-Paragraph 2
-Publisher FASB
-URI https://asc.fasb.org/1943274/2147479837/606-10-45-2
| Name: |
us-gaap_ContractWithCustomerLiabilityCurrent |
| Namespace Prefix: |
us-gaap_ |
| Data Type: |
xbrli:monetaryItemType |
| Balance Type: |
credit |
| Period Type: |
instant |
|
| X |
- DefinitionLine items represent financial concepts included in a table. These concepts are used to disclose reportable information associated with domain members defined in one or many axes to the table. Reference 1: http://www.xbrl.org/2003/role/disclosureRef
-Topic 606
-SubTopic 10
-Name Accounting Standards Codification
-Section 50
-Paragraph 5
-Publisher FASB
-URI https://asc.fasb.org/1943274/2147479806/606-10-50-5
Reference 2: http://www.xbrl.org/2003/role/exampleRef
-Topic 606
-SubTopic 10
-Name Accounting Standards Codification
-Section 55
-Paragraph 91
-Subparagraph (a)
-Publisher FASB
-URI https://asc.fasb.org/1943274/2147479777/606-10-55-91
Reference 3: http://www.xbrl.org/2003/role/exampleRef
-Topic 606
-SubTopic 10
-Name Accounting Standards Codification
-Section 55
-Paragraph 91
-Subparagraph (b)
-Publisher FASB
-URI https://asc.fasb.org/1943274/2147479777/606-10-55-91
Reference 4: http://www.xbrl.org/2003/role/exampleRef
-Topic 606
-SubTopic 10
-Name Accounting Standards Codification
-Section 55
-Paragraph 91
-Subparagraph (c)
-Publisher FASB
-URI https://asc.fasb.org/1943274/2147479777/606-10-55-91
Reference 5: http://www.xbrl.org/2003/role/exampleRef
-Topic 606
-SubTopic 10
-Name Accounting Standards Codification
-Section 55
-Paragraph 91
-Subparagraph (d)
-Publisher FASB
-URI https://asc.fasb.org/1943274/2147479777/606-10-55-91
Reference 6: http://www.xbrl.org/2003/role/exampleRef
-Topic 606
-SubTopic 10
-Name Accounting Standards Codification
-Section 55
-Paragraph 91
-Subparagraph (e)
-Publisher FASB
-URI https://asc.fasb.org/1943274/2147479777/606-10-55-91
Reference 7: http://www.xbrl.org/2003/role/exampleRef
-Topic 606
-SubTopic 10
-Name Accounting Standards Codification
-Section 55
-Paragraph 91
-Subparagraph (f)
-Publisher FASB
-URI https://asc.fasb.org/1943274/2147479777/606-10-55-91
Reference 8: http://www.xbrl.org/2003/role/exampleRef
-Topic 606
-SubTopic 10
-Name Accounting Standards Codification
-Section 55
-Paragraph 91
-Subparagraph (g)
-Publisher FASB
-URI https://asc.fasb.org/1943274/2147479777/606-10-55-91
| Name: |
us-gaap_DisaggregationOfRevenueLineItems |
| Namespace Prefix: |
us-gaap_ |
| Data Type: |
xbrli:stringItemType |
| Balance Type: |
na |
| Period Type: |
duration |
|
| X |
- Details
| Name: |
srt_ProductOrServiceAxis=cmg_GiftCardMember |
| Namespace Prefix: |
|
| Data Type: |
na |
| Balance Type: |
|
| Period Type: |
|
|
v3.25.0.1
| X |
- DefinitionAmount of revenue recognized that was previously included in balance of obligation to transfer good or service to customer for which consideration from customer has been received or is due. Reference 1: http://www.xbrl.org/2003/role/disclosureRef
-Topic 606
-SubTopic 10
-Name Accounting Standards Codification
-Section 50
-Paragraph 8
-Subparagraph (b)
-Publisher FASB
-URI https://asc.fasb.org/1943274/2147479806/606-10-50-8
| Name: |
us-gaap_ContractWithCustomerLiabilityRevenueRecognized |
| Namespace Prefix: |
us-gaap_ |
| Data Type: |
xbrli:monetaryItemType |
| Balance Type: |
credit |
| Period Type: |
duration |
|
| X |
- DefinitionLine items represent financial concepts included in a table. These concepts are used to disclose reportable information associated with domain members defined in one or many axes to the table. Reference 1: http://www.xbrl.org/2003/role/disclosureRef
-Topic 606
-SubTopic 10
-Name Accounting Standards Codification
-Section 50
-Paragraph 5
-Publisher FASB
-URI https://asc.fasb.org/1943274/2147479806/606-10-50-5
Reference 2: http://www.xbrl.org/2003/role/exampleRef
-Topic 606
-SubTopic 10
-Name Accounting Standards Codification
-Section 55
-Paragraph 91
-Subparagraph (a)
-Publisher FASB
-URI https://asc.fasb.org/1943274/2147479777/606-10-55-91
Reference 3: http://www.xbrl.org/2003/role/exampleRef
-Topic 606
-SubTopic 10
-Name Accounting Standards Codification
-Section 55
-Paragraph 91
-Subparagraph (b)
-Publisher FASB
-URI https://asc.fasb.org/1943274/2147479777/606-10-55-91
Reference 4: http://www.xbrl.org/2003/role/exampleRef
-Topic 606
-SubTopic 10
-Name Accounting Standards Codification
-Section 55
-Paragraph 91
-Subparagraph (c)
-Publisher FASB
-URI https://asc.fasb.org/1943274/2147479777/606-10-55-91
Reference 5: http://www.xbrl.org/2003/role/exampleRef
-Topic 606
-SubTopic 10
-Name Accounting Standards Codification
-Section 55
-Paragraph 91
-Subparagraph (d)
-Publisher FASB
-URI https://asc.fasb.org/1943274/2147479777/606-10-55-91
Reference 6: http://www.xbrl.org/2003/role/exampleRef
-Topic 606
-SubTopic 10
-Name Accounting Standards Codification
-Section 55
-Paragraph 91
-Subparagraph (e)
-Publisher FASB
-URI https://asc.fasb.org/1943274/2147479777/606-10-55-91
Reference 7: http://www.xbrl.org/2003/role/exampleRef
-Topic 606
-SubTopic 10
-Name Accounting Standards Codification
-Section 55
-Paragraph 91
-Subparagraph (f)
-Publisher FASB
-URI https://asc.fasb.org/1943274/2147479777/606-10-55-91
Reference 8: http://www.xbrl.org/2003/role/exampleRef
-Topic 606
-SubTopic 10
-Name Accounting Standards Codification
-Section 55
-Paragraph 91
-Subparagraph (g)
-Publisher FASB
-URI https://asc.fasb.org/1943274/2147479777/606-10-55-91
| Name: |
us-gaap_DisaggregationOfRevenueLineItems |
| Namespace Prefix: |
us-gaap_ |
| Data Type: |
xbrli:stringItemType |
| Balance Type: |
na |
| Period Type: |
duration |
|
| X |
- Details
| Name: |
srt_ProductOrServiceAxis=cmg_GiftCardMember |
| Namespace Prefix: |
|
| Data Type: |
na |
| Balance Type: |
|
| Period Type: |
|
|
v3.25.0.1
Revenue Recognition - Changes in Liability Balance (Details) - USD ($)
$ in Thousands |
12 Months Ended |
Dec. 31, 2024 |
Dec. 31, 2023 |
Dec. 31, 2022 |
| Contract With Customer Contract Asset Contract Liability And Receivable [Roll Forward] |
|
|
|
| Chipotle Rewards liability, beginning balance |
$ 209,680
|
|
|
| Chipotle Rewards liability, ending balance |
238,577
|
$ 209,680
|
|
| Chipotle Rewards |
|
|
|
| Contract With Customer Contract Asset Contract Liability And Receivable [Roll Forward] |
|
|
|
| Chipotle Rewards liability, beginning balance |
44,750
|
38,057
|
$ 25,572
|
| Revenue deferred |
164,986
|
135,490
|
121,406
|
| Revenue recognized |
(152,930)
|
(128,797)
|
(108,921)
|
| Chipotle Rewards liability, ending balance |
$ 56,806
|
$ 44,750
|
$ 38,057
|
| X |
- DefinitionContract With Customer Contract Asset Contract Liability And Receivable
| Name: |
cmg_ContractWithCustomerContractAssetContractLiabilityAndReceivableRollForward |
| Namespace Prefix: |
cmg_ |
| Data Type: |
xbrli:stringItemType |
| Balance Type: |
na |
| Period Type: |
duration |
|
| X |
- DefinitionAmount of revenue deferred that was previously included in balance of obligation to transfer good or service to customer for which consideration from customer has been received or is due.
| Name: |
cmg_ContractWithCustomerLiabilityRevenueDeferred |
| Namespace Prefix: |
cmg_ |
| Data Type: |
xbrli:monetaryItemType |
| Balance Type: |
credit |
| Period Type: |
duration |
|
| X |
- DefinitionContract With Customer, Liability, Revenue Recognized, Excluding Opening Balance
| Name: |
cmg_ContractWithCustomerLiabilityRevenueRecognizedExcludingOpeningBalance |
| Namespace Prefix: |
cmg_ |
| Data Type: |
xbrli:monetaryItemType |
| Balance Type: |
credit |
| Period Type: |
duration |
|
| X |
- DefinitionAmount of obligation to transfer good or service to customer for which consideration has been received or is receivable, classified as current. Reference 1: http://www.xbrl.org/2003/role/disclosureRef
-Topic 606
-SubTopic 10
-Name Accounting Standards Codification
-Section 45
-Paragraph 1
-Publisher FASB
-URI https://asc.fasb.org/1943274/2147479837/606-10-45-1
Reference 2: http://www.xbrl.org/2003/role/disclosureRef
-Topic 606
-SubTopic 10
-Name Accounting Standards Codification
-Section 50
-Paragraph 8
-Subparagraph (a)
-Publisher FASB
-URI https://asc.fasb.org/1943274/2147479806/606-10-50-8
Reference 3: http://www.xbrl.org/2003/role/disclosureRef
-Topic 606
-SubTopic 10
-Name Accounting Standards Codification
-Section 45
-Paragraph 2
-Publisher FASB
-URI https://asc.fasb.org/1943274/2147479837/606-10-45-2
| Name: |
us-gaap_ContractWithCustomerLiabilityCurrent |
| Namespace Prefix: |
us-gaap_ |
| Data Type: |
xbrli:monetaryItemType |
| Balance Type: |
credit |
| Period Type: |
instant |
|
| X |
- Details
| Name: |
srt_ProductOrServiceAxis=cmg_ChipotleRewardsMember |
| Namespace Prefix: |
|
| Data Type: |
na |
| Balance Type: |
|
| Period Type: |
|
|
v3.25.0.1
Fair Value Measurements - Schedule of Cash, Cash Equivalents and Debt Investments by Significant Category (Details) - USD ($)
$ in Thousands |
Dec. 31, 2024 |
Dec. 31, 2023 |
| Fair Value, Balance Sheet Grouping, Financial Statement Captions [Line Items] |
|
|
| Cash |
$ 748,537
|
$ 560,609
|
| Total adjusted cost |
2,221,688
|
1,812,923
|
| Unrealized Gains |
5,208
|
5,654
|
| Unrealized Losses |
693
|
4,258
|
| Fair value, subtotal |
2,226,203
|
1,814,319
|
| Current Investments |
674,378
|
734,838
|
| Long-term Investments |
799,023
|
518,624
|
| Level 1 |
|
|
| Fair Value, Balance Sheet Grouping, Financial Statement Captions [Line Items] |
|
|
| Cash |
652,568
|
432,151
|
| Total adjusted cost |
2,105,555
|
1,652,564
|
| Unrealized Gains |
4,947
|
4,365
|
| Unrealized Losses |
693
|
4,090
|
| Fair value, subtotal |
2,109,809
|
1,652,839
|
| Current Investments |
670,128
|
731,339
|
| Long-term Investments |
782,859
|
489,074
|
| Level 3 |
|
|
| Fair Value, Balance Sheet Grouping, Financial Statement Captions [Line Items] |
|
|
| Adjusted cost |
20,164
|
31,901
|
| Unrealized Gains |
261
|
1,289
|
| Unrealized Losses |
0
|
168
|
| Fair Value |
20,425
|
33,022
|
| Current Investments |
4,250
|
3,499
|
| Long-term Investments |
16,164
|
29,550
|
| U.S. Treasury securities | Level 1 |
|
|
| Fair Value, Balance Sheet Grouping, Financial Statement Captions [Line Items] |
|
|
| Adjusted cost |
1,404,777
|
1,200,658
|
| Unrealized Gains |
4,831
|
4,352
|
| Unrealized Losses |
693
|
4,083
|
| Fair Value |
1,408,915
|
1,200,927
|
| Current Investments |
635,392
|
731,339
|
| Long-term Investments |
769,385
|
469,319
|
| Corporate debt securities | Level 1 |
|
|
| Fair Value, Balance Sheet Grouping, Financial Statement Captions [Line Items] |
|
|
| Adjusted cost |
48,210
|
19,755
|
| Unrealized Gains |
116
|
13
|
| Unrealized Losses |
|
7
|
| Fair Value |
48,326
|
19,761
|
| Current Investments |
34,736
|
|
| Long-term Investments |
13,474
|
19,755
|
| Corporate debt securities | Level 3 |
|
|
| Fair Value, Balance Sheet Grouping, Financial Statement Captions [Line Items] |
|
|
| Adjusted cost |
16,401
|
17,401
|
| Unrealized Gains |
11
|
|
| Unrealized Losses |
|
27
|
| Fair Value |
16,412
|
17,374
|
| Current Investments |
2,000
|
999
|
| Long-term Investments |
14,401
|
16,402
|
| Notes receivable | Level 3 |
|
|
| Fair Value, Balance Sheet Grouping, Financial Statement Captions [Line Items] |
|
|
| Adjusted cost |
3,763
|
14,500
|
| Unrealized Gains |
250
|
1,289
|
| Unrealized Losses |
|
141
|
| Fair Value |
4,013
|
15,648
|
| Current Investments |
2,250
|
2,500
|
| Long-term Investments |
1,763
|
13,148
|
| Cash |
|
|
| Fair Value, Balance Sheet Grouping, Financial Statement Captions [Line Items] |
|
|
| Cash |
95,969
|
128,458
|
| Money market funds | Level 1 |
|
|
| Fair Value, Balance Sheet Grouping, Financial Statement Captions [Line Items] |
|
|
| Cash |
574,689
|
355,872
|
| Time deposits | Level 1 |
|
|
| Fair Value, Balance Sheet Grouping, Financial Statement Captions [Line Items] |
|
|
| Cash |
$ 77,879
|
$ 76,279
|
| X |
- DefinitionCash And Cash Equivalents At Carrying Value And Debt Securities, Held-to-Maturity, Amortized Cost
| Name: |
cmg_CashAndCashEquivalentsAtCarryingValueAndDebtSecuritiesHeldToMaturityAmortizedCost |
| Namespace Prefix: |
cmg_ |
| Data Type: |
xbrli:monetaryItemType |
| Balance Type: |
debit |
| Period Type: |
instant |
|
| X |
- DefinitionCash And Cash Equivalents At Carrying Value And Debt Securities, Held-to-Maturity, Fair Value
| Name: |
cmg_CashAndCashEquivalentsAtCarryingValueAndDebtSecuritiesHeldToMaturityFairValue |
| Namespace Prefix: |
cmg_ |
| Data Type: |
xbrli:monetaryItemType |
| Balance Type: |
debit |
| Period Type: |
instant |
|
| X |
- DefinitionAmount of currency on hand as well as demand deposits with banks or financial institutions. Includes other kinds of accounts that have the general characteristics of demand deposits. Also includes short-term, highly liquid investments that are both readily convertible to known amounts of cash and so near their maturity that they present insignificant risk of changes in value because of changes in interest rates. Excludes cash and cash equivalents within disposal group and discontinued operation. Reference 1: http://www.xbrl.org/2003/role/disclosureRef
-Topic 210
-SubTopic 10
-Name Accounting Standards Codification
-Section S99
-Paragraph 1
-Subparagraph (SX 210.5-02(1))
-Publisher FASB
-URI https://asc.fasb.org/1943274/2147480566/210-10-S99-1
Reference 2: http://www.xbrl.org/2003/role/exampleRef
-Topic 210
-SubTopic 10
-Name Accounting Standards Codification
-Section 45
-Paragraph 1
-Subparagraph (a)
-Publisher FASB
-URI https://asc.fasb.org/1943274/2147483467/210-10-45-1
Reference 3: http://fasb.org/us-gaap/role/ref/legacyRef
-Name Accounting Standards Codification
-Topic 230
-SubTopic 10
-Section 45
-Paragraph 4
-Publisher FASB
-URI https://asc.fasb.org/1943274/2147482740/230-10-45-4
| Name: |
us-gaap_CashAndCashEquivalentsAtCarryingValue |
| Namespace Prefix: |
us-gaap_ |
| Data Type: |
xbrli:monetaryItemType |
| Balance Type: |
debit |
| Period Type: |
instant |
|
| X |
- DefinitionLine items represent financial concepts included in a table. These concepts are used to disclose reportable information associated with domain members defined in one or many axes to the table.
| Name: |
us-gaap_FairValueBalanceSheetGroupingFinancialStatementCaptionsLineItems |
| Namespace Prefix: |
us-gaap_ |
| Data Type: |
xbrli:stringItemType |
| Balance Type: |
na |
| Period Type: |
duration |
|
| X |
- DefinitionAmount, before allowance for credit loss, of investment in debt security measured at amortized cost (held-to-maturity). Reference 1: http://fasb.org/us-gaap/role/ref/otherTransitionRef
-Topic 310
-SubTopic 10
-Name Accounting Standards Codification
-Section 50
-Paragraph 7A
-Publisher FASB
-URI https://asc.fasb.org/1943274/2147481962/310-10-50-7A
Reference 2: http://www.xbrl.org/2009/role/commonPracticeRef
-Topic 326
-SubTopic 20
-Name Accounting Standards Codification
-Section 45
-Paragraph 1
-Publisher FASB
-URI https://asc.fasb.org/1943274/2147479344/326-20-45-1
Reference 3: http://www.xbrl.org/2003/role/disclosureRef
-Topic 320
-SubTopic 10
-Name Accounting Standards Codification
-Section 50
-Paragraph 5
-Subparagraph (a)
-Publisher FASB
-URI https://asc.fasb.org/1943274/2147481800/320-10-50-5
Reference 4: http://www.xbrl.org/2003/role/disclosureRef
-Topic 326
-SubTopic 20
-Name Accounting Standards Codification
-Section 50
-Paragraph 14
-Publisher FASB
-URI https://asc.fasb.org/1943274/2147479319/326-20-50-14
| Name: |
us-gaap_HeldToMaturitySecurities |
| Namespace Prefix: |
us-gaap_ |
| Data Type: |
xbrli:monetaryItemType |
| Balance Type: |
debit |
| Period Type: |
instant |
|
| X |
- DefinitionAmount of accumulated unrecognized gain on investment in debt security measured at amortized cost (held-to-maturity). Reference 1: http://fasb.org/us-gaap/role/ref/otherTransitionRef
-Topic 320
-SubTopic 10
-Name Accounting Standards Codification
-Section 50
-Paragraph 5
-Subparagraph (b)
-Publisher FASB
-URI https://asc.fasb.org/1943274/2147481800/320-10-50-5
Reference 2: http://www.xbrl.org/2003/role/disclosureRef
-Topic 320
-SubTopic 10
-Name Accounting Standards Codification
-Section 50
-Paragraph 5A
-Subparagraph (b)
-Publisher FASB
-URI https://asc.fasb.org/1943274/2147481800/320-10-50-5A
| Name: |
us-gaap_HeldToMaturitySecuritiesAccumulatedUnrecognizedHoldingGain |
| Namespace Prefix: |
us-gaap_ |
| Data Type: |
xbrli:monetaryItemType |
| Balance Type: |
credit |
| Period Type: |
instant |
|
| X |
- DefinitionAmount of accumulated unrealized loss on investment in debt security measured at amortized cost (held-to-maturity). Reference 1: http://fasb.org/us-gaap/role/ref/otherTransitionRef
-Topic 320
-SubTopic 10
-Name Accounting Standards Codification
-Section 50
-Paragraph 5
-Subparagraph (c)
-Publisher FASB
-URI https://asc.fasb.org/1943274/2147481800/320-10-50-5
Reference 2: http://www.xbrl.org/2003/role/disclosureRef
-Topic 320
-SubTopic 10
-Name Accounting Standards Codification
-Section 50
-Paragraph 5A
-Subparagraph (c)
-Publisher FASB
-URI https://asc.fasb.org/1943274/2147481800/320-10-50-5A
| Name: |
us-gaap_HeldToMaturitySecuritiesAccumulatedUnrecognizedHoldingLoss |
| Namespace Prefix: |
us-gaap_ |
| Data Type: |
xbrli:monetaryItemType |
| Balance Type: |
debit |
| Period Type: |
instant |
|
| X |
- DefinitionAmount, before allowance for credit loss, of investment in debt security measured at amortized cost (held-to-maturity), classified as current. Reference 1: http://www.xbrl.org/2009/role/commonPracticeRef
-Topic 326
-SubTopic 20
-Name Accounting Standards Codification
-Section 45
-Paragraph 1
-Publisher FASB
-URI https://asc.fasb.org/1943274/2147479344/326-20-45-1
Reference 2: http://www.xbrl.org/2009/role/commonPracticeRef
-Topic 320
-SubTopic 10
-Name Accounting Standards Codification
-Section 50
-Paragraph 5
-Subparagraph (a)
-Publisher FASB
-URI https://asc.fasb.org/1943274/2147481800/320-10-50-5
Reference 3: http://www.xbrl.org/2003/role/disclosureRef
-Topic 320
-SubTopic 10
-Name Accounting Standards Codification
-Section 45
-Paragraph 2
-Publisher FASB
-URI https://asc.fasb.org/1943274/2147481830/320-10-45-2
| Name: |
us-gaap_HeldToMaturitySecuritiesCurrent |
| Namespace Prefix: |
us-gaap_ |
| Data Type: |
xbrli:monetaryItemType |
| Balance Type: |
debit |
| Period Type: |
instant |
|
| X |
- DefinitionFair value of investment in debt security measured at amortized cost (held-to-maturity). Reference 1: http://www.xbrl.org/2003/role/disclosureRef
-Topic 820
-SubTopic 10
-Name Accounting Standards Codification
-Section 50
-Paragraph 2
-Subparagraph (b)
-Publisher FASB
-URI https://asc.fasb.org/1943274/2147482106/820-10-50-2
Reference 2: http://www.xbrl.org/2003/role/disclosureRef
-Topic 820
-SubTopic 10
-Name Accounting Standards Codification
-Section 50
-Paragraph 2E
-Publisher FASB
-URI https://asc.fasb.org/1943274/2147482106/820-10-50-2E
Reference 3: http://fasb.org/us-gaap/role/ref/otherTransitionRef
-Topic 320
-SubTopic 10
-Name Accounting Standards Codification
-Section 50
-Paragraph 5
-Subparagraph (aa)
-Publisher FASB
-URI https://asc.fasb.org/1943274/2147481800/320-10-50-5
Reference 4: http://www.xbrl.org/2003/role/disclosureRef
-Topic 944
-SubTopic 210
-Name Accounting Standards Codification
-Section S99
-Paragraph 1
-Subparagraph (SX 210.7-03(a)(1))
-Publisher FASB
-URI https://asc.fasb.org/1943274/2147478777/944-210-S99-1
Reference 5: http://www.xbrl.org/2003/role/disclosureRef
-Topic 320
-SubTopic 10
-Name Accounting Standards Codification
-Section 50
-Paragraph 5A
-Subparagraph (a)
-Publisher FASB
-URI https://asc.fasb.org/1943274/2147481800/320-10-50-5A
Reference 6: http://www.xbrl.org/2003/role/disclosureRef
-Topic 942
-SubTopic 210
-Name Accounting Standards Codification
-Section S99
-Paragraph 1
-Subparagraph (SX 210.9-03(6))
-Publisher FASB
-URI https://asc.fasb.org/1943274/2147478546/942-210-S99-1
| Name: |
us-gaap_HeldToMaturitySecuritiesFairValue |
| Namespace Prefix: |
us-gaap_ |
| Data Type: |
xbrli:monetaryItemType |
| Balance Type: |
debit |
| Period Type: |
instant |
|
| X |
- DefinitionAmount, before allowance for credit loss, of investment in debt security measured at amortized cost (held-to-maturity), classified as noncurrent. Reference 1: http://www.xbrl.org/2009/role/commonPracticeRef
-Topic 326
-SubTopic 20
-Name Accounting Standards Codification
-Section 45
-Paragraph 1
-Publisher FASB
-URI https://asc.fasb.org/1943274/2147479344/326-20-45-1
Reference 2: http://www.xbrl.org/2009/role/commonPracticeRef
-Topic 320
-SubTopic 10
-Name Accounting Standards Codification
-Section 50
-Paragraph 5
-Subparagraph (a)
-Publisher FASB
-URI https://asc.fasb.org/1943274/2147481800/320-10-50-5
Reference 3: http://www.xbrl.org/2003/role/disclosureRef
-Topic 320
-SubTopic 10
-Name Accounting Standards Codification
-Section 45
-Paragraph 2
-Publisher FASB
-URI https://asc.fasb.org/1943274/2147481830/320-10-45-2
| Name: |
us-gaap_HeldToMaturitySecuritiesNoncurrent |
| Namespace Prefix: |
us-gaap_ |
| Data Type: |
xbrli:monetaryItemType |
| Balance Type: |
debit |
| Period Type: |
instant |
|
| X |
- Details
| Name: |
us-gaap_FinancialInstrumentAxis=us-gaap_USTreasurySecuritiesMember |
| Namespace Prefix: |
|
| Data Type: |
na |
| Balance Type: |
|
| Period Type: |
|
|
| X |
- Details
| Name: |
us-gaap_FinancialInstrumentAxis=us-gaap_CorporateDebtSecuritiesMember |
| Namespace Prefix: |
|
| Data Type: |
na |
| Balance Type: |
|
| Period Type: |
|
|
| X |
- Details
| Name: |
us-gaap_FinancialInstrumentAxis=cmg_NoteReceivableMember |
| Namespace Prefix: |
|
| Data Type: |
na |
| Balance Type: |
|
| Period Type: |
|
|
| X |
- Details
| Name: |
us-gaap_CashAndCashEquivalentsAxis=us-gaap_CashMember |
| Namespace Prefix: |
|
| Data Type: |
na |
| Balance Type: |
|
| Period Type: |
|
|
| X |
- Details
| Name: |
us-gaap_CashAndCashEquivalentsAxis=us-gaap_MoneyMarketFundsMember |
| Namespace Prefix: |
|
| Data Type: |
na |
| Balance Type: |
|
| Period Type: |
|
|
| X |
- Details
| Name: |
us-gaap_CashAndCashEquivalentsAxis=us-gaap_BankTimeDepositsMember |
| Namespace Prefix: |
|
| Data Type: |
na |
| Balance Type: |
|
| Period Type: |
|
|
v3.25.0.1
| X |
- DefinitionThis item represents the carrying amount on the entity's balance sheet of its investment in common stock of an equity method investee. This is not an indicator of the fair value of the investment, rather it is the initial cost adjusted for the entity's share of earnings and losses of the investee, adjusted for any distributions (dividends) and other than temporary impairment (OTTI) losses recognized. Reference 1: http://www.xbrl.org/2003/role/disclosureRef
-Topic 270
-SubTopic 10
-Name Accounting Standards Codification
-Section 50
-Paragraph 1
-Subparagraph (i)
-Publisher FASB
-URI https://asc.fasb.org/1943274/2147482964/270-10-50-1
Reference 2: http://www.xbrl.org/2003/role/disclosureRef
-Topic 280
-SubTopic 10
-Name Accounting Standards Codification
-Section 50
-Paragraph 32
-Subparagraph (ee)
-Publisher FASB
-URI https://asc.fasb.org/1943274/2147482810/280-10-50-32
Reference 3: http://www.xbrl.org/2003/role/disclosureRef
-Topic 323
-SubTopic 10
-Name Accounting Standards Codification
-Section 45
-Paragraph 1
-Publisher FASB
-URI https://asc.fasb.org/1943274/2147481664/323-10-45-1
Reference 4: http://www.xbrl.org/2009/role/commonPracticeRef
-Topic 323
-SubTopic 10
-Name Accounting Standards Codification
-Section 50
-Paragraph 3
-Subparagraph (a)(3)
-Publisher FASB
-URI https://asc.fasb.org/1943274/2147481687/323-10-50-3
Reference 5: http://www.xbrl.org/2009/role/commonPracticeRef
-Topic 210
-SubTopic 10
-Name Accounting Standards Codification
-Section S99
-Paragraph 1
-Subparagraph (SX 210.5-02(10))
-Publisher FASB
-URI https://asc.fasb.org/1943274/2147480566/210-10-S99-1
Reference 6: http://www.xbrl.org/2003/role/disclosureRef
-Topic 280
-SubTopic 10
-Name Accounting Standards Codification
-Section 50
-Paragraph 25
-Subparagraph (a)
-Publisher FASB
-URI https://asc.fasb.org/1943274/2147482810/280-10-50-25
| Name: |
us-gaap_EquityMethodInvestments |
| Namespace Prefix: |
us-gaap_ |
| Data Type: |
xbrli:monetaryItemType |
| Balance Type: |
debit |
| Period Type: |
instant |
|
| X |
- References
+ Details
| Name: |
us-gaap_InvestmentsDebtAndEquitySecuritiesAbstract |
| Namespace Prefix: |
us-gaap_ |
| Data Type: |
xbrli:stringItemType |
| Balance Type: |
na |
| Period Type: |
duration |
|
| X |
- DefinitionAmount of investments classified as other. Reference 1: http://www.xbrl.org/2009/role/commonPracticeRef
-Topic 210
-SubTopic 10
-Name Accounting Standards Codification
-Section S99
-Paragraph 1
-Subparagraph (SX 210.5-02(12))
-Publisher FASB
-URI https://asc.fasb.org/1943274/2147480566/210-10-S99-1
Reference 2: http://www.xbrl.org/2003/role/disclosureRef
-Topic 944
-SubTopic 210
-Name Accounting Standards Codification
-Section S99
-Paragraph 1
-Subparagraph (SX 210.7-03(a)(3)(a))
-Publisher FASB
-URI https://asc.fasb.org/1943274/2147478777/944-210-S99-1
| Name: |
us-gaap_OtherInvestments |
| Namespace Prefix: |
us-gaap_ |
| Data Type: |
xbrli:monetaryItemType |
| Balance Type: |
debit |
| Period Type: |
instant |
|
v3.25.0.1
Equity Investments - Narrative (Details) - USD ($)
shares in Thousands |
12 Months Ended |
Dec. 31, 2024 |
Dec. 31, 2023 |
Dec. 31, 2022 |
| Schedule of Equity Method Investments [Line Items] |
|
|
|
| Carrying value |
$ 28,097,000
|
$ 8,896,000
|
|
| Long-term investments |
$ 868,025,000
|
$ 564,488,000
|
|
| Tractor |
|
|
|
| Schedule of Equity Method Investments [Line Items] |
|
|
|
| Investment shares owned (in shares) |
6,487
|
4,325
|
|
| Ownership percentage |
13.80%
|
|
|
| Cash consideration |
$ 14,872,000
|
|
|
| Equity method investment, impairment |
0
|
$ 0
|
$ 0
|
| Carrying value |
$ 18,097,000
|
8,896,000
|
|
| Hyphen Technologies, Inc. |
|
|
|
| Schedule of Equity Method Investments [Line Items] |
|
|
|
| Investment shares owned (in shares) |
5,819
|
|
|
| Recognized gain |
$ 6,782,000
|
|
|
| Long-term investments |
$ 31,782,000
|
|
|
| Nuro |
|
|
|
| Schedule of Equity Method Investments [Line Items] |
|
|
|
| Investment shares owned (in shares) |
766
|
|
|
| Recognized gain |
$ 5,968,000
|
|
|
| Long-term investments |
15,968,000
|
|
|
| Cultivate Next Fund |
|
|
|
| Schedule of Equity Method Investments [Line Items] |
|
|
|
| Long-term investments |
$ 21,252,000
|
$ 21,221,000
|
|
| X |
- DefinitionThis element represents the aggregate cost of investments accounted for under the equity method of accounting. Reference 1: http://fasb.org/us-gaap/role/ref/legacyRef
-Topic 210
-SubTopic 10
-Name Accounting Standards Codification
-Section S99
-Paragraph 1
-Subparagraph (SX 210.5-02(12))
-Publisher FASB
-URI https://asc.fasb.org/1943274/2147480566/210-10-S99-1
| Name: |
us-gaap_EquityMethodInvestmentAggregateCost |
| Namespace Prefix: |
us-gaap_ |
| Data Type: |
xbrli:monetaryItemType |
| Balance Type: |
debit |
| Period Type: |
instant |
|
| X |
- DefinitionAmount of other-than-temporary decline in value that has been recognized against investment accounted for under equity method of accounting. Reference 1: http://www.xbrl.org/2009/role/commonPracticeRef
-Topic 323
-SubTopic 10
-Name Accounting Standards Codification
-Section 45
-Paragraph 1
-Publisher FASB
-URI https://asc.fasb.org/1943274/2147481664/323-10-45-1
| Name: |
us-gaap_EquityMethodInvestmentOtherThanTemporaryImpairment |
| Namespace Prefix: |
us-gaap_ |
| Data Type: |
xbrli:monetaryItemType |
| Balance Type: |
debit |
| Period Type: |
duration |
|
| X |
- DefinitionThe percentage of ownership of common stock or equity participation in the investee accounted for under the equity method of accounting. Reference 1: http://www.xbrl.org/2003/role/disclosureRef
-Topic 323
-SubTopic 10
-Name Accounting Standards Codification
-Section 50
-Paragraph 3
-Subparagraph (a)(1)
-Publisher FASB
-URI https://asc.fasb.org/1943274/2147481687/323-10-50-3
| Name: |
us-gaap_EquityMethodInvestmentOwnershipPercentage |
| Namespace Prefix: |
us-gaap_ |
| Data Type: |
dtr-types:percentItemType |
| Balance Type: |
na |
| Period Type: |
instant |
|
| X |
- DefinitionThis item represents the carrying amount on the entity's balance sheet of its investment in common stock of an equity method investee. This is not an indicator of the fair value of the investment, rather it is the initial cost adjusted for the entity's share of earnings and losses of the investee, adjusted for any distributions (dividends) and other than temporary impairment (OTTI) losses recognized. Reference 1: http://www.xbrl.org/2003/role/disclosureRef
-Topic 270
-SubTopic 10
-Name Accounting Standards Codification
-Section 50
-Paragraph 1
-Subparagraph (i)
-Publisher FASB
-URI https://asc.fasb.org/1943274/2147482964/270-10-50-1
Reference 2: http://www.xbrl.org/2003/role/disclosureRef
-Topic 280
-SubTopic 10
-Name Accounting Standards Codification
-Section 50
-Paragraph 32
-Subparagraph (ee)
-Publisher FASB
-URI https://asc.fasb.org/1943274/2147482810/280-10-50-32
Reference 3: http://www.xbrl.org/2003/role/disclosureRef
-Topic 323
-SubTopic 10
-Name Accounting Standards Codification
-Section 45
-Paragraph 1
-Publisher FASB
-URI https://asc.fasb.org/1943274/2147481664/323-10-45-1
Reference 4: http://www.xbrl.org/2009/role/commonPracticeRef
-Topic 323
-SubTopic 10
-Name Accounting Standards Codification
-Section 50
-Paragraph 3
-Subparagraph (a)(3)
-Publisher FASB
-URI https://asc.fasb.org/1943274/2147481687/323-10-50-3
Reference 5: http://www.xbrl.org/2009/role/commonPracticeRef
-Topic 210
-SubTopic 10
-Name Accounting Standards Codification
-Section S99
-Paragraph 1
-Subparagraph (SX 210.5-02(10))
-Publisher FASB
-URI https://asc.fasb.org/1943274/2147480566/210-10-S99-1
Reference 6: http://www.xbrl.org/2003/role/disclosureRef
-Topic 280
-SubTopic 10
-Name Accounting Standards Codification
-Section 50
-Paragraph 25
-Subparagraph (a)
-Publisher FASB
-URI https://asc.fasb.org/1943274/2147482810/280-10-50-25
| Name: |
us-gaap_EquityMethodInvestments |
| Namespace Prefix: |
us-gaap_ |
| Data Type: |
xbrli:monetaryItemType |
| Balance Type: |
debit |
| Period Type: |
instant |
|
| X |
- DefinitionAmount of realized gain from sale of investment in equity security measured at fair value with change in fair value recognized in net income (FV-NI). Reference 1: http://www.xbrl.org/2009/role/commonPracticeRef
-Topic 321
-SubTopic 10
-Name Accounting Standards Codification
-Section 50
-Paragraph 4
-Publisher FASB
-URI https://asc.fasb.org/1943274/2147479536/321-10-50-4
| Name: |
us-gaap_EquitySecuritiesFvNiRealizedGain |
| Namespace Prefix: |
us-gaap_ |
| Data Type: |
xbrli:monetaryItemType |
| Balance Type: |
credit |
| Period Type: |
duration |
|
| X |
- DefinitionNumber of shares of investment owned. Reference 1: http://www.xbrl.org/2003/role/disclosureRef
-Topic 946
-SubTopic 210
-Name Accounting Standards Codification
-Section 50
-Paragraph 6
-Subparagraph (c)
-Publisher FASB
-URI https://asc.fasb.org/1943274/2147478795/946-210-50-6
Reference 2: http://www.xbrl.org/2003/role/exampleRef
-Topic 946
-SubTopic 210
-Name Accounting Standards Codification
-Section 55
-Paragraph 1
-Publisher FASB
-URI https://asc.fasb.org/1943274/2147477439/946-210-55-1
Reference 3: http://www.xbrl.org/2003/role/disclosureRef
-Topic 946
-SubTopic 210
-Name Accounting Standards Codification
-Section 50
-Paragraph 1
-Subparagraph (a)(1)
-Publisher FASB
-URI https://asc.fasb.org/1943274/2147478795/946-210-50-1
Reference 4: http://www.xbrl.org/2003/role/disclosureRef
-Topic 946
-SubTopic 320
-Name Accounting Standards Codification
-Section S99
-Paragraph 1
-Subparagraph (SX 210.12-12(Column B))
-Publisher FASB
-URI https://asc.fasb.org/1943274/2147477271/946-320-S99-1
Reference 5: http://www.xbrl.org/2003/role/disclosureRef
-Topic 946
-SubTopic 320
-Name Accounting Standards Codification
-Section S99
-Paragraph 3
-Subparagraph (SX 210.12-12B(Column B))
-Publisher FASB
-URI https://asc.fasb.org/1943274/2147477271/946-320-S99-3
Reference 6: http://www.xbrl.org/2003/role/disclosureRef
-Topic 946
-SubTopic 320
-Name Accounting Standards Codification
-Section S99
-Paragraph 6
-Subparagraph (SX 210.12-14(Column B))
-Publisher FASB
-URI https://asc.fasb.org/1943274/2147477271/946-320-S99-6
| Name: |
us-gaap_InvestmentOwnedBalanceShares |
| Namespace Prefix: |
us-gaap_ |
| Data Type: |
xbrli:sharesItemType |
| Balance Type: |
na |
| Period Type: |
instant |
|
| X |
- DefinitionThe total amount of investments that are intended to be held for an extended period of time (longer than one operating cycle). Reference 1: http://www.xbrl.org/2003/role/disclosureRef
-Topic 210
-SubTopic 10
-Name Accounting Standards Codification
-Section S99
-Paragraph 1
-Subparagraph (SX 210.5-02(12))
-Publisher FASB
-URI https://asc.fasb.org/1943274/2147480566/210-10-S99-1
| Name: |
us-gaap_LongTermInvestments |
| Namespace Prefix: |
us-gaap_ |
| Data Type: |
xbrli:monetaryItemType |
| Balance Type: |
debit |
| Period Type: |
instant |
|
| X |
- DefinitionLine items represent financial concepts included in a table. These concepts are used to disclose reportable information associated with domain members defined in one or many axes to the table. Reference 1: http://www.xbrl.org/2003/role/disclosureRef
-Topic 235
-SubTopic 10
-Name Accounting Standards Codification
-Section S99
-Paragraph 1
-Subparagraph (SX 210.4-08(g)(1)(ii))
-Publisher FASB
-URI https://asc.fasb.org/1943274/2147480678/235-10-S99-1
Reference 2: http://www.xbrl.org/2003/role/disclosureRef
-Topic 323
-SubTopic 10
-Name Accounting Standards Codification
-Section 50
-Paragraph 3
-Subparagraph (c)
-Publisher FASB
-URI https://asc.fasb.org/1943274/2147481687/323-10-50-3
Reference 3: http://www.xbrl.org/2003/role/disclosureRef
-Topic 825
-SubTopic 10
-Name Accounting Standards Codification
-Section 50
-Paragraph 28
-Subparagraph (f)
-Publisher FASB
-URI https://asc.fasb.org/1943274/2147482907/825-10-50-28
Reference 4: http://www.xbrl.org/2003/role/disclosureRef
-Topic 323
-SubTopic 10
-Name Accounting Standards Codification
-Section 50
-Paragraph 3
-Subparagraph (a)(1)
-Publisher FASB
-URI https://asc.fasb.org/1943274/2147481687/323-10-50-3
Reference 5: http://www.xbrl.org/2003/role/disclosureRef
-Topic 323
-SubTopic 10
-Name Accounting Standards Codification
-Section 50
-Paragraph 3
-Subparagraph (a)(2)
-Publisher FASB
-URI https://asc.fasb.org/1943274/2147481687/323-10-50-3
Reference 6: http://www.xbrl.org/2003/role/disclosureRef
-Topic 323
-SubTopic 10
-Name Accounting Standards Codification
-Section 50
-Paragraph 3
-Subparagraph (b)
-Publisher FASB
-URI https://asc.fasb.org/1943274/2147481687/323-10-50-3
| Name: |
us-gaap_ScheduleOfEquityMethodInvestmentsLineItems |
| Namespace Prefix: |
us-gaap_ |
| Data Type: |
xbrli:stringItemType |
| Balance Type: |
na |
| Period Type: |
duration |
|
| X |
- Details
| Name: |
srt_ScheduleOfEquityMethodInvestmentEquityMethodInvesteeNameAxis=cmg_TractorMember |
| Namespace Prefix: |
|
| Data Type: |
na |
| Balance Type: |
|
| Period Type: |
|
|
| X |
- Details
| Name: |
srt_ScheduleOfEquityMethodInvestmentEquityMethodInvesteeNameAxis=cmg_HyphenTechnologiesInc.Member |
| Namespace Prefix: |
|
| Data Type: |
na |
| Balance Type: |
|
| Period Type: |
|
|
| X |
- Details
| Name: |
srt_ScheduleOfEquityMethodInvestmentEquityMethodInvesteeNameAxis=cmg_NuroMember |
| Namespace Prefix: |
|
| Data Type: |
na |
| Balance Type: |
|
| Period Type: |
|
|
| X |
- Details
| Name: |
srt_ScheduleOfEquityMethodInvestmentEquityMethodInvesteeNameAxis=cmg_CultivateNextFundMember |
| Namespace Prefix: |
|
| Data Type: |
na |
| Balance Type: |
|
| Period Type: |
|
|
v3.25.0.1
Income Taxes - Summary of Income (Details) - USD ($)
$ in Thousands |
12 Months Ended |
Dec. 31, 2024 |
Dec. 31, 2023 |
Dec. 31, 2022 |
| Income Tax Disclosure [Abstract] |
|
|
|
| Domestic |
$ 2,031,759
|
$ 1,637,756
|
$ 1,192,004
|
| Foreign |
(21,529)
|
(17,250)
|
(10,473)
|
| Income before income taxes |
$ 2,010,230
|
$ 1,620,506
|
$ 1,181,531
|
| X |
- DefinitionAmount after tax of income (loss) from continuing operations including portion attributable to the noncontrolling interest. Reference 1: http://fasb.org/us-gaap/role/ref/legacyRef
-Topic 810
-SubTopic 10
-Name Accounting Standards Codification
-Section 45
-Paragraph 19
-Publisher FASB
-URI https://asc.fasb.org/1943274/2147481231/810-10-45-19
Reference 2: http://www.xbrl.org/2009/role/commonPracticeRef
-Topic 280
-SubTopic 10
-Name Accounting Standards Codification
-Section 50
-Paragraph 22
-Publisher FASB
-URI https://asc.fasb.org/1943274/2147482810/280-10-50-22
Reference 3: http://www.xbrl.org/2009/role/commonPracticeRef
-Topic 280
-SubTopic 10
-Name Accounting Standards Codification
-Section 50
-Paragraph 32
-Subparagraph (f)
-Publisher FASB
-URI https://asc.fasb.org/1943274/2147482810/280-10-50-32
Reference 4: http://www.xbrl.org/2009/role/commonPracticeRef
-Topic 280
-SubTopic 10
-Name Accounting Standards Codification
-Section 50
-Paragraph 30
-Subparagraph (b)
-Publisher FASB
-URI https://asc.fasb.org/1943274/2147482810/280-10-50-30
Reference 5: http://www.xbrl.org/2009/role/commonPracticeRef
-Topic 270
-SubTopic 10
-Name Accounting Standards Codification
-Section 50
-Paragraph 1
-Subparagraph (i)
-Publisher FASB
-URI https://asc.fasb.org/1943274/2147482964/270-10-50-1
Reference 6: http://www.xbrl.org/2009/role/commonPracticeRef
-Topic 280
-SubTopic 10
-Name Accounting Standards Codification
-Section 50
-Paragraph 32
-Subparagraph (ee)
-Publisher FASB
-URI https://asc.fasb.org/1943274/2147482810/280-10-50-32
Reference 7: http://fasb.org/us-gaap/role/ref/otherTransitionRef
-Topic 280
-SubTopic 10
-Name Accounting Standards Codification
-Section 50
-Paragraph 32
-Subparagraph (c)
-Publisher FASB
-URI https://asc.fasb.org/1943274/2147482810/280-10-50-32
Reference 8: http://www.xbrl.org/2003/role/disclosureRef
-Topic 250
-SubTopic 10
-Name Accounting Standards Codification
-Section 50
-Paragraph 6
-Publisher FASB
-URI https://asc.fasb.org/1943274/2147483443/250-10-50-6
Reference 9: http://www.xbrl.org/2003/role/disclosureRef
-Topic 805
-SubTopic 60
-Name Accounting Standards Codification
-Section 65
-Paragraph 1
-Subparagraph (g)
-Publisher FASB
-URI https://asc.fasb.org/1943274/2147476176/805-60-65-1
Reference 10: http://www.xbrl.org/2003/role/disclosureRef
-Topic 740
-SubTopic 323
-Name Accounting Standards Codification
-Section 65
-Paragraph 2
-Subparagraph (g)(3)
-Publisher FASB
-URI https://asc.fasb.org/1943274/2147478666/740-323-65-2
Reference 11: http://www.xbrl.org/2003/role/disclosureRef
-Topic 235
-SubTopic 10
-Name Accounting Standards Codification
-Section S99
-Paragraph 1
-Subparagraph (SX 210.4-08(g)(1)(ii))
-Publisher FASB
-URI https://asc.fasb.org/1943274/2147480678/235-10-S99-1
Reference 12: http://www.xbrl.org/2003/role/disclosureRef
-Topic 323
-SubTopic 10
-Name Accounting Standards Codification
-Section 50
-Paragraph 3
-Subparagraph (c)
-Publisher FASB
-URI https://asc.fasb.org/1943274/2147481687/323-10-50-3
Reference 13: http://www.xbrl.org/2003/role/disclosureRef
-Topic 825
-SubTopic 10
-Name Accounting Standards Codification
-Section 50
-Paragraph 28
-Subparagraph (f)
-Publisher FASB
-URI https://asc.fasb.org/1943274/2147482907/825-10-50-28
Reference 14: http://www.xbrl.org/2003/role/disclosureRef
-Topic 250
-SubTopic 10
-Name Accounting Standards Codification
-Section 50
-Paragraph 1
-Subparagraph (b)(2)
-Publisher FASB
-URI https://asc.fasb.org/1943274/2147483443/250-10-50-1
Reference 15: http://www.xbrl.org/2003/role/disclosureRef
-Topic 815
-SubTopic 40
-Name Accounting Standards Codification
-Section 65
-Paragraph 1
-Subparagraph (f)
-Publisher FASB
-URI https://asc.fasb.org/1943274/2147480175/815-40-65-1
Reference 16: http://www.xbrl.org/2003/role/disclosureRef
-Topic 944
-SubTopic 220
-Name Accounting Standards Codification
-Section S99
-Paragraph 1
-Subparagraph (SX 210.7-04(11))
-Publisher FASB
-URI https://asc.fasb.org/1943274/2147477250/944-220-S99-1
Reference 17: http://www.xbrl.org/2003/role/disclosureRef
-Topic 470
-SubTopic 10
-Name Accounting Standards Codification
-Section S99
-Paragraph 1A
-Subparagraph (SX 210.13-01(a)(4)(i))
-Publisher FASB
-URI https://asc.fasb.org/1943274/2147480097/470-10-S99-1A
Reference 18: http://www.xbrl.org/2009/role/commonPracticeRef
-Topic 470
-SubTopic 10
-Name Accounting Standards Codification
-Section S99
-Paragraph 1A
-Subparagraph (SX 210.13-01(a)(4)(ii))
-Publisher FASB
-URI https://asc.fasb.org/1943274/2147480097/470-10-S99-1A
Reference 19: http://www.xbrl.org/2003/role/disclosureRef
-Topic 470
-SubTopic 10
-Name Accounting Standards Codification
-Section S99
-Paragraph 1A
-Subparagraph (SX 210.13-01(a)(4)(iii)(A))
-Publisher FASB
-URI https://asc.fasb.org/1943274/2147480097/470-10-S99-1A
Reference 20: http://www.xbrl.org/2003/role/disclosureRef
-Topic 470
-SubTopic 10
-Name Accounting Standards Codification
-Section S99
-Paragraph 1A
-Subparagraph (SX 210.13-01(a)(4)(iv))
-Publisher FASB
-URI https://asc.fasb.org/1943274/2147480097/470-10-S99-1A
Reference 21: http://www.xbrl.org/2003/role/disclosureRef
-Topic 470
-SubTopic 10
-Name Accounting Standards Codification
-Section S99
-Paragraph 1A
-Subparagraph (SX 210.13-01(a)(5))
-Publisher FASB
-URI https://asc.fasb.org/1943274/2147480097/470-10-S99-1A
Reference 22: http://www.xbrl.org/2003/role/disclosureRef
-Topic 470
-SubTopic 10
-Name Accounting Standards Codification
-Section S99
-Paragraph 1B
-Subparagraph (SX 210.13-02(a)(4)(i))
-Publisher FASB
-URI https://asc.fasb.org/1943274/2147480097/470-10-S99-1B
Reference 23: http://www.xbrl.org/2003/role/disclosureRef
-Topic 470
-SubTopic 10
-Name Accounting Standards Codification
-Section S99
-Paragraph 1B
-Subparagraph (SX 210.13-02(a)(4)(iii)(A))
-Publisher FASB
-URI https://asc.fasb.org/1943274/2147480097/470-10-S99-1B
Reference 24: http://www.xbrl.org/2003/role/disclosureRef
-Topic 470
-SubTopic 10
-Name Accounting Standards Codification
-Section S99
-Paragraph 1B
-Subparagraph (SX 210.13-02(a)(4)(iii)(B))
-Publisher FASB
-URI https://asc.fasb.org/1943274/2147480097/470-10-S99-1B
Reference 25: http://www.xbrl.org/2003/role/disclosureRef
-Topic 470
-SubTopic 10
-Name Accounting Standards Codification
-Section S99
-Paragraph 1B
-Subparagraph (SX 210.13-02(a)(4)(iv))
-Publisher FASB
-URI https://asc.fasb.org/1943274/2147480097/470-10-S99-1B
Reference 26: http://www.xbrl.org/2003/role/disclosureRef
-Topic 470
-SubTopic 10
-Name Accounting Standards Codification
-Section S99
-Paragraph 1B
-Subparagraph (SX 210.13-02(a)(5))
-Publisher FASB
-URI https://asc.fasb.org/1943274/2147480097/470-10-S99-1B
Reference 27: http://www.xbrl.org/2003/role/exampleRef
-Topic 280
-SubTopic 10
-Name Accounting Standards Codification
-Section 50
-Paragraph 31
-Publisher FASB
-URI https://asc.fasb.org/1943274/2147482810/280-10-50-31
| Name: |
us-gaap_IncomeLossFromContinuingOperationsIncludingPortionAttributableToNoncontrollingInterest |
| Namespace Prefix: |
us-gaap_ |
| Data Type: |
xbrli:monetaryItemType |
| Balance Type: |
credit |
| Period Type: |
duration |
|
v3.25.0.1
Income Taxes - Schedule of Components of Provision for Income Taxes (Details) - USD ($)
$ in Thousands |
12 Months Ended |
Dec. 31, 2024 |
Dec. 31, 2023 |
Dec. 31, 2022 |
| Current tax: |
|
|
|
| U.S. Federal |
$ 412,943
|
$ 314,757
|
$ 246,210
|
| U.S. State and Local |
104,478
|
85,355
|
79,041
|
| Foreign |
1,636
|
1,162
|
374
|
| Current income tax expense (benefit) |
519,057
|
401,274
|
325,625
|
| Deferred tax: |
|
|
|
| U.S. Federal |
(32,751)
|
(7,992)
|
(23,502)
|
| U.S. State and Local |
(10,195)
|
(1,532)
|
(19,940)
|
| Foreign |
(4,385)
|
(7,606)
|
3,771
|
| Deferred income tax expense (benefit) |
(47,331)
|
(17,130)
|
(39,671)
|
| Valuation allowance |
4,394
|
7,625
|
(3,524)
|
| Provision for income taxes |
$ 476,120
|
$ 391,769
|
$ 282,430
|
| X |
- References
+ Details
| Name: |
us-gaap_CurrentFederalStateAndLocalTaxExpenseBenefitAbstract |
| Namespace Prefix: |
us-gaap_ |
| Data Type: |
xbrli:stringItemType |
| Balance Type: |
na |
| Period Type: |
duration |
|
| X |
- DefinitionAmount of current federal tax expense (benefit) attributable to income (loss) from continuing operations. Includes, but is not limited to, current national tax expense (benefit) for non-US (United States of America) jurisdiction. Reference 1: http://www.xbrl.org/2009/role/commonPracticeRef
-Topic 740
-SubTopic 10
-Name Accounting Standards Codification
-Section S99
-Paragraph 1
-Subparagraph (SAB Topic 6.I.7)
-Publisher FASB
-URI https://asc.fasb.org/1943274/2147479360/740-10-S99-1
Reference 2: http://www.xbrl.org/2009/role/commonPracticeRef
-Topic 235
-SubTopic 10
-Name Accounting Standards Codification
-Section S99
-Paragraph 1
-Subparagraph (SX 210.4-08(h)(1)(Note 1))
-Publisher FASB
-URI https://asc.fasb.org/1943274/2147480678/235-10-S99-1
Reference 3: http://www.xbrl.org/2009/role/commonPracticeRef
-Name Accounting Standards Codification
-Section 50
-Paragraph 9
-Subparagraph (a)
-SubTopic 10
-Topic 740
-Publisher FASB
-URI https://asc.fasb.org/1943274/2147482685/740-10-50-9
| Name: |
us-gaap_CurrentFederalTaxExpenseBenefit |
| Namespace Prefix: |
us-gaap_ |
| Data Type: |
xbrli:monetaryItemType |
| Balance Type: |
debit |
| Period Type: |
duration |
|
| X |
- DefinitionAmount of current foreign income tax expense (benefit) pertaining to income (loss) from continuing operations. Reference 1: http://www.xbrl.org/2009/role/commonPracticeRef
-Topic 235
-SubTopic 10
-Name Accounting Standards Codification
-Section S99
-Paragraph 1
-Subparagraph (SX 210.4-08(h)(1)(Note 1))
-Publisher FASB
-URI https://asc.fasb.org/1943274/2147480678/235-10-S99-1
Reference 2: http://www.xbrl.org/2009/role/commonPracticeRef
-Name Accounting Standards Codification
-Section 50
-Paragraph 9
-Subparagraph (a)
-SubTopic 10
-Topic 740
-Publisher FASB
-URI https://asc.fasb.org/1943274/2147482685/740-10-50-9
| Name: |
us-gaap_CurrentForeignTaxExpenseBenefit |
| Namespace Prefix: |
us-gaap_ |
| Data Type: |
xbrli:monetaryItemType |
| Balance Type: |
debit |
| Period Type: |
duration |
|
| X |
- DefinitionAmount of current state and local tax expense (benefit) attributable to income (loss) from continuing operations. Includes, but is not limited to, current regional, territorial, and provincial tax expense (benefit) for non-US (United States of America) jurisdiction. Reference 1: http://www.xbrl.org/2009/role/commonPracticeRef
-Topic 740
-SubTopic 10
-Name Accounting Standards Codification
-Section S99
-Paragraph 1
-Subparagraph (SAB Topic 6.I.7)
-Publisher FASB
-URI https://asc.fasb.org/1943274/2147479360/740-10-S99-1
Reference 2: http://www.xbrl.org/2009/role/commonPracticeRef
-Topic 235
-SubTopic 10
-Name Accounting Standards Codification
-Section S99
-Paragraph 1
-Subparagraph (SX 210.4-08(h)(1)(Note 1))
-Publisher FASB
-URI https://asc.fasb.org/1943274/2147480678/235-10-S99-1
Reference 3: http://www.xbrl.org/2009/role/commonPracticeRef
-Name Accounting Standards Codification
-Section 50
-Paragraph 9
-Subparagraph (a)
-SubTopic 10
-Topic 740
-Publisher FASB
-URI https://asc.fasb.org/1943274/2147482685/740-10-50-9
| Name: |
us-gaap_CurrentStateAndLocalTaxExpenseBenefit |
| Namespace Prefix: |
us-gaap_ |
| Data Type: |
xbrli:monetaryItemType |
| Balance Type: |
debit |
| Period Type: |
duration |
|
| X |
- References
+ Details
| Name: |
us-gaap_DeferredFederalStateAndLocalTaxExpenseBenefitAbstract |
| Namespace Prefix: |
us-gaap_ |
| Data Type: |
xbrli:stringItemType |
| Balance Type: |
na |
| Period Type: |
duration |
|
| X |
- DefinitionAmount of increase (decrease) in the valuation allowance for a specified deferred tax asset. Reference 1: http://www.xbrl.org/2003/role/disclosureRef
-Topic 740
-SubTopic 10
-Name Accounting Standards Codification
-Section 50
-Paragraph 2
-Publisher FASB
-URI https://asc.fasb.org/1943274/2147482685/740-10-50-2
| Name: |
us-gaap_ValuationAllowanceDeferredTaxAssetChangeInAmount |
| Namespace Prefix: |
us-gaap_ |
| Data Type: |
xbrli:monetaryItemType |
| Balance Type: |
credit |
| Period Type: |
duration |
|
v3.25.0.1
v3.25.0.1
Income Taxes - Schedule of Deferred Income Tax Liabilities and Assets (Details) - USD ($)
$ in Thousands |
Dec. 31, 2024 |
Dec. 31, 2023 |
| Deferred income tax liability: |
|
|
| Leasehold improvements, property and equipment, net |
$ 262,692
|
$ 272,017
|
| Goodwill and other assets |
1,753
|
1,743
|
| Operating lease assets |
1,088,934
|
972,835
|
| Total deferred income tax liability |
1,353,379
|
1,246,595
|
| Deferred income tax asset: |
|
|
| Gift card liability |
19,087
|
18,101
|
| Capitalized transaction costs |
323
|
323
|
| Stock-based compensation and other employee benefits |
61,574
|
50,954
|
| Foreign net operating loss carry-forwards |
35,215
|
32,252
|
| State credits |
872
|
1,838
|
| Operating lease liabilities |
1,159,788
|
1,038,911
|
| Allowances, reserves and other |
26,105
|
12,870
|
| Capitalized research costs |
29,122
|
25,990
|
| Prepaid assets and other |
10,334
|
6,637
|
| State net operating loss carry-forwards |
3,867
|
4,332
|
| Valuation allowance |
(39,116)
|
(34,722)
|
| Total deferred income tax asset |
1,307,171
|
1,157,486
|
| Deferred income tax liabilities |
$ 46,208
|
$ 89,109
|
| X |
- DefinitionDeferred Tax Assets, Lease Liability
| Name: |
cmg_DeferredTaxAssetsLeaseLiability |
| Namespace Prefix: |
cmg_ |
| Data Type: |
xbrli:monetaryItemType |
| Balance Type: |
debit |
| Period Type: |
instant |
|
| X |
- DefinitionAmount before allocation of valuation allowances of deferred tax assets attributable to taxable temporary differences from prepayments.
| Name: |
cmg_DeferredTaxAssetsPrepaidAssetsAndOther |
| Namespace Prefix: |
cmg_ |
| Data Type: |
xbrli:monetaryItemType |
| Balance Type: |
debit |
| Period Type: |
instant |
|
| X |
- DefinitionDeferred Tax Assets, Tax Deferred Expense, Capitalized Research and Development Costs
| Name: |
cmg_DeferredTaxAssetsTaxDeferredExpenseCapitalizedResearchAndDevelopmentCosts |
| Namespace Prefix: |
cmg_ |
| Data Type: |
xbrli:monetaryItemType |
| Balance Type: |
debit |
| Period Type: |
instant |
|
| X |
- DefinitionThe cumulative amount of the estimated future tax effects attributable to the difference between the tax basis of transaction costs and the basis of transaction costs computed in accordance with generally accepted accounting principles. The difference in basis, whether due to amortization or other reasons, will decrease future taxable income when such difference reverses.
| Name: |
cmg_DeferredTaxAssetsTaxDeferredExpenseReservesAndAccrualsCapitalizedTransactionCosts |
| Namespace Prefix: |
cmg_ |
| Data Type: |
xbrli:monetaryItemType |
| Balance Type: |
debit |
| Period Type: |
instant |
|
| X |
- DefinitionThe tax effect as of the balance sheet date of the amount of revenue arising from the sale of gift cards which has been recognized for tax purposes but is deferred for GAAP purposes. The asset will be realized when the same revenue is recognized for GAAP purposes.
| Name: |
cmg_DeferredTaxAssetsTaxDeferredExpenseReservesAndAccrualsGiftCardLiability |
| Namespace Prefix: |
cmg_ |
| Data Type: |
xbrli:monetaryItemType |
| Balance Type: |
debit |
| Period Type: |
instant |
|
| X |
- DefinitionDeferred Tax Liabilities, Right-Of-Use Asset
| Name: |
cmg_DeferredTaxLiabilitiesRightOfUseAsset |
| Namespace Prefix: |
cmg_ |
| Data Type: |
xbrli:monetaryItemType |
| Balance Type: |
credit |
| Period Type: |
instant |
|
| X |
- References
+ Details
| Name: |
us-gaap_DeferredTaxAssetsGrossAbstract |
| Namespace Prefix: |
us-gaap_ |
| Data Type: |
xbrli:stringItemType |
| Balance Type: |
na |
| Period Type: |
duration |
|
| X |
- DefinitionAmount after allocation of valuation allowances of deferred tax asset attributable to deductible temporary differences and carryforwards. Reference 1: http://www.xbrl.org/2009/role/commonPracticeRef
-Topic 740
-SubTopic 10
-Name Accounting Standards Codification
-Section 50
-Paragraph 2
-Publisher FASB
-URI https://asc.fasb.org/1943274/2147482685/740-10-50-2
| Name: |
us-gaap_DeferredTaxAssetsNet |
| Namespace Prefix: |
us-gaap_ |
| Data Type: |
xbrli:monetaryItemType |
| Balance Type: |
debit |
| Period Type: |
instant |
|
| X |
- DefinitionAmount before allocation of valuation allowances of deferred tax asset attributable to deductible foreign operating loss carryforwards. Reference 1: http://www.xbrl.org/2009/role/commonPracticeRef
-Topic 740
-SubTopic 10
-Name Accounting Standards Codification
-Section 50
-Paragraph 6
-Publisher FASB
-URI https://asc.fasb.org/1943274/2147482685/740-10-50-6
| Name: |
us-gaap_DeferredTaxAssetsOperatingLossCarryforwardsForeign |
| Namespace Prefix: |
us-gaap_ |
| Data Type: |
xbrli:monetaryItemType |
| Balance Type: |
debit |
| Period Type: |
instant |
|
| X |
- DefinitionAmount before allocation of valuation allowances of deferred tax asset attributable to deductible state and local operating loss carryforwards. Reference 1: http://www.xbrl.org/2009/role/commonPracticeRef
-Topic 740
-SubTopic 10
-Name Accounting Standards Codification
-Section 50
-Paragraph 6
-Publisher FASB
-URI https://asc.fasb.org/1943274/2147482685/740-10-50-6
| Name: |
us-gaap_DeferredTaxAssetsOperatingLossCarryforwardsStateAndLocal |
| Namespace Prefix: |
us-gaap_ |
| Data Type: |
xbrli:monetaryItemType |
| Balance Type: |
debit |
| Period Type: |
instant |
|
| X |
- DefinitionAmount before allocation of valuation allowances of deferred tax asset attributable to deductible temporary differences from state taxes. Reference 1: http://www.xbrl.org/2009/role/commonPracticeRef
-Topic 740
-SubTopic 10
-Name Accounting Standards Codification
-Section 50
-Paragraph 6
-Publisher FASB
-URI https://asc.fasb.org/1943274/2147482685/740-10-50-6
| Name: |
us-gaap_DeferredTaxAssetsStateTaxes |
| Namespace Prefix: |
us-gaap_ |
| Data Type: |
xbrli:monetaryItemType |
| Balance Type: |
debit |
| Period Type: |
instant |
|
| X |
- DefinitionAmount before allocation of valuation allowances of deferred tax asset attributable to deductible temporary differences from share-based compensation. Reference 1: http://www.xbrl.org/2009/role/commonPracticeRef
-Topic 740
-SubTopic 10
-Name Accounting Standards Codification
-Section 50
-Paragraph 6
-Publisher FASB
-URI https://asc.fasb.org/1943274/2147482685/740-10-50-6
| Name: |
us-gaap_DeferredTaxAssetsTaxDeferredExpenseCompensationAndBenefitsShareBasedCompensationCost |
| Namespace Prefix: |
us-gaap_ |
| Data Type: |
xbrli:monetaryItemType |
| Balance Type: |
debit |
| Period Type: |
instant |
|
| X |
- DefinitionAmount, before allocation of valuation allowance, of deferred tax asset attributable to deductible temporary differences from reserves and accruals, classified as other. Reference 1: http://www.xbrl.org/2009/role/commonPracticeRef
-Topic 740
-SubTopic 10
-Name Accounting Standards Codification
-Section 50
-Paragraph 6
-Publisher FASB
-URI https://asc.fasb.org/1943274/2147482685/740-10-50-6
| Name: |
us-gaap_DeferredTaxAssetsTaxDeferredExpenseReservesAndAccrualsOther |
| Namespace Prefix: |
us-gaap_ |
| Data Type: |
xbrli:monetaryItemType |
| Balance Type: |
debit |
| Period Type: |
instant |
|
| X |
- DefinitionAmount of deferred tax assets for which it is more likely than not that a tax benefit will not be realized. Reference 1: http://www.xbrl.org/2003/role/disclosureRef
-Topic 740
-SubTopic 10
-Name Accounting Standards Codification
-Section 50
-Paragraph 2
-Subparagraph (c)
-Publisher FASB
-URI https://asc.fasb.org/1943274/2147482685/740-10-50-2
| Name: |
us-gaap_DeferredTaxAssetsValuationAllowance |
| Namespace Prefix: |
us-gaap_ |
| Data Type: |
xbrli:monetaryItemType |
| Balance Type: |
credit |
| Period Type: |
instant |
|
| X |
- DefinitionAmount, after deferred tax asset, of deferred tax liability attributable to taxable differences without jurisdictional netting. Reference 1: http://www.xbrl.org/2009/role/commonPracticeRef
-Topic 740
-SubTopic 10
-Name Accounting Standards Codification
-Section 50
-Paragraph 2
-Publisher FASB
-URI https://asc.fasb.org/1943274/2147482685/740-10-50-2
| Name: |
us-gaap_DeferredTaxLiabilities |
| Namespace Prefix: |
us-gaap_ |
| Data Type: |
xbrli:monetaryItemType |
| Balance Type: |
credit |
| Period Type: |
instant |
|
| X |
- References
+ Details
| Name: |
us-gaap_DeferredTaxLiabilitiesAbstract |
| Namespace Prefix: |
us-gaap_ |
| Data Type: |
xbrli:stringItemType |
| Balance Type: |
na |
| Period Type: |
duration |
|
| X |
- DefinitionAmount of deferred tax liability attributable to taxable temporary differences from intangible assets including goodwill. Reference 1: http://www.xbrl.org/2009/role/commonPracticeRef
-Topic 740
-SubTopic 10
-Name Accounting Standards Codification
-Section 50
-Paragraph 6
-Publisher FASB
-URI https://asc.fasb.org/1943274/2147482685/740-10-50-6
| Name: |
us-gaap_DeferredTaxLiabilitiesGoodwillAndIntangibleAssets |
| Namespace Prefix: |
us-gaap_ |
| Data Type: |
xbrli:monetaryItemType |
| Balance Type: |
credit |
| Period Type: |
instant |
|
| X |
- DefinitionAmount of deferred tax liability attributable to taxable temporary differences from property, plant, and equipment. Reference 1: http://www.xbrl.org/2009/role/commonPracticeRef
-Topic 740
-SubTopic 10
-Name Accounting Standards Codification
-Section 50
-Paragraph 6
-Publisher FASB
-URI https://asc.fasb.org/1943274/2147482685/740-10-50-6
| Name: |
us-gaap_DeferredTaxLiabilitiesPropertyPlantAndEquipment |
| Namespace Prefix: |
us-gaap_ |
| Data Type: |
xbrli:monetaryItemType |
| Balance Type: |
credit |
| Period Type: |
instant |
|
v3.25.0.1
Income Taxes - Narrative (Details) - USD ($)
$ in Thousands |
12 Months Ended |
Dec. 31, 2024 |
Dec. 31, 2023 |
Dec. 31, 2022 |
| Operating Loss Carryforwards [Line Items] |
|
|
|
| Interest expense related to uncertain tax positions |
$ 1,441
|
$ 1,541
|
$ 384
|
| Interest on income taxes accrued |
2,959
|
2,026
|
|
| Significant change in unrecognized tax benefits is reasonably possible |
3,035
|
|
|
| Foreign Tax Jurisdiction |
|
|
|
| Operating Loss Carryforwards [Line Items] |
|
|
|
| Gross NOLS |
165,085
|
149,891
|
|
| Valuation allowances of deferred tax assets |
183,346
|
160,607
|
|
| State and Local Jurisdiction |
|
|
|
| Operating Loss Carryforwards [Line Items] |
|
|
|
| Gross NOLS |
$ 52,950
|
$ 62,492
|
|
| X |
- DefinitionAmount of operating loss carryforward, before tax effects, available to reduce future taxable income under enacted tax laws. Reference 1: http://www.xbrl.org/2003/role/disclosureRef
-Topic 740
-SubTopic 10
-Name Accounting Standards Codification
-Section 50
-Paragraph 3
-Subparagraph (a)
-Publisher FASB
-URI https://asc.fasb.org/1943274/2147482685/740-10-50-3
| Name: |
us-gaap_OperatingLossCarryforwards |
| Namespace Prefix: |
us-gaap_ |
| Data Type: |
xbrli:monetaryItemType |
| Balance Type: |
debit |
| Period Type: |
instant |
|
| X |
- DefinitionLine items represent financial concepts included in a table. These concepts are used to disclose reportable information associated with domain members defined in one or many axes to the table. Reference 1: http://www.xbrl.org/2003/role/disclosureRef
-Topic 740
-SubTopic 10
-Name Accounting Standards Codification
-Section 50
-Paragraph 3
-Subparagraph (a)
-Publisher FASB
-URI https://asc.fasb.org/1943274/2147482685/740-10-50-3
| Name: |
us-gaap_OperatingLossCarryforwardsLineItems |
| Namespace Prefix: |
us-gaap_ |
| Data Type: |
xbrli:stringItemType |
| Balance Type: |
na |
| Period Type: |
duration |
|
| X |
- DefinitionThe portion of the valuation allowance pertaining to the deferred tax asset representing potential future taxable deductions from net operating loss carryforwards for which it is more likely than not that a tax benefit will not be realized. Reference 1: http://www.xbrl.org/2009/role/commonPracticeRef
-Topic 740
-SubTopic 10
-Name Accounting Standards Codification
-Section 50
-Paragraph 2
-Subparagraph (c)
-Publisher FASB
-URI https://asc.fasb.org/1943274/2147482685/740-10-50-2
| Name: |
us-gaap_OperatingLossCarryforwardsValuationAllowance |
| Namespace Prefix: |
us-gaap_ |
| Data Type: |
xbrli:monetaryItemType |
| Balance Type: |
credit |
| Period Type: |
instant |
|
| X |
- DefinitionThe amount of the unrecognized tax benefit of a position taken for which it is reasonably possible that the total amount thereof will significantly increase or decrease within twelve months of the balance sheet date. Reference 1: http://fasb.org/us-gaap/role/ref/otherTransitionRef
-Topic 740
-SubTopic 10
-Name Accounting Standards Codification
-Section 50
-Paragraph 15
-Subparagraph (d)
-Publisher FASB
-URI https://asc.fasb.org/1943274/2147482685/740-10-50-15
| Name: |
us-gaap_SignificantChangeInUnrecognizedTaxBenefitsIsReasonablyPossibleAmountOfUnrecordedBenefit |
| Namespace Prefix: |
us-gaap_ |
| Data Type: |
xbrli:monetaryItemType |
| Balance Type: |
credit |
| Period Type: |
instant |
|
v3.25.0.1
Income Taxes - Schedule of Unrecognized Tax Benefits (Details) - USD ($)
$ in Thousands |
12 Months Ended |
Dec. 31, 2024 |
Dec. 31, 2023 |
Dec. 31, 2022 |
| Unrecognized Tax Benefits [Roll Forward] |
|
|
|
| Beginning of year |
$ 16,488
|
$ 8,902
|
$ 5,262
|
| Increase resulting from prior year tax positions |
3,737
|
7,561
|
3,937
|
| Decrease resulting from prior year tax positions |
(3,748)
|
(295)
|
0
|
| Increase resulting from current year tax positions |
916
|
783
|
312
|
| Settlements with taxing authorities |
0
|
(6)
|
0
|
| Lapsing of statutes of limitations |
(505)
|
(457)
|
(609)
|
| End of year |
$ 16,888
|
$ 16,488
|
$ 8,902
|
| X |
- DefinitionA roll forward is a reconciliation of a concept from the beginning of a period to the end of a period.
| Name: |
us-gaap_ReconciliationOfUnrecognizedTaxBenefitsExcludingAmountsPertainingToExaminedTaxReturnsRollForward |
| Namespace Prefix: |
us-gaap_ |
| Data Type: |
xbrli:stringItemType |
| Balance Type: |
na |
| Period Type: |
duration |
|
| X |
- DefinitionAmount of unrecognized tax benefits. Reference 1: http://www.xbrl.org/2003/role/exampleRef
-Topic 740
-SubTopic 10
-Name Accounting Standards Codification
-Section 55
-Paragraph 217
-Publisher FASB
-URI https://asc.fasb.org/1943274/2147482663/740-10-55-217
Reference 2: http://www.xbrl.org/2003/role/disclosureRef
-Topic 740
-SubTopic 10
-Name Accounting Standards Codification
-Section 50
-Paragraph 15A
-Subparagraph (a)
-Publisher FASB
-URI https://asc.fasb.org/1943274/2147482685/740-10-50-15A
Reference 3: http://www.xbrl.org/2003/role/disclosureRef
-Topic 740
-SubTopic 10
-Name Accounting Standards Codification
-Section 45
-Paragraph 10B
-Publisher FASB
-URI https://asc.fasb.org/1943274/2147482525/740-10-45-10B
| Name: |
us-gaap_UnrecognizedTaxBenefits |
| Namespace Prefix: |
us-gaap_ |
| Data Type: |
xbrli:monetaryItemType |
| Balance Type: |
credit |
| Period Type: |
instant |
|
| X |
- DefinitionAmount of decrease in unrecognized tax benefits resulting from tax positions taken in prior period tax returns. Reference 1: http://www.xbrl.org/2003/role/exampleRef
-Topic 740
-SubTopic 10
-Name Accounting Standards Codification
-Section 55
-Paragraph 217
-Publisher FASB
-URI https://asc.fasb.org/1943274/2147482663/740-10-55-217
Reference 2: http://www.xbrl.org/2003/role/disclosureRef
-Topic 740
-SubTopic 10
-Name Accounting Standards Codification
-Section 50
-Paragraph 15A
-Subparagraph (a)(1)
-Publisher FASB
-URI https://asc.fasb.org/1943274/2147482685/740-10-50-15A
| Name: |
us-gaap_UnrecognizedTaxBenefitsDecreasesResultingFromPriorPeriodTaxPositions |
| Namespace Prefix: |
us-gaap_ |
| Data Type: |
xbrli:monetaryItemType |
| Balance Type: |
debit |
| Period Type: |
duration |
|
| X |
- DefinitionAmount of decrease in unrecognized tax benefits resulting from settlements with taxing authorities. Reference 1: http://www.xbrl.org/2003/role/exampleRef
-Topic 740
-SubTopic 10
-Name Accounting Standards Codification
-Section 55
-Paragraph 217
-Publisher FASB
-URI https://asc.fasb.org/1943274/2147482663/740-10-55-217
Reference 2: http://www.xbrl.org/2003/role/disclosureRef
-Topic 740
-SubTopic 10
-Name Accounting Standards Codification
-Section 50
-Paragraph 15A
-Subparagraph (a)(3)
-Publisher FASB
-URI https://asc.fasb.org/1943274/2147482685/740-10-50-15A
| Name: |
us-gaap_UnrecognizedTaxBenefitsDecreasesResultingFromSettlementsWithTaxingAuthorities |
| Namespace Prefix: |
us-gaap_ |
| Data Type: |
xbrli:monetaryItemType |
| Balance Type: |
debit |
| Period Type: |
duration |
|
| X |
- DefinitionAmount of increase in unrecognized tax benefits resulting from tax positions that have been or will be taken in current period tax return. Reference 1: http://www.xbrl.org/2003/role/exampleRef
-Topic 740
-SubTopic 10
-Name Accounting Standards Codification
-Section 55
-Paragraph 217
-Publisher FASB
-URI https://asc.fasb.org/1943274/2147482663/740-10-55-217
Reference 2: http://www.xbrl.org/2003/role/disclosureRef
-Topic 740
-SubTopic 10
-Name Accounting Standards Codification
-Section 50
-Paragraph 15A
-Subparagraph (a)(2)
-Publisher FASB
-URI https://asc.fasb.org/1943274/2147482685/740-10-50-15A
| Name: |
us-gaap_UnrecognizedTaxBenefitsIncreasesResultingFromCurrentPeriodTaxPositions |
| Namespace Prefix: |
us-gaap_ |
| Data Type: |
xbrli:monetaryItemType |
| Balance Type: |
credit |
| Period Type: |
duration |
|
| X |
- DefinitionAmount of increase in unrecognized tax benefits resulting from tax positions taken in prior period tax returns. Reference 1: http://www.xbrl.org/2003/role/exampleRef
-Topic 740
-SubTopic 10
-Name Accounting Standards Codification
-Section 55
-Paragraph 217
-Publisher FASB
-URI https://asc.fasb.org/1943274/2147482663/740-10-55-217
Reference 2: http://www.xbrl.org/2003/role/disclosureRef
-Topic 740
-SubTopic 10
-Name Accounting Standards Codification
-Section 50
-Paragraph 15A
-Subparagraph (a)(1)
-Publisher FASB
-URI https://asc.fasb.org/1943274/2147482685/740-10-50-15A
| Name: |
us-gaap_UnrecognizedTaxBenefitsIncreasesResultingFromPriorPeriodTaxPositions |
| Namespace Prefix: |
us-gaap_ |
| Data Type: |
xbrli:monetaryItemType |
| Balance Type: |
credit |
| Period Type: |
duration |
|
| X |
- DefinitionAmount of decrease in unrecognized tax benefits resulting from lapses of applicable statutes of limitations. Reference 1: http://www.xbrl.org/2003/role/disclosureRef
-Topic 740
-SubTopic 10
-Name Accounting Standards Codification
-Section 50
-Paragraph 15A
-Subparagraph (a)(4)
-Publisher FASB
-URI https://asc.fasb.org/1943274/2147482685/740-10-50-15A
| Name: |
us-gaap_UnrecognizedTaxBenefitsReductionsResultingFromLapseOfApplicableStatuteOfLimitations |
| Namespace Prefix: |
us-gaap_ |
| Data Type: |
xbrli:monetaryItemType |
| Balance Type: |
debit |
| Period Type: |
duration |
|
v3.25.0.1
Shareholders' Equity (Details) - USD ($)
shares in Thousands, $ in Thousands |
3 Months Ended |
12 Months Ended |
|
Jun. 30, 2024 |
Dec. 31, 2024 |
Dec. 31, 2023 |
Dec. 31, 2022 |
Dec. 17, 2024 |
| Equity, Class of Treasury Stock [Line Items] |
|
|
|
|
|
| Value of common shares authorized for repurchasing |
|
$ 1,028,342
|
|
|
|
| Share repurchase program, number of additional shares authorized, amount |
|
|
|
|
$ 300,000
|
| Retirement of treasury stock |
|
0
|
|
|
|
| Repurchase of common stock |
|
1,077,424
|
$ 662,642
|
$ 925,912
|
|
| Repurchases in Accordance with Stock Award Agreements [Member] |
|
|
|
|
|
| Equity, Class of Treasury Stock [Line Items] |
|
|
|
|
|
| Repurchase of common stock |
|
$ 74,229
|
69,146
|
98,970
|
|
| Common Stock |
|
|
|
|
|
| Equity, Class of Treasury Stock [Line Items] |
|
|
|
|
|
| Retirement of treasury stock (in shares) |
507,166
|
507,166
|
|
|
|
| Retirement of treasury stock |
$ 5,072
|
$ 5,072
|
|
|
|
| Repurchase of common stock |
|
$ 145
|
|
|
|
| Treasury Stock |
|
|
|
|
|
| Equity, Class of Treasury Stock [Line Items] |
|
|
|
|
|
| Retirement of treasury stock (in shares) |
|
507,166
|
|
|
|
| Retirement of treasury stock |
(5,194,196)
|
$ (5,194,196)
|
|
|
|
| Repurchase of common stock |
|
249,540
|
$ 662,642
|
$ 925,912
|
|
| Retained Earnings |
|
|
|
|
|
| Equity, Class of Treasury Stock [Line Items] |
|
|
|
|
|
| Retirement of treasury stock |
$ 5,189,124
|
5,189,124
|
|
|
|
| Repurchase of common stock |
|
$ 827,739
|
|
|
|
| X |
- DefinitionShare Repurchase Program, Number Of Additional Shares Authorized, Amount
| Name: |
cmg_ShareRepurchaseProgramNumberOfAdditionalSharesAuthorizedAmount |
| Namespace Prefix: |
cmg_ |
| Data Type: |
xbrli:monetaryItemType |
| Balance Type: |
credit |
| Period Type: |
instant |
|
| X |
- DefinitionLine items represent financial concepts included in a table. These concepts are used to disclose reportable information associated with domain members defined in one or many axes to the table.
| Name: |
us-gaap_EquityClassOfTreasuryStockLineItems |
| Namespace Prefix: |
us-gaap_ |
| Data Type: |
xbrli:stringItemType |
| Balance Type: |
na |
| Period Type: |
duration |
|
| X |
- DefinitionAmount remaining authorized for purchase of share under share repurchase plan. Includes, but is not limited to, repurchase of stock and unit of ownership.
| Name: |
us-gaap_StockRepurchaseProgramRemainingAuthorizedRepurchaseAmount1 |
| Namespace Prefix: |
us-gaap_ |
| Data Type: |
xbrli:monetaryItemType |
| Balance Type: |
credit |
| Period Type: |
instant |
|
| X |
- DefinitionAmount of decrease of par value, additional paid in capital (APIC) and retained earnings of common and preferred stock retired from treasury when treasury stock is accounted for under the cost method. Reference 1: http://fasb.org/us-gaap/role/ref/legacyRef
-Name Accounting Standards Codification
-Section 50
-Paragraph 2
-SubTopic 10
-Topic 505
-Publisher FASB
-URI https://asc.fasb.org/1943274/2147481112/505-10-50-2
Reference 2: http://fasb.org/us-gaap/role/ref/legacyRef
-Topic 210
-SubTopic 10
-Name Accounting Standards Codification
-Section S99
-Paragraph 1
-Subparagraph (SX 210.5-02(29))
-Publisher FASB
-URI https://asc.fasb.org/1943274/2147480566/210-10-S99-1
Reference 3: http://fasb.org/us-gaap/role/ref/legacyRef
-Name Accounting Standards Codification
-Topic 505
-SubTopic 10
-Section S99
-Paragraph 1
-Publisher FASB
-URI https://asc.fasb.org/1943274/2147480008/505-10-S99-1
| Name: |
us-gaap_TreasuryStockRetiredCostMethodAmount |
| Namespace Prefix: |
us-gaap_ |
| Data Type: |
xbrli:monetaryItemType |
| Balance Type: |
debit |
| Period Type: |
duration |
|
| X |
- DefinitionNumber of shares of common and preferred stock retired from treasury during the period. Reference 1: http://fasb.org/us-gaap/role/ref/legacyRef
-Name Accounting Standards Codification
-Section 50
-Paragraph 2
-SubTopic 10
-Topic 505
-Publisher FASB
-URI https://asc.fasb.org/1943274/2147481112/505-10-50-2
Reference 2: http://fasb.org/us-gaap/role/ref/legacyRef
-Topic 210
-SubTopic 10
-Name Accounting Standards Codification
-Section S99
-Paragraph 1
-Subparagraph (SX 210.5-02(29))
-Publisher FASB
-URI https://asc.fasb.org/1943274/2147480566/210-10-S99-1
Reference 3: http://fasb.org/us-gaap/role/ref/legacyRef
-Topic 505
-SubTopic 10
-Name Accounting Standards Codification
-Section S99
-Paragraph 1
-Subparagraph (SX 210.3-04)
-Publisher FASB
-URI https://asc.fasb.org/1943274/2147480008/505-10-S99-1
| Name: |
us-gaap_TreasuryStockSharesRetired |
| Namespace Prefix: |
us-gaap_ |
| Data Type: |
xbrli:sharesItemType |
| Balance Type: |
na |
| Period Type: |
duration |
|
| X |
- DefinitionEquity impact of the cost of common and preferred stock that were repurchased during the period. Recorded using the cost method. Reference 1: http://fasb.org/us-gaap/role/ref/legacyRef
-Name Accounting Standards Codification
-Section 50
-Paragraph 2
-SubTopic 10
-Topic 505
-Publisher FASB
-URI https://asc.fasb.org/1943274/2147481112/505-10-50-2
Reference 2: http://fasb.org/us-gaap/role/ref/legacyRef
-Topic 505
-SubTopic 10
-Name Accounting Standards Codification
-Section S99
-Paragraph 1
-Subparagraph (SX 210.3-04)
-Publisher FASB
-URI https://asc.fasb.org/1943274/2147480008/505-10-S99-1
Reference 3: http://fasb.org/us-gaap/role/ref/legacyRef
-Name Accounting Standards Codification
-Topic 505
-SubTopic 30
-Section 45
-Paragraph 1
-Publisher FASB
-URI https://asc.fasb.org/1943274/2147481549/505-30-45-1
| Name: |
us-gaap_TreasuryStockValueAcquiredCostMethod |
| Namespace Prefix: |
us-gaap_ |
| Data Type: |
xbrli:monetaryItemType |
| Balance Type: |
debit |
| Period Type: |
duration |
|
| X |
- Details
| Name: |
srt_ShareRepurchaseProgramAxis=cmg_NotPartOfShareRepurchasePlanMember |
| Namespace Prefix: |
|
| Data Type: |
na |
| Balance Type: |
|
| Period Type: |
|
|
| X |
- Details
| Name: |
us-gaap_StatementEquityComponentsAxis=us-gaap_CommonStockMember |
| Namespace Prefix: |
|
| Data Type: |
na |
| Balance Type: |
|
| Period Type: |
|
|
| X |
- Details
| Name: |
us-gaap_StatementEquityComponentsAxis=us-gaap_TreasuryStockCommonMember |
| Namespace Prefix: |
|
| Data Type: |
na |
| Balance Type: |
|
| Period Type: |
|
|
| X |
- Details
| Name: |
us-gaap_StatementEquityComponentsAxis=us-gaap_RetainedEarningsMember |
| Namespace Prefix: |
|
| Data Type: |
na |
| Balance Type: |
|
| Period Type: |
|
|
v3.25.0.1
Stock-Based Compensation and Employee Benefit Plans - Narrative (Details) - USD ($)
$ / shares in Units, $ in Thousands |
|
12 Months Ended |
Aug. 31, 2024 |
Dec. 31, 2024 |
Dec. 31, 2023 |
Dec. 31, 2022 |
| Compensation Related Costs [Line Items] |
|
|
|
|
| Employee benefit and share-based payment arrangement, noncash |
$ 27,863
|
|
|
|
| Vesting period |
|
3 years
|
3 years
|
|
| Stock-based compensation |
|
$ 134,635
|
$ 126,686
|
$ 99,821
|
| Shares issued under ESPP |
|
78,000
|
79,000
|
32,000
|
| Total liabilities under deferred plan |
|
$ 36,509
|
|
|
| 401(k) Defined Contribution Plan |
|
|
|
|
| Compensation Related Costs [Line Items] |
|
|
|
|
| Period of service before an employee is eligible for contribution |
|
1 year
|
|
|
| Employer matching contribution, percentage on first 3% |
|
100.00%
|
|
|
| Percentage of employees' gross pay for which the employer contributes a matching contribution of 100% |
|
3.00%
|
|
|
| Employer matching contribution, percentage on next 2% |
|
50.00%
|
|
|
| Percentage of employees' gross pay for which the employer contributes a matching contribution of 50% |
|
2.00%
|
|
|
| Company matching contributions |
|
$ 16,523
|
$ 13,821
|
$ 12,923
|
| Deferred Compensation Plan |
|
|
|
|
| Compensation Related Costs [Line Items] |
|
|
|
|
| Total liabilities under deferred plan |
|
$ 36,509
|
$ 27,178
|
|
| Employer matching contribution, percentage on first 3% |
|
100.00%
|
|
|
| Percentage of employees' gross pay for which the employer contributes a matching contribution of 100% under the deferred plan |
|
3.00%
|
|
|
| Employer matching contribution, percentage on next 2% |
|
50.00%
|
|
|
| Percentage of employees' gross pay for which the employer contributes a matching contribution of 50% under the deferred plan |
|
2.00%
|
|
|
| Employee Stock Purchase Plan (ESPP) |
|
|
|
|
| Compensation Related Costs [Line Items] |
|
|
|
|
| Period of service before an employee is eligible for contribution |
|
1 year
|
|
|
| ESPP employee contribution, percentage |
|
15.00%
|
|
|
| Purchase price percentage of lower of fair market value on first and last trading days of each offering period |
|
92.50%
|
|
|
| Common stock authorized and reserved for ESPP (in shares) |
|
12,500,000
|
|
|
| Common stock authorized for issuance but not yet issued for ESPP (in shares) |
|
12,311,000
|
|
|
| 2022 Stock Incentive Plan |
|
|
|
|
| Compensation Related Costs [Line Items] |
|
|
|
|
| Common stock authorized and reserved for issuances (in shares) |
|
121,571,000
|
|
|
| Common stock remaining available for future issuance (in shares) |
|
105,569,000
|
|
|
| RSUs |
|
|
|
|
| Compensation Related Costs [Line Items] |
|
|
|
|
| Unearned compensation |
|
$ 88,093
|
|
|
| Weighted average period |
|
1 year 3 months 18 days
|
|
|
| Grant date fair value |
|
$ 53.67
|
$ 33.32
|
$ 31.19
|
| Shares vested, fair value |
|
$ 49,672
|
$ 39,464
|
$ 33,959
|
| Vested (in shares) |
|
948,000
|
|
|
| RSUs | Executive Officer |
|
|
|
|
| Compensation Related Costs [Line Items] |
|
|
|
|
| Stock-based compensation |
|
$ 17,080
|
|
|
| RSUs | Tranche One |
|
|
|
|
| Compensation Related Costs [Line Items] |
|
|
|
|
| Vesting period |
|
2 years
|
|
|
| RSUs | Tranche One | Executive Officer |
|
|
|
|
| Compensation Related Costs [Line Items] |
|
|
|
|
| Vesting period |
1 year
|
|
|
|
| RSUs | Tranche Two |
|
|
|
|
| Compensation Related Costs [Line Items] |
|
|
|
|
| Vesting period |
|
3 years
|
|
|
| RSUs | Tranche Two | Executive Officer |
|
|
|
|
| Compensation Related Costs [Line Items] |
|
|
|
|
| Vesting period |
2 years
|
|
|
|
| RSUs | Share-Based Payment Arrangement, Tranche Three | Executive Officer |
|
|
|
|
| Compensation Related Costs [Line Items] |
|
|
|
|
| Vesting period |
3 years
|
|
|
|
| SOSARs |
|
|
|
|
| Compensation Related Costs [Line Items] |
|
|
|
|
| Total intrinsic value of SOSARs exercised |
|
$ 177,274
|
$ 142,830
|
$ 77,124
|
| Unearned compensation |
|
$ 22,865
|
|
|
| Weighted average period |
|
1 year 6 months
|
|
|
| Expiration period |
|
7 years
|
|
|
| Performance Shares |
|
|
|
|
| Compensation Related Costs [Line Items] |
|
|
|
|
| Vesting period |
|
3 years
|
3 years
|
3 years
|
| Unearned compensation |
|
$ 50,157
|
|
|
| Weighted average period |
|
2 years 2 months 12 days
|
|
|
| Grant date fair value |
|
$ 52.90
|
$ 32.14
|
$ 31.39
|
| Shares vested, fair value |
|
$ 113,181
|
$ 110,794
|
$ 177,293
|
| Performance and market measurement period |
|
3 years
|
3 years
|
3 years
|
| Vested (in shares) |
|
777,000
|
|
|
| Performance Shares | Defined Minimum Targets Not Met |
|
|
|
|
| Compensation Related Costs [Line Items] |
|
|
|
|
| Vested (in shares) |
|
|
|
0
|
| Minimum | Performance Shares | Vesting Period 1 |
|
|
|
|
| Compensation Related Costs [Line Items] |
|
|
|
|
| Percentage of target number of shares to be earned if certain criteria is met |
|
0.00%
|
0.00%
|
0.00%
|
| Maximum | Performance Shares | Vesting Period 1 |
|
|
|
|
| Compensation Related Costs [Line Items] |
|
|
|
|
| Percentage of target number of shares to be earned if certain criteria is met |
|
300.00%
|
300.00%
|
300.00%
|
| Maximum | Performance Shares | Defined Minimum Targets Not Met |
|
|
|
|
| Compensation Related Costs [Line Items] |
|
|
|
|
| Percentage of target number of shares to be earned if certain criteria is met |
|
100.00%
|
100.00%
|
100.00%
|
| X |
- DefinitionCommon stock reserved for issuance under the Company's ESPP.
| Name: |
cmg_CommonStockAuthorizedAndReservedForIssuanceESPP |
| Namespace Prefix: |
cmg_ |
| Data Type: |
xbrli:sharesItemType |
| Balance Type: |
na |
| Period Type: |
instant |
|
| X |
- DefinitionCommon Stock Authorized For Issuance But Not Yet Issued For ESPP
| Name: |
cmg_CommonStockAuthorizedForIssuanceButNotYetIssuedForESPP |
| Namespace Prefix: |
cmg_ |
| Data Type: |
xbrli:sharesItemType |
| Balance Type: |
na |
| Period Type: |
instant |
|
| X |
- DefinitionConditional Target Number Of Shares Earned, Percentage
| Name: |
cmg_ConditionalTargetNumberOfSharesEarnedPercentage |
| Namespace Prefix: |
cmg_ |
| Data Type: |
dtr-types:percentItemType |
| Balance Type: |
na |
| Period Type: |
duration |
|
| X |
- DefinitionDeferred Compensation Arrangement With Individual Employer Contribution Percentage On First 3 Percent
| Name: |
cmg_DeferredCompensationArrangementWithIndividualEmployerContributionPercentageOnFirst3Percent |
| Namespace Prefix: |
cmg_ |
| Data Type: |
dtr-types:percentItemType |
| Balance Type: |
na |
| Period Type: |
duration |
|
| X |
- DefinitionDeferred Compensation Arrangement With Individual Employer Contribution Percentage On Next 2 Percent
| Name: |
cmg_DeferredCompensationArrangementWithIndividualEmployerContributionPercentageOnNext2Percent |
| Namespace Prefix: |
cmg_ |
| Data Type: |
dtr-types:percentItemType |
| Balance Type: |
na |
| Period Type: |
duration |
|
| X |
- DefinitionDeferred Compensation Arrangement With Individual, Employer Matching Contribution Of 100 Percent
| Name: |
cmg_DeferredCompensationArrangementWithIndividualEmployerMatchingContributionOf100Percent |
| Namespace Prefix: |
cmg_ |
| Data Type: |
dtr-types:percentItemType |
| Balance Type: |
na |
| Period Type: |
duration |
|
| X |
- DefinitionDeferred Compensation Arrangement With Individual, Employer Matching Contribution Of 50 Percent
| Name: |
cmg_DeferredCompensationArrangementWithIndividualEmployerMatchingContributionOf50Percent |
| Namespace Prefix: |
cmg_ |
| Data Type: |
dtr-types:percentItemType |
| Balance Type: |
na |
| Period Type: |
duration |
|
| X |
- DefinitionDefined Contribution Plan, Employer Matching Contribution, Percent of Employees' Gross Pay, at Which Employer Matches 100 Percent
| Name: |
cmg_DefinedContributionPlanEmployerMatchingContributionPercentOfEmployeesGrossPayAtWhichEmployerMatches100Percent |
| Namespace Prefix: |
cmg_ |
| Data Type: |
dtr-types:percentItemType |
| Balance Type: |
na |
| Period Type: |
duration |
|
| X |
- DefinitionDefined Contribution Plan, Employer Matching Contribution, Percent of Employees' Gross Pay, at Which Employer Matches 50 Percent
| Name: |
cmg_DefinedContributionPlanEmployerMatchingContributionPercentOfEmployeesGrossPayAtWhichEmployerMatches50Percent |
| Namespace Prefix: |
cmg_ |
| Data Type: |
dtr-types:percentItemType |
| Balance Type: |
na |
| Period Type: |
duration |
|
| X |
- DefinitionDefined Contribution Plan, Employer Matching Contribution, Percent of Match On First 3%
| Name: |
cmg_DefinedContributionPlanEmployerMatchingContributionPercentOfMatchOnFirst3 |
| Namespace Prefix: |
cmg_ |
| Data Type: |
dtr-types:percentItemType |
| Balance Type: |
na |
| Period Type: |
duration |
|
| X |
- DefinitionDefined Contribution Plan, Employer Matching Contribution, Percent of Match On Next 2 Percent
| Name: |
cmg_DefinedContributionPlanEmployerMatchingContributionPercentOfMatchOnNext2Percent |
| Namespace Prefix: |
cmg_ |
| Data Type: |
dtr-types:percentItemType |
| Balance Type: |
na |
| Period Type: |
duration |
|
| X |
- DefinitionThe maximum percent an employee may contribute after one year of service with the Company.
| Name: |
cmg_ESPPPercentOfBaseEarnings |
| Namespace Prefix: |
cmg_ |
| Data Type: |
dtr-types:percentItemType |
| Balance Type: |
na |
| Period Type: |
instant |
|
| X |
- DefinitionEligibility period to contribute to the ESPP.
| Name: |
cmg_EsppRequisiteServicePeriod |
| Namespace Prefix: |
cmg_ |
| Data Type: |
xbrli:durationItemType |
| Balance Type: |
na |
| Period Type: |
duration |
|
| X |
- DefinitionEligibility period to receive matching contributions
| Name: |
cmg_MatchingContributions401k |
| Namespace Prefix: |
cmg_ |
| Data Type: |
xbrli:durationItemType |
| Balance Type: |
na |
| Period Type: |
duration |
|
| X |
- DefinitionPurchase Price Percentage Of Lower Of Fair Market Value Of Stock On First And Last Trading Days Of Each Offering Period
| Name: |
cmg_PurchasePricePercentageOfLowerOfFairMarketValueOfStockOnFirstAndLastTradingDaysOfEachOfferingPeriod |
| Namespace Prefix: |
cmg_ |
| Data Type: |
dtr-types:percentItemType |
| Balance Type: |
na |
| Period Type: |
duration |
|
| X |
- DefinitionAggregate carrying value as of the balance sheet date of the liabilities for all deferred compensation arrangements. Represents currently earned compensation under compensation arrangements that is not actually paid until a later date.
| Name: |
us-gaap_DeferredCompensationLiabilityCurrentAndNoncurrent |
| Namespace Prefix: |
us-gaap_ |
| Data Type: |
xbrli:monetaryItemType |
| Balance Type: |
credit |
| Period Type: |
instant |
|
| X |
- DefinitionAmount of cost for defined contribution plan. Reference 1: http://www.xbrl.org/2003/role/disclosureRef
-Topic 715
-SubTopic 70
-Name Accounting Standards Codification
-Section 50
-Paragraph 1
-Publisher FASB
-URI https://asc.fasb.org/1943274/2147480794/715-70-50-1
| Name: |
us-gaap_DefinedContributionPlanCostRecognized |
| Namespace Prefix: |
us-gaap_ |
| Data Type: |
xbrli:monetaryItemType |
| Balance Type: |
debit |
| Period Type: |
duration |
|
| X |
- DefinitionAmount of noncash expense (reversal of expense) for employee benefits and share-based payment arrangement. Includes, but is not limited to, pension, other postretirement, postemployment and termination benefits. Reference 1: http://fasb.org/us-gaap/role/ref/legacyRef
-Name Accounting Standards Codification
-Section 45
-Paragraph 28
-Subparagraph (b)
-SubTopic 10
-Topic 230
-Publisher FASB
-URI https://asc.fasb.org/1943274/2147482740/230-10-45-28
| Name: |
us-gaap_EmployeeBenefitsAndShareBasedCompensationNoncash |
| Namespace Prefix: |
us-gaap_ |
| Data Type: |
xbrli:monetaryItemType |
| Balance Type: |
debit |
| Period Type: |
duration |
|
| X |
- DefinitionAmount of cost not yet recognized for nonvested award under share-based payment arrangement. Reference 1: http://www.xbrl.org/2003/role/disclosureRef
-Topic 718
-SubTopic 10
-Name Accounting Standards Codification
-Section 50
-Paragraph 2
-Subparagraph (i)
-Publisher FASB
-URI https://asc.fasb.org/1943274/2147480429/718-10-50-2
| Name: |
us-gaap_EmployeeServiceShareBasedCompensationNonvestedAwardsTotalCompensationCostNotYetRecognized |
| Namespace Prefix: |
us-gaap_ |
| Data Type: |
xbrli:monetaryItemType |
| Balance Type: |
debit |
| Period Type: |
instant |
|
| X |
- DefinitionWeighted-average period over which cost not yet recognized is expected to be recognized for award under share-based payment arrangement, in 'PnYnMnDTnHnMnS' format, for example, 'P1Y5M13D' represents reported fact of one year, five months, and thirteen days. Reference 1: http://www.xbrl.org/2003/role/disclosureRef
-Topic 718
-SubTopic 10
-Name Accounting Standards Codification
-Section 50
-Paragraph 2
-Subparagraph (i)
-Publisher FASB
-URI https://asc.fasb.org/1943274/2147480429/718-10-50-2
| Name: |
us-gaap_EmployeeServiceShareBasedCompensationNonvestedAwardsTotalCompensationCostNotYetRecognizedPeriodForRecognition1 |
| Namespace Prefix: |
us-gaap_ |
| Data Type: |
xbrli:durationItemType |
| Balance Type: |
na |
| Period Type: |
duration |
|
| X |
- DefinitionPeriod over which grantee's right to exercise award under share-based payment arrangement is no longer contingent on satisfaction of service or performance condition, in 'PnYnMnDTnHnMnS' format, for example, 'P1Y5M13D' represents reported fact of one year, five months, and thirteen days. Includes, but is not limited to, combination of market, performance or service condition. Reference 1: http://www.xbrl.org/2003/role/exampleRef
-Topic 718
-SubTopic 10
-Name Accounting Standards Codification
-Section 50
-Paragraph 2
-Subparagraph (a)(1)
-Publisher FASB
-URI https://asc.fasb.org/1943274/2147480429/718-10-50-2
| Name: |
us-gaap_ShareBasedCompensationArrangementByShareBasedPaymentAwardAwardVestingPeriod1 |
| Namespace Prefix: |
us-gaap_ |
| Data Type: |
xbrli:durationItemType |
| Balance Type: |
na |
| Period Type: |
duration |
|
| X |
- DefinitionThe weighted average fair value at grant date for nonvested equity-based awards issued during the period on other than stock (or unit) option plans (for example, phantom stock or unit plan, stock or unit appreciation rights plan, performance target plan). Reference 1: http://www.xbrl.org/2003/role/disclosureRef
-Topic 718
-SubTopic 10
-Name Accounting Standards Codification
-Section 50
-Paragraph 2
-Subparagraph (c)(2)(iii)(01)
-Publisher FASB
-URI https://asc.fasb.org/1943274/2147480429/718-10-50-2
| Name: |
us-gaap_ShareBasedCompensationArrangementByShareBasedPaymentAwardEquityInstrumentsOtherThanOptionsGrantsInPeriodWeightedAverageGrantDateFairValue |
| Namespace Prefix: |
us-gaap_ |
| Data Type: |
dtr-types:perShareItemType |
| Balance Type: |
na |
| Period Type: |
duration |
|
| X |
- DefinitionThe number of equity-based payment instruments, excluding stock (or unit) options, that vested during the reporting period. Reference 1: http://www.xbrl.org/2003/role/disclosureRef
-Topic 718
-SubTopic 10
-Name Accounting Standards Codification
-Section 50
-Paragraph 2
-Subparagraph (c)(2)(iii)(02)
-Publisher FASB
-URI https://asc.fasb.org/1943274/2147480429/718-10-50-2
| Name: |
us-gaap_ShareBasedCompensationArrangementByShareBasedPaymentAwardEquityInstrumentsOtherThanOptionsVestedInPeriod |
| Namespace Prefix: |
us-gaap_ |
| Data Type: |
xbrli:sharesItemType |
| Balance Type: |
na |
| Period Type: |
duration |
|
| X |
- DefinitionFair value of share-based awards for which the grantee gained the right by satisfying service and performance requirements, to receive or retain shares or units, other instruments, or cash. Reference 1: http://www.xbrl.org/2003/role/disclosureRef
-Topic 718
-SubTopic 10
-Name Accounting Standards Codification
-Section 50
-Paragraph 2
-Subparagraph (d)(2)
-Publisher FASB
-URI https://asc.fasb.org/1943274/2147480429/718-10-50-2
| Name: |
us-gaap_ShareBasedCompensationArrangementByShareBasedPaymentAwardEquityInstrumentsOtherThanOptionsVestedInPeriodTotalFairValue |
| Namespace Prefix: |
us-gaap_ |
| Data Type: |
xbrli:monetaryItemType |
| Balance Type: |
debit |
| Period Type: |
duration |
|
| X |
- DefinitionNumber of shares authorized for issuance under share-based payment arrangement. Reference 1: http://www.xbrl.org/2003/role/exampleRef
-Topic 718
-SubTopic 10
-Name Accounting Standards Codification
-Section 50
-Paragraph 2
-Subparagraph (a)(3)
-Publisher FASB
-URI https://asc.fasb.org/1943274/2147480429/718-10-50-2
| Name: |
us-gaap_ShareBasedCompensationArrangementByShareBasedPaymentAwardNumberOfSharesAuthorized |
| Namespace Prefix: |
us-gaap_ |
| Data Type: |
xbrli:sharesItemType |
| Balance Type: |
na |
| Period Type: |
instant |
|
| X |
- DefinitionThe difference between the maximum number of shares (or other type of equity) authorized for issuance under the plan (including the effects of amendments and adjustments), and the sum of: 1) the number of shares (or other type of equity) already issued upon exercise of options or other equity-based awards under the plan; and 2) shares (or other type of equity) reserved for issuance on granting of outstanding awards, net of cancellations and forfeitures, if applicable. Reference 1: http://fasb.org/us-gaap/role/ref/legacyRef
-Name Accounting Standards Codification
-Topic 718
-SubTopic 10
-Section 50
-Paragraph 2
-Publisher FASB
-URI https://asc.fasb.org/1943274/2147480429/718-10-50-2
| Name: |
us-gaap_ShareBasedCompensationArrangementByShareBasedPaymentAwardNumberOfSharesAvailableForGrant |
| Namespace Prefix: |
us-gaap_ |
| Data Type: |
xbrli:sharesItemType |
| Balance Type: |
na |
| Period Type: |
instant |
|
| X |
- DefinitionAmount of accumulated difference between fair value of underlying shares on dates of exercise and exercise price on options exercised (or share units converted) into shares. Reference 1: http://www.xbrl.org/2003/role/disclosureRef
-Topic 718
-SubTopic 10
-Name Accounting Standards Codification
-Section 50
-Paragraph 2
-Subparagraph (d)(2)
-Publisher FASB
-URI https://asc.fasb.org/1943274/2147480429/718-10-50-2
| Name: |
us-gaap_ShareBasedCompensationArrangementByShareBasedPaymentAwardOptionsExercisesInPeriodTotalIntrinsicValue |
| Namespace Prefix: |
us-gaap_ |
| Data Type: |
xbrli:monetaryItemType |
| Balance Type: |
debit |
| Period Type: |
duration |
|
| X |
- DefinitionAmount of cost expensed and capitalized for award under share-based payment arrangement. Reference 1: http://www.xbrl.org/2003/role/disclosureRef
-Topic 718
-SubTopic 10
-Name Accounting Standards Codification
-Section 50
-Paragraph 2
-Subparagraph (h)(1)
-Publisher FASB
-URI https://asc.fasb.org/1943274/2147480429/718-10-50-2
| Name: |
us-gaap_SharebasedCompensationArrangementBySharebasedPaymentAwardCompensationCost1 |
| Namespace Prefix: |
us-gaap_ |
| Data Type: |
xbrli:monetaryItemType |
| Balance Type: |
debit |
| Period Type: |
duration |
|
| X |
- DefinitionPeriod from grant date that an equity-based award expires, in 'PnYnMnDTnHnMnS' format, for example, 'P1Y5M13D' represents the reported fact of one year, five months, and thirteen days. Reference 1: http://www.xbrl.org/2003/role/exampleRef
-Topic 718
-SubTopic 10
-Name Accounting Standards Codification
-Section 50
-Paragraph 2
-Subparagraph (a)(2)
-Publisher FASB
-URI https://asc.fasb.org/1943274/2147480429/718-10-50-2
| Name: |
us-gaap_SharebasedCompensationArrangementBySharebasedPaymentAwardExpirationPeriod |
| Namespace Prefix: |
us-gaap_ |
| Data Type: |
xbrli:durationItemType |
| Balance Type: |
na |
| Period Type: |
duration |
|
| X |
- DefinitionNumber of shares issued during the period as a result of an employee stock purchase plan. Reference 1: http://fasb.org/us-gaap/role/ref/legacyRef
-Name Accounting Standards Codification
-Section 50
-Paragraph 2
-SubTopic 10
-Topic 505
-Publisher FASB
-URI https://asc.fasb.org/1943274/2147481112/505-10-50-2
Reference 2: http://fasb.org/us-gaap/role/ref/legacyRef
-Topic 210
-SubTopic 10
-Name Accounting Standards Codification
-Section S99
-Paragraph 1
-Subparagraph (SX 210.5-02(28))
-Publisher FASB
-URI https://asc.fasb.org/1943274/2147480566/210-10-S99-1
Reference 3: http://fasb.org/us-gaap/role/ref/legacyRef
-Topic 210
-SubTopic 10
-Name Accounting Standards Codification
-Section S99
-Paragraph 1
-Subparagraph (SX 210.5-02(29))
-Publisher FASB
-URI https://asc.fasb.org/1943274/2147480566/210-10-S99-1
Reference 4: http://fasb.org/us-gaap/role/ref/legacyRef
-Topic 505
-SubTopic 10
-Name Accounting Standards Codification
-Section S99
-Paragraph 1
-Subparagraph (SX 210.3-04)
-Publisher FASB
-URI https://asc.fasb.org/1943274/2147480008/505-10-S99-1
| Name: |
us-gaap_StockIssuedDuringPeriodSharesEmployeeStockPurchasePlans |
| Namespace Prefix: |
us-gaap_ |
| Data Type: |
xbrli:sharesItemType |
| Balance Type: |
na |
| Period Type: |
duration |
|
| X |
- Details
| Name: |
us-gaap_RetirementPlanTypeAxis=us-gaap_OtherPostretirementBenefitPlansDefinedBenefitMember |
| Namespace Prefix: |
|
| Data Type: |
na |
| Balance Type: |
|
| Period Type: |
|
|
| X |
- Details
| Name: |
us-gaap_RetirementPlanTypeAxis=us-gaap_SupplementalEmployeeRetirementPlanDefinedBenefitMember |
| Namespace Prefix: |
|
| Data Type: |
na |
| Balance Type: |
|
| Period Type: |
|
|
| X |
- Details
| Name: |
us-gaap_SubsidiarySaleOfStockAxis=us-gaap_EmployeeStockMember |
| Namespace Prefix: |
|
| Data Type: |
na |
| Balance Type: |
|
| Period Type: |
|
|
| X |
- Details
| Name: |
us-gaap_PlanNameAxis=cmg_StockIncentivePlan2022Member |
| Namespace Prefix: |
|
| Data Type: |
na |
| Balance Type: |
|
| Period Type: |
|
|
| X |
- Details
| Name: |
us-gaap_AwardTypeAxis=us-gaap_RestrictedStockUnitsRSUMember |
| Namespace Prefix: |
|
| Data Type: |
na |
| Balance Type: |
|
| Period Type: |
|
|
| X |
- Details
| Name: |
srt_TitleOfIndividualAxis=srt_ExecutiveOfficerMember |
| Namespace Prefix: |
|
| Data Type: |
na |
| Balance Type: |
|
| Period Type: |
|
|
| X |
- Details
| Name: |
us-gaap_VestingAxis=us-gaap_ShareBasedCompensationAwardTrancheOneMember |
| Namespace Prefix: |
|
| Data Type: |
na |
| Balance Type: |
|
| Period Type: |
|
|
| X |
- Details
| Name: |
us-gaap_VestingAxis=us-gaap_ShareBasedCompensationAwardTrancheTwoMember |
| Namespace Prefix: |
|
| Data Type: |
na |
| Balance Type: |
|
| Period Type: |
|
|
| X |
- Details
| Name: |
us-gaap_VestingAxis=us-gaap_ShareBasedCompensationAwardTrancheThreeMember |
| Namespace Prefix: |
|
| Data Type: |
na |
| Balance Type: |
|
| Period Type: |
|
|
| X |
- Details
| Name: |
us-gaap_AwardTypeAxis=cmg_StockOptionsStockAppreciationRightsSosarsMember |
| Namespace Prefix: |
|
| Data Type: |
na |
| Balance Type: |
|
| Period Type: |
|
|
| X |
- Details
| Name: |
us-gaap_VestingAxis=cmg_DefinedMinimumTargetsNotMetMember |
| Namespace Prefix: |
|
| Data Type: |
na |
| Balance Type: |
|
| Period Type: |
|
|
| X |
- Details
| Name: |
srt_RangeAxis=srt_MinimumMember |
| Namespace Prefix: |
|
| Data Type: |
na |
| Balance Type: |
|
| Period Type: |
|
|
| X |
- Details
| Name: |
us-gaap_VestingAxis=cmg_VestingPeriod1Member |
| Namespace Prefix: |
|
| Data Type: |
na |
| Balance Type: |
|
| Period Type: |
|
|
| X |
- Details
| Name: |
srt_RangeAxis=srt_MaximumMember |
| Namespace Prefix: |
|
| Data Type: |
na |
| Balance Type: |
|
| Period Type: |
|
|
v3.25.0.1
Stock-Based Compensation and Employee Benefit Plans - Summary of Stock-Based Compensation Expense (Details) - USD ($)
$ in Thousands |
12 Months Ended |
Dec. 31, 2024 |
Dec. 31, 2023 |
Dec. 31, 2022 |
| Share-Based Payment Arrangement [Abstract] |
|
|
|
| Stock-based compensation |
$ 134,635
|
$ 126,686
|
$ 99,821
|
| Stock-based compensation, net of income taxes |
109,996
|
107,210
|
84,928
|
| Total capitalized stock-based compensation included in leasehold improvements, property and equipment, net on the consolidated balance sheets |
2,905
|
2,670
|
1,791
|
| Excess tax benefit on stock-based compensation recognized in provision for income taxes on the consolidated statements of income and comprehensive income |
$ 23,419
|
$ 25,437
|
$ 24,689
|
| X |
- DefinitionAmount, after tax, of expense for award under share-based payment arrangement.
| Name: |
us-gaap_AllocatedShareBasedCompensationExpenseNetOfTax |
| Namespace Prefix: |
us-gaap_ |
| Data Type: |
xbrli:monetaryItemType |
| Balance Type: |
debit |
| Period Type: |
duration |
|
| X |
- DefinitionAmount of cost capitalized for award under share-based payment arrangement. Reference 1: http://www.xbrl.org/2003/role/disclosureRef
-Topic 718
-SubTopic 10
-Name Accounting Standards Codification
-Section 50
-Paragraph 2
-Subparagraph (h)(1)(ii)
-Publisher FASB
-URI https://asc.fasb.org/1943274/2147480429/718-10-50-2
| Name: |
us-gaap_EmployeeServiceShareBasedCompensationAllocationOfRecognizedPeriodCostsCapitalizedAmount |
| Namespace Prefix: |
us-gaap_ |
| Data Type: |
xbrli:monetaryItemType |
| Balance Type: |
debit |
| Period Type: |
duration |
|
| X |
- DefinitionAmount of cost expensed and capitalized for award under share-based payment arrangement. Reference 1: http://www.xbrl.org/2003/role/disclosureRef
-Topic 718
-SubTopic 10
-Name Accounting Standards Codification
-Section 50
-Paragraph 2
-Subparagraph (h)(1)
-Publisher FASB
-URI https://asc.fasb.org/1943274/2147480429/718-10-50-2
| Name: |
us-gaap_SharebasedCompensationArrangementBySharebasedPaymentAwardCompensationCost1 |
| Namespace Prefix: |
us-gaap_ |
| Data Type: |
xbrli:monetaryItemType |
| Balance Type: |
debit |
| Period Type: |
duration |
|
v3.25.0.1
Stock-Based Compensation and Employee Benefit Plans - Summary of SOSAR Activity Under Incentive Plan (Details) - Stock Options Stock Appreciation Rights SOSARs - USD ($)
$ / shares in Units, shares in Thousands, $ in Thousands |
12 Months Ended |
Dec. 31, 2024 |
Dec. 31, 2023 |
| Shares |
|
|
| Outstanding, beginning balance (in shares) |
14,738
|
|
| Granted (in shares) |
2,533
|
|
| Exercised (in shares) |
(5,077)
|
|
| Forfeited (in shares) |
(1,780)
|
|
| Outstanding, ending balance (in shares) |
10,414
|
14,738
|
| Exercisable, ending balance (in shares) |
4,152
|
|
| Vested and expected to vest, ending balance (in shares) |
9,997
|
|
| Weighted-Average Exercise Price per Share |
|
|
| Outstanding, beginning balance (in usd per share) |
$ 26.05
|
|
| Granted (in usd per share) |
53.04
|
|
| Exercised (in usd per share) |
21.83
|
|
| Forfeited (in usd per share) |
38.56
|
|
| Outstanding, ending balance (in usd per share) |
32.53
|
$ 26.05
|
| Exercisable, ending balance (in usd per share) |
22.88
|
|
| Vested and expected to vest, ending balance (in usd per share) |
$ 32.07
|
|
| Weighted-Average Remaining Contractual Life (Years) |
|
|
| Outstanding, Weighted-Average Remaining Contractual Life (Years) |
4 years 2 months 12 days
|
4 years 4 months 24 days
|
| Exercisable, December 31, 2024 |
2 years 7 months 6 days
|
|
| Vested and expected to vest, December 31, 2024 |
4 years 1 month 6 days
|
|
| Aggregate Intrinsic Value |
|
|
| Outstanding, January 1, 2024 |
$ 290,156
|
|
| Outstanding, December 31, 2024 |
289,373
|
$ 290,156
|
| Exercisable, December 31, 2024 |
155,371
|
|
| Vested and expected to vest, December 31, 2024 |
$ 282,450
|
|
| X |
- DefinitionShare-Based Compensation Arrangement By Share-Based Payment Award, Non-Option Equity Instruments, Exercisable, Aggregate Intrinsic Value
| Name: |
cmg_ShareBasedCompensationArrangementByShareBasedPaymentAwardNonOptionEquityInstrumentsExercisableAggregateIntrinsicValue |
| Namespace Prefix: |
cmg_ |
| Data Type: |
xbrli:monetaryItemType |
| Balance Type: |
debit |
| Period Type: |
instant |
|
| X |
- DefinitionShare-Based Compensation Arrangement By Share-Based Payment Award, Non-Option Equity Instruments, Exercisable, Number
| Name: |
cmg_ShareBasedCompensationArrangementByShareBasedPaymentAwardNonOptionEquityInstrumentsExercisableNumber |
| Namespace Prefix: |
cmg_ |
| Data Type: |
xbrli:sharesItemType |
| Balance Type: |
na |
| Period Type: |
instant |
|
| X |
- DefinitionShare-Based Compensation Arrangement By Share-Based Payment Award, Non-Option Equity Instruments, Exercisable, Weighted Average Exercise Price
| Name: |
cmg_ShareBasedCompensationArrangementByShareBasedPaymentAwardNonOptionEquityInstrumentsExercisableWeightedAverageExercisePrice |
| Namespace Prefix: |
cmg_ |
| Data Type: |
dtr-types:perShareItemType |
| Balance Type: |
na |
| Period Type: |
instant |
|
| X |
- DefinitionShare-Based Compensation Arrangement By Share-Based Payment Award, Non-Option Equity Instruments, Exercisable, Weighted Average Remaining Contractual Term
| Name: |
cmg_ShareBasedCompensationArrangementByShareBasedPaymentAwardNonOptionEquityInstrumentsExercisableWeightedAverageRemainingContractualTerm |
| Namespace Prefix: |
cmg_ |
| Data Type: |
xbrli:durationItemType |
| Balance Type: |
na |
| Period Type: |
duration |
|
| X |
- DefinitionShare-based Compensation Arrangement by Share-based Payment Award, Non-Option Equity Instruments, Exercises in Period, Weighted Average Exercise Price
| Name: |
cmg_ShareBasedCompensationArrangementByShareBasedPaymentAwardNonOptionEquityInstrumentsExercisesInPeriodWeightedAverageExercisePrice |
| Namespace Prefix: |
cmg_ |
| Data Type: |
dtr-types:perShareItemType |
| Balance Type: |
na |
| Period Type: |
duration |
|
| X |
- DefinitionShare-based Compensation Arrangement by Share-based Payment Award, Non-Option Equity Instruments, Forfeited, Weighted Average Exercise Price
| Name: |
cmg_ShareBasedCompensationArrangementByShareBasedPaymentAwardNonOptionEquityInstrumentsForfeituresAndExpirationsInPeriodWeightedAverageExercisePrice |
| Namespace Prefix: |
cmg_ |
| Data Type: |
dtr-types:perShareItemType |
| Balance Type: |
na |
| Period Type: |
duration |
|
| X |
- DefinitionShare-based Compensation Arrangement by Share-based Payment Award, Non-Option Equity Instruments, Grants in Period, Weighted Average Exercise Price
| Name: |
cmg_ShareBasedCompensationArrangementByShareBasedPaymentAwardNonOptionEquityInstrumentsGrantsInPeriodWeightedAverageExercisePrice |
| Namespace Prefix: |
cmg_ |
| Data Type: |
dtr-types:perShareItemType |
| Balance Type: |
na |
| Period Type: |
duration |
|
| X |
- DefinitionShare-based Compensation Arrangement by Share-based Payment Award, Non-Option Equity Instruments, Outstanding, Weighted Average Exercise Price
| Name: |
cmg_ShareBasedCompensationArrangementByShareBasedPaymentAwardNonOptionEquityInstrumentsOutstandingWeightedAverageExercisePrice |
| Namespace Prefix: |
cmg_ |
| Data Type: |
dtr-types:perShareItemType |
| Balance Type: |
na |
| Period Type: |
instant |
|
| X |
- DefinitionShare-Based Compensation Arrangement By Share-Based Payment Award, Non-Option Equity Instruments, Vested And Expected To Vest, Aggregate Intrinsic Value
| Name: |
cmg_ShareBasedCompensationArrangementByShareBasedPaymentAwardNonOptionEquityInstrumentsVestedAndExpectedToVestAggregateIntrinsicValue |
| Namespace Prefix: |
cmg_ |
| Data Type: |
xbrli:monetaryItemType |
| Balance Type: |
debit |
| Period Type: |
instant |
|
| X |
- DefinitionShare-Based Compensation Arrangement By Share-Based Payment Award, Non-Option Equity Instruments, Vested And Expected To Vest, Number
| Name: |
cmg_ShareBasedCompensationArrangementByShareBasedPaymentAwardNonOptionEquityInstrumentsVestedAndExpectedToVestNumber |
| Namespace Prefix: |
cmg_ |
| Data Type: |
xbrli:sharesItemType |
| Balance Type: |
na |
| Period Type: |
instant |
|
| X |
- DefinitionShare-Based Compensation Arrangement By Share-Based Payment Award, Non-Option Equity Instruments, Vested And Expected To Vest, Weighted Average Exercise Price
| Name: |
cmg_ShareBasedCompensationArrangementByShareBasedPaymentAwardNonOptionEquityInstrumentsVestedAndExpectedToVestWeightedAverageExercisePrice |
| Namespace Prefix: |
cmg_ |
| Data Type: |
dtr-types:perShareItemType |
| Balance Type: |
na |
| Period Type: |
instant |
|
| X |
- DefinitionShare-Based Compensation Arrangement By Share-Based Payment Award, Non-Option Equity Instruments, Vested And Expected To Vest, Weighted Average Remaining Contractual Term
| Name: |
cmg_ShareBasedCompensationArrangementByShareBasedPaymentAwardNonOptionEquityInstrumentsVestedAndExpectedToVestWeightedAverageRemainingContractualTerm |
| Namespace Prefix: |
cmg_ |
| Data Type: |
xbrli:durationItemType |
| Balance Type: |
na |
| Period Type: |
duration |
|
| X |
- DefinitionWeighted average remaining contractual term for equity-based awards excluding options, in 'PnYnMnDTnHnMnS' format, for example, 'P1Y5M13D' represents the reported fact of one year, five months, and thirteen days. Reference 1: http://fasb.org/us-gaap/role/ref/legacyRef
-Topic 718
-SubTopic 10
-Subparagraph (e)(1)
-Name Accounting Standards Codification
-Paragraph 2
-Section 50
-Publisher FASB
-URI https://asc.fasb.org/1943274/2147480429/718-10-50-2
| Name: |
us-gaap_ShareBasedCompensationArrangementByShareBasedPaymentAwardEquityInstrumentsOtherThanOptionsOutstandingWeightedAverageRemainingContractualTerms |
| Namespace Prefix: |
us-gaap_ |
| Data Type: |
xbrli:durationItemType |
| Balance Type: |
na |
| Period Type: |
duration |
|
| X |
- DefinitionNumber of non-option equity instruments exercised by participants. Reference 1: http://fasb.org/us-gaap/role/ref/legacyRef
-Name Accounting Standards Codification
-Section 50
-Paragraph 2
-Subparagraph (c)(1)(iv)(02)
-SubTopic 10
-Topic 718
-Publisher FASB
-URI https://asc.fasb.org/1943274/2147480429/718-10-50-2
| Name: |
us-gaap_ShareBasedCompensationArrangementByShareBasedPaymentAwardNonOptionEquityInstrumentsExercised |
| Namespace Prefix: |
us-gaap_ |
| Data Type: |
xbrli:sharesItemType |
| Balance Type: |
na |
| Period Type: |
duration |
|
| X |
- DefinitionNumber of shares under non-option equity instrument agreements that were either cancelled or expired. Reference 1: http://fasb.org/us-gaap/role/ref/legacyRef
-Topic 718
-SubTopic 10
-Name Accounting Standards Codification
-Section 50
-Paragraph 2
-Subparagraph (c)(1)(iv)(04)
-Publisher FASB
-URI https://asc.fasb.org/1943274/2147480429/718-10-50-2
Reference 2: http://fasb.org/us-gaap/role/ref/legacyRef
-Topic 718
-SubTopic 10
-Name Accounting Standards Codification
-Section 50
-Paragraph 2
-Subparagraph (c)(1)(iv)(03)
-Publisher FASB
-URI https://asc.fasb.org/1943274/2147480429/718-10-50-2
| Name: |
us-gaap_ShareBasedCompensationArrangementByShareBasedPaymentAwardNonOptionEquityInstrumentsForfeituresAndExpirations |
| Namespace Prefix: |
us-gaap_ |
| Data Type: |
xbrli:sharesItemType |
| Balance Type: |
na |
| Period Type: |
duration |
|
| X |
- DefinitionNet number of non-option equity instruments granted to participants. Reference 1: http://fasb.org/us-gaap/role/ref/legacyRef
-Name Accounting Standards Codification
-Section 50
-Paragraph 2
-Subparagraph (c)(1)(iv)(01)
-SubTopic 10
-Topic 718
-Publisher FASB
-URI https://asc.fasb.org/1943274/2147480429/718-10-50-2
| Name: |
us-gaap_ShareBasedCompensationArrangementByShareBasedPaymentAwardNonOptionEquityInstrumentsGranted |
| Namespace Prefix: |
us-gaap_ |
| Data Type: |
xbrli:sharesItemType |
| Balance Type: |
na |
| Period Type: |
duration |
|
| X |
- DefinitionNumber of equity instruments other than options outstanding, including both vested and non-vested instruments. Reference 1: http://fasb.org/us-gaap/role/ref/legacyRef
-Topic 718
-SubTopic 10
-Name Accounting Standards Codification
-Section 50
-Paragraph 2
-Subparagraph (c)(1)(ii)
-Publisher FASB
-URI https://asc.fasb.org/1943274/2147480429/718-10-50-2
Reference 2: http://fasb.org/us-gaap/role/ref/legacyRef
-Topic 718
-SubTopic 10
-Name Accounting Standards Codification
-Section 50
-Paragraph 2
-Subparagraph (c)(1)(i)
-Publisher FASB
-URI https://asc.fasb.org/1943274/2147480429/718-10-50-2
| Name: |
us-gaap_ShareBasedCompensationArrangementByShareBasedPaymentAwardNonOptionEquityInstrumentsOutstandingNumber |
| Namespace Prefix: |
us-gaap_ |
| Data Type: |
xbrli:sharesItemType |
| Balance Type: |
na |
| Period Type: |
instant |
|
| X |
- DefinitionA roll forward is a reconciliation of a concept from the beginning of a period to the end of a period.
| Name: |
us-gaap_ShareBasedCompensationArrangementByShareBasedPaymentAwardNonOptionEquityInstrumentsOutstandingRollForward |
| Namespace Prefix: |
us-gaap_ |
| Data Type: |
xbrli:stringItemType |
| Balance Type: |
na |
| Period Type: |
duration |
|
| X |
- References
+ Details
| Name: |
us-gaap_ShareBasedCompensationArrangementByShareBasedPaymentAwardOptionsAdditionalDisclosuresAbstract |
| Namespace Prefix: |
us-gaap_ |
| Data Type: |
xbrli:stringItemType |
| Balance Type: |
na |
| Period Type: |
duration |
|
| X |
- References
+ Details
| Name: |
us-gaap_ShareBasedCompensationArrangementByShareBasedPaymentAwardOptionsOutstandingWeightedAverageExercisePriceRollforward |
| Namespace Prefix: |
us-gaap_ |
| Data Type: |
xbrli:stringItemType |
| Balance Type: |
na |
| Period Type: |
duration |
|
| X |
- References
+ Details
| Name: |
us-gaap_SharebasedCompensationArrangementBySharebasedPaymentAwardEquityInstrumentsOtherThanOptionsAggregateIntrinsicValueAbstract |
| Namespace Prefix: |
us-gaap_ |
| Data Type: |
xbrli:stringItemType |
| Balance Type: |
na |
| Period Type: |
duration |
|
| X |
- DefinitionIntrinsic value of outstanding award under share-based payment arrangement. Excludes share and unit options.
| Name: |
us-gaap_SharebasedCompensationArrangementBySharebasedPaymentAwardEquityInstrumentsOtherThanOptionsAggregateIntrinsicValueOutstanding |
| Namespace Prefix: |
us-gaap_ |
| Data Type: |
xbrli:monetaryItemType |
| Balance Type: |
debit |
| Period Type: |
instant |
|
| X |
- Details
| Name: |
us-gaap_AwardTypeAxis=cmg_StockOptionsStockAppreciationRightsSOSARsMember |
| Namespace Prefix: |
|
| Data Type: |
na |
| Balance Type: |
|
| Period Type: |
|
|
v3.25.0.1
| X |
- DefinitionThe estimated dividend rate (a percentage of the share price) to be paid (expected dividends) to holders of the underlying shares over the option's term. Reference 1: http://www.xbrl.org/2003/role/disclosureRef
-Topic 718
-SubTopic 10
-Name Accounting Standards Codification
-Section 50
-Paragraph 2
-Subparagraph (f)(2)(iii)
-Publisher FASB
-URI https://asc.fasb.org/1943274/2147480429/718-10-50-2
| Name: |
us-gaap_ShareBasedCompensationArrangementByShareBasedPaymentAwardFairValueAssumptionsExpectedDividendRate |
| Namespace Prefix: |
us-gaap_ |
| Data Type: |
dtr-types:percentItemType |
| Balance Type: |
na |
| Period Type: |
duration |
|
| X |
- DefinitionThe risk-free interest rate assumption that is used in valuing an option on its own shares. Reference 1: http://www.xbrl.org/2003/role/disclosureRef
-Topic 718
-SubTopic 10
-Name Accounting Standards Codification
-Section 50
-Paragraph 2
-Subparagraph (f)(2)(iv)
-Publisher FASB
-URI https://asc.fasb.org/1943274/2147480429/718-10-50-2
| Name: |
us-gaap_ShareBasedCompensationArrangementByShareBasedPaymentAwardFairValueAssumptionsRiskFreeInterestRate |
| Namespace Prefix: |
us-gaap_ |
| Data Type: |
dtr-types:percentItemType |
| Balance Type: |
na |
| Period Type: |
duration |
|
| X |
- DefinitionRate of weighted-average expected volatility for award under share-based payment arrangement. Reference 1: http://www.xbrl.org/2003/role/disclosureRef
-Topic 718
-SubTopic 10
-Name Accounting Standards Codification
-Section 50
-Paragraph 2
-Subparagraph (f)(2)(ii)
-Publisher FASB
-URI https://asc.fasb.org/1943274/2147480429/718-10-50-2
| Name: |
us-gaap_ShareBasedCompensationArrangementByShareBasedPaymentAwardFairValueAssumptionsWeightedAverageVolatilityRate |
| Namespace Prefix: |
us-gaap_ |
| Data Type: |
dtr-types:percentItemType |
| Balance Type: |
na |
| Period Type: |
duration |
|
| X |
- DefinitionThe weighted average grant-date fair value of options granted during the reporting period as calculated by applying the disclosed option pricing methodology. Reference 1: http://www.xbrl.org/2003/role/disclosureRef
-Topic 718
-SubTopic 10
-Name Accounting Standards Codification
-Section 50
-Paragraph 2
-Subparagraph (d)(1)
-Publisher FASB
-URI https://asc.fasb.org/1943274/2147480429/718-10-50-2
| Name: |
us-gaap_ShareBasedCompensationArrangementByShareBasedPaymentAwardOptionsGrantsInPeriodWeightedAverageGrantDateFairValue |
| Namespace Prefix: |
us-gaap_ |
| Data Type: |
dtr-types:perShareItemType |
| Balance Type: |
na |
| Period Type: |
duration |
|
| X |
- DefinitionExpected term of award under share-based payment arrangement, in 'PnYnMnDTnHnMnS' format, for example, 'P1Y5M13D' represents reported fact of one year, five months, and thirteen days. Reference 1: http://www.xbrl.org/2003/role/disclosureRef
-Topic 718
-SubTopic 10
-Name Accounting Standards Codification
-Section 50
-Paragraph 2
-Subparagraph (f)(2)(i)
-Publisher FASB
-URI https://asc.fasb.org/1943274/2147480429/718-10-50-2
| Name: |
us-gaap_SharebasedCompensationArrangementBySharebasedPaymentAwardFairValueAssumptionsExpectedTerm1 |
| Namespace Prefix: |
us-gaap_ |
| Data Type: |
xbrli:durationItemType |
| Balance Type: |
na |
| Period Type: |
duration |
|
v3.25.0.1
Stock-Based Compensation and Employee Benefit Plans - Schedule of Non-Vested Stock Awards (RSUs) Activity (Details) - $ / shares
shares in Thousands |
12 Months Ended |
Dec. 31, 2024 |
Dec. 31, 2023 |
Dec. 31, 2022 |
| RSUs |
|
|
|
| Shares |
|
|
|
| Beginning balance (in shares) |
3,002
|
|
|
| Granted (in shares) |
2,615
|
|
|
| Vested (in shares) |
(948)
|
|
|
| Forfeited (in shares) |
(322)
|
|
|
| Ending balance (in shares) |
4,347
|
3,002
|
|
| Vested and expected to vest, ending balance (in shares) |
3,919
|
|
|
| Weighted-Average Grant Date Fair Value per Share |
|
|
|
| Beginning balance (in usd per share) |
$ 32.08
|
|
|
| Granted (in usd per share) |
53.67
|
$ 33.32
|
$ 31.19
|
| Vested (in usd per share) |
31.96
|
|
|
| Forfeited (in usd per share) |
39.58
|
|
|
| Ending balance (in usd per share) |
44.54
|
$ 32.08
|
|
| Vested and expected to vest, ending balance (in usd per share) |
$ 44.21
|
|
|
| Performance Shares |
|
|
|
| Shares |
|
|
|
| Beginning balance (in shares) |
2,794
|
|
|
| Granted (in shares) |
866
|
|
|
| Vested (in shares) |
(777)
|
|
|
| Forfeited (in shares) |
(838)
|
|
|
| Ending balance (in shares) |
2,045
|
2,794
|
|
| Vested and expected to vest, ending balance (in shares) |
3,649
|
|
|
| Weighted-Average Grant Date Fair Value per Share |
|
|
|
| Beginning balance (in usd per share) |
$ 31.24
|
|
|
| Granted (in usd per share) |
52.90
|
$ 32.14
|
$ 31.39
|
| Vested (in usd per share) |
29.59
|
|
|
| Forfeited (in usd per share) |
37.89
|
|
|
| Ending balance (in usd per share) |
38.32
|
$ 31.24
|
|
| Vested and expected to vest, ending balance (in usd per share) |
$ 37.78
|
|
|
| X |
- DefinitionShare-Based Compensation Arrangement by Share-Based Payment Award, Equity Instruments Other than Options, Vested And Expected To Vest, Number
| Name: |
cmg_ShareBasedCompensationArrangementByShareBasedPaymentAwardEquityInstrumentsOtherThanOptionsVestedAndExpectedToVestNumber |
| Namespace Prefix: |
cmg_ |
| Data Type: |
xbrli:sharesItemType |
| Balance Type: |
na |
| Period Type: |
instant |
|
| X |
- DefinitionShare-Based Compensation Arrangement by Share-Based Payment Award, Equity Instruments Other than Options, Vested And Expected To Vest, Weighted Average Grant Date Fair Value
| Name: |
cmg_ShareBasedCompensationArrangementByShareBasedPaymentAwardEquityInstrumentsOtherThanOptionsVestedAndExpectedToVestWeightedAverageGrantDateFairValue |
| Namespace Prefix: |
cmg_ |
| Data Type: |
dtr-types:perShareItemType |
| Balance Type: |
na |
| Period Type: |
instant |
|
| X |
- DefinitionThe number of equity-based payment instruments, excluding stock (or unit) options, that were forfeited during the reporting period. Reference 1: http://www.xbrl.org/2003/role/disclosureRef
-Topic 718
-SubTopic 10
-Name Accounting Standards Codification
-Section 50
-Paragraph 2
-Subparagraph (c)(2)(iii)(03)
-Publisher FASB
-URI https://asc.fasb.org/1943274/2147480429/718-10-50-2
| Name: |
us-gaap_ShareBasedCompensationArrangementByShareBasedPaymentAwardEquityInstrumentsOtherThanOptionsForfeitedInPeriod |
| Namespace Prefix: |
us-gaap_ |
| Data Type: |
xbrli:sharesItemType |
| Balance Type: |
na |
| Period Type: |
duration |
|
| X |
- DefinitionWeighted average fair value as of the grant date of equity-based award plans other than stock (unit) option plans that were not exercised or put into effect as a result of the occurrence of a terminating event. Reference 1: http://www.xbrl.org/2003/role/disclosureRef
-Topic 718
-SubTopic 10
-Name Accounting Standards Codification
-Section 50
-Paragraph 2
-Subparagraph (c)(2)(iii)(03)
-Publisher FASB
-URI https://asc.fasb.org/1943274/2147480429/718-10-50-2
| Name: |
us-gaap_ShareBasedCompensationArrangementByShareBasedPaymentAwardEquityInstrumentsOtherThanOptionsForfeituresWeightedAverageGrantDateFairValue |
| Namespace Prefix: |
us-gaap_ |
| Data Type: |
dtr-types:perShareItemType |
| Balance Type: |
na |
| Period Type: |
duration |
|
| X |
- DefinitionThe number of grants made during the period on other than stock (or unit) option plans (for example, phantom stock or unit plan, stock or unit appreciation rights plan, performance target plan). Reference 1: http://www.xbrl.org/2003/role/disclosureRef
-Topic 718
-SubTopic 10
-Name Accounting Standards Codification
-Section 50
-Paragraph 2
-Subparagraph (c)(2)(iii)(01)
-Publisher FASB
-URI https://asc.fasb.org/1943274/2147480429/718-10-50-2
| Name: |
us-gaap_ShareBasedCompensationArrangementByShareBasedPaymentAwardEquityInstrumentsOtherThanOptionsGrantsInPeriod |
| Namespace Prefix: |
us-gaap_ |
| Data Type: |
xbrli:sharesItemType |
| Balance Type: |
na |
| Period Type: |
duration |
|
| X |
- DefinitionThe weighted average fair value at grant date for nonvested equity-based awards issued during the period on other than stock (or unit) option plans (for example, phantom stock or unit plan, stock or unit appreciation rights plan, performance target plan). Reference 1: http://www.xbrl.org/2003/role/disclosureRef
-Topic 718
-SubTopic 10
-Name Accounting Standards Codification
-Section 50
-Paragraph 2
-Subparagraph (c)(2)(iii)(01)
-Publisher FASB
-URI https://asc.fasb.org/1943274/2147480429/718-10-50-2
| Name: |
us-gaap_ShareBasedCompensationArrangementByShareBasedPaymentAwardEquityInstrumentsOtherThanOptionsGrantsInPeriodWeightedAverageGrantDateFairValue |
| Namespace Prefix: |
us-gaap_ |
| Data Type: |
dtr-types:perShareItemType |
| Balance Type: |
na |
| Period Type: |
duration |
|
| X |
- DefinitionThe number of non-vested equity-based payment instruments, excluding stock (or unit) options, that validly exist and are outstanding as of the balance sheet date. Reference 1: http://www.xbrl.org/2003/role/disclosureRef
-Topic 718
-SubTopic 10
-Name Accounting Standards Codification
-Section 50
-Paragraph 2
-Subparagraph (c)(2)(i)
-Publisher FASB
-URI https://asc.fasb.org/1943274/2147480429/718-10-50-2
Reference 2: http://www.xbrl.org/2003/role/disclosureRef
-Topic 718
-SubTopic 10
-Name Accounting Standards Codification
-Section 50
-Paragraph 2
-Subparagraph (c)(2)(ii)
-Publisher FASB
-URI https://asc.fasb.org/1943274/2147480429/718-10-50-2
| Name: |
us-gaap_ShareBasedCompensationArrangementByShareBasedPaymentAwardEquityInstrumentsOtherThanOptionsNonvestedNumber |
| Namespace Prefix: |
us-gaap_ |
| Data Type: |
xbrli:sharesItemType |
| Balance Type: |
na |
| Period Type: |
instant |
|
| X |
- DefinitionA roll forward is a reconciliation of a concept from the beginning of a period to the end of a period.
| Name: |
us-gaap_ShareBasedCompensationArrangementByShareBasedPaymentAwardEquityInstrumentsOtherThanOptionsNonvestedRollForward |
| Namespace Prefix: |
us-gaap_ |
| Data Type: |
xbrli:stringItemType |
| Balance Type: |
na |
| Period Type: |
duration |
|
| X |
- DefinitionPer share or unit weighted-average fair value of nonvested award under share-based payment arrangement. Excludes share and unit options. Reference 1: http://www.xbrl.org/2003/role/disclosureRef
-Topic 718
-SubTopic 10
-Name Accounting Standards Codification
-Section 50
-Paragraph 2
-Subparagraph (c)(2)(i)
-Publisher FASB
-URI https://asc.fasb.org/1943274/2147480429/718-10-50-2
Reference 2: http://www.xbrl.org/2003/role/disclosureRef
-Topic 718
-SubTopic 10
-Name Accounting Standards Codification
-Section 50
-Paragraph 2
-Subparagraph (c)(2)(ii)
-Publisher FASB
-URI https://asc.fasb.org/1943274/2147480429/718-10-50-2
| Name: |
us-gaap_ShareBasedCompensationArrangementByShareBasedPaymentAwardEquityInstrumentsOtherThanOptionsNonvestedWeightedAverageGrantDateFairValue |
| Namespace Prefix: |
us-gaap_ |
| Data Type: |
dtr-types:perShareItemType |
| Balance Type: |
na |
| Period Type: |
instant |
|
| X |
- References
+ Details
| Name: |
us-gaap_ShareBasedCompensationArrangementByShareBasedPaymentAwardEquityInstrumentsOtherThanOptionsNonvestedWeightedAverageGrantDateFairValueRollForward |
| Namespace Prefix: |
us-gaap_ |
| Data Type: |
xbrli:stringItemType |
| Balance Type: |
na |
| Period Type: |
duration |
|
| X |
- DefinitionThe number of equity-based payment instruments, excluding stock (or unit) options, that vested during the reporting period. Reference 1: http://www.xbrl.org/2003/role/disclosureRef
-Topic 718
-SubTopic 10
-Name Accounting Standards Codification
-Section 50
-Paragraph 2
-Subparagraph (c)(2)(iii)(02)
-Publisher FASB
-URI https://asc.fasb.org/1943274/2147480429/718-10-50-2
| Name: |
us-gaap_ShareBasedCompensationArrangementByShareBasedPaymentAwardEquityInstrumentsOtherThanOptionsVestedInPeriod |
| Namespace Prefix: |
us-gaap_ |
| Data Type: |
xbrli:sharesItemType |
| Balance Type: |
na |
| Period Type: |
duration |
|
| X |
- DefinitionThe weighted average fair value as of grant date pertaining to an equity-based award plan other than a stock (or unit) option plan for which the grantee gained the right during the reporting period, by satisfying service and performance requirements, to receive or retain shares or units, other instruments, or cash in accordance with the terms of the arrangement. Reference 1: http://www.xbrl.org/2003/role/disclosureRef
-Topic 718
-SubTopic 10
-Name Accounting Standards Codification
-Section 50
-Paragraph 2
-Subparagraph (c)(2)(iii)(02)
-Publisher FASB
-URI https://asc.fasb.org/1943274/2147480429/718-10-50-2
| Name: |
us-gaap_ShareBasedCompensationArrangementByShareBasedPaymentAwardEquityInstrumentsOtherThanOptionsVestedInPeriodWeightedAverageGrantDateFairValue |
| Namespace Prefix: |
us-gaap_ |
| Data Type: |
dtr-types:perShareItemType |
| Balance Type: |
na |
| Period Type: |
duration |
|
| X |
- Details
| Name: |
us-gaap_AwardTypeAxis=us-gaap_RestrictedStockUnitsRSUMember |
| Namespace Prefix: |
|
| Data Type: |
na |
| Balance Type: |
|
| Period Type: |
|
|
v3.25.0.1
| X |
- DefinitionShare-Based Compensation Arrangement by Share-Based Payment Award, Equity Instruments Other than Options, Vested And Expected To Vest, Number
| Name: |
cmg_ShareBasedCompensationArrangementByShareBasedPaymentAwardEquityInstrumentsOtherThanOptionsVestedAndExpectedToVestNumber |
| Namespace Prefix: |
cmg_ |
| Data Type: |
xbrli:sharesItemType |
| Balance Type: |
na |
| Period Type: |
instant |
|
| X |
- DefinitionShare-Based Compensation Arrangement by Share-Based Payment Award, Equity Instruments Other than Options, Vested And Expected To Vest, Weighted Average Grant Date Fair Value
| Name: |
cmg_ShareBasedCompensationArrangementByShareBasedPaymentAwardEquityInstrumentsOtherThanOptionsVestedAndExpectedToVestWeightedAverageGrantDateFairValue |
| Namespace Prefix: |
cmg_ |
| Data Type: |
dtr-types:perShareItemType |
| Balance Type: |
na |
| Period Type: |
instant |
|
| X |
- DefinitionThe number of equity-based payment instruments, excluding stock (or unit) options, that were forfeited during the reporting period. Reference 1: http://www.xbrl.org/2003/role/disclosureRef
-Topic 718
-SubTopic 10
-Name Accounting Standards Codification
-Section 50
-Paragraph 2
-Subparagraph (c)(2)(iii)(03)
-Publisher FASB
-URI https://asc.fasb.org/1943274/2147480429/718-10-50-2
| Name: |
us-gaap_ShareBasedCompensationArrangementByShareBasedPaymentAwardEquityInstrumentsOtherThanOptionsForfeitedInPeriod |
| Namespace Prefix: |
us-gaap_ |
| Data Type: |
xbrli:sharesItemType |
| Balance Type: |
na |
| Period Type: |
duration |
|
| X |
- DefinitionWeighted average fair value as of the grant date of equity-based award plans other than stock (unit) option plans that were not exercised or put into effect as a result of the occurrence of a terminating event. Reference 1: http://www.xbrl.org/2003/role/disclosureRef
-Topic 718
-SubTopic 10
-Name Accounting Standards Codification
-Section 50
-Paragraph 2
-Subparagraph (c)(2)(iii)(03)
-Publisher FASB
-URI https://asc.fasb.org/1943274/2147480429/718-10-50-2
| Name: |
us-gaap_ShareBasedCompensationArrangementByShareBasedPaymentAwardEquityInstrumentsOtherThanOptionsForfeituresWeightedAverageGrantDateFairValue |
| Namespace Prefix: |
us-gaap_ |
| Data Type: |
dtr-types:perShareItemType |
| Balance Type: |
na |
| Period Type: |
duration |
|
| X |
- DefinitionThe number of grants made during the period on other than stock (or unit) option plans (for example, phantom stock or unit plan, stock or unit appreciation rights plan, performance target plan). Reference 1: http://www.xbrl.org/2003/role/disclosureRef
-Topic 718
-SubTopic 10
-Name Accounting Standards Codification
-Section 50
-Paragraph 2
-Subparagraph (c)(2)(iii)(01)
-Publisher FASB
-URI https://asc.fasb.org/1943274/2147480429/718-10-50-2
| Name: |
us-gaap_ShareBasedCompensationArrangementByShareBasedPaymentAwardEquityInstrumentsOtherThanOptionsGrantsInPeriod |
| Namespace Prefix: |
us-gaap_ |
| Data Type: |
xbrli:sharesItemType |
| Balance Type: |
na |
| Period Type: |
duration |
|
| X |
- DefinitionThe weighted average fair value at grant date for nonvested equity-based awards issued during the period on other than stock (or unit) option plans (for example, phantom stock or unit plan, stock or unit appreciation rights plan, performance target plan). Reference 1: http://www.xbrl.org/2003/role/disclosureRef
-Topic 718
-SubTopic 10
-Name Accounting Standards Codification
-Section 50
-Paragraph 2
-Subparagraph (c)(2)(iii)(01)
-Publisher FASB
-URI https://asc.fasb.org/1943274/2147480429/718-10-50-2
| Name: |
us-gaap_ShareBasedCompensationArrangementByShareBasedPaymentAwardEquityInstrumentsOtherThanOptionsGrantsInPeriodWeightedAverageGrantDateFairValue |
| Namespace Prefix: |
us-gaap_ |
| Data Type: |
dtr-types:perShareItemType |
| Balance Type: |
na |
| Period Type: |
duration |
|
| X |
- DefinitionThe number of non-vested equity-based payment instruments, excluding stock (or unit) options, that validly exist and are outstanding as of the balance sheet date. Reference 1: http://www.xbrl.org/2003/role/disclosureRef
-Topic 718
-SubTopic 10
-Name Accounting Standards Codification
-Section 50
-Paragraph 2
-Subparagraph (c)(2)(i)
-Publisher FASB
-URI https://asc.fasb.org/1943274/2147480429/718-10-50-2
Reference 2: http://www.xbrl.org/2003/role/disclosureRef
-Topic 718
-SubTopic 10
-Name Accounting Standards Codification
-Section 50
-Paragraph 2
-Subparagraph (c)(2)(ii)
-Publisher FASB
-URI https://asc.fasb.org/1943274/2147480429/718-10-50-2
| Name: |
us-gaap_ShareBasedCompensationArrangementByShareBasedPaymentAwardEquityInstrumentsOtherThanOptionsNonvestedNumber |
| Namespace Prefix: |
us-gaap_ |
| Data Type: |
xbrli:sharesItemType |
| Balance Type: |
na |
| Period Type: |
instant |
|
| X |
- DefinitionA roll forward is a reconciliation of a concept from the beginning of a period to the end of a period.
| Name: |
us-gaap_ShareBasedCompensationArrangementByShareBasedPaymentAwardEquityInstrumentsOtherThanOptionsNonvestedRollForward |
| Namespace Prefix: |
us-gaap_ |
| Data Type: |
xbrli:stringItemType |
| Balance Type: |
na |
| Period Type: |
duration |
|
| X |
- DefinitionPer share or unit weighted-average fair value of nonvested award under share-based payment arrangement. Excludes share and unit options. Reference 1: http://www.xbrl.org/2003/role/disclosureRef
-Topic 718
-SubTopic 10
-Name Accounting Standards Codification
-Section 50
-Paragraph 2
-Subparagraph (c)(2)(i)
-Publisher FASB
-URI https://asc.fasb.org/1943274/2147480429/718-10-50-2
Reference 2: http://www.xbrl.org/2003/role/disclosureRef
-Topic 718
-SubTopic 10
-Name Accounting Standards Codification
-Section 50
-Paragraph 2
-Subparagraph (c)(2)(ii)
-Publisher FASB
-URI https://asc.fasb.org/1943274/2147480429/718-10-50-2
| Name: |
us-gaap_ShareBasedCompensationArrangementByShareBasedPaymentAwardEquityInstrumentsOtherThanOptionsNonvestedWeightedAverageGrantDateFairValue |
| Namespace Prefix: |
us-gaap_ |
| Data Type: |
dtr-types:perShareItemType |
| Balance Type: |
na |
| Period Type: |
instant |
|
| X |
- References
+ Details
| Name: |
us-gaap_ShareBasedCompensationArrangementByShareBasedPaymentAwardEquityInstrumentsOtherThanOptionsNonvestedWeightedAverageGrantDateFairValueRollForward |
| Namespace Prefix: |
us-gaap_ |
| Data Type: |
xbrli:stringItemType |
| Balance Type: |
na |
| Period Type: |
duration |
|
| X |
- DefinitionThe number of equity-based payment instruments, excluding stock (or unit) options, that vested during the reporting period. Reference 1: http://www.xbrl.org/2003/role/disclosureRef
-Topic 718
-SubTopic 10
-Name Accounting Standards Codification
-Section 50
-Paragraph 2
-Subparagraph (c)(2)(iii)(02)
-Publisher FASB
-URI https://asc.fasb.org/1943274/2147480429/718-10-50-2
| Name: |
us-gaap_ShareBasedCompensationArrangementByShareBasedPaymentAwardEquityInstrumentsOtherThanOptionsVestedInPeriod |
| Namespace Prefix: |
us-gaap_ |
| Data Type: |
xbrli:sharesItemType |
| Balance Type: |
na |
| Period Type: |
duration |
|
| X |
- DefinitionThe weighted average fair value as of grant date pertaining to an equity-based award plan other than a stock (or unit) option plan for which the grantee gained the right during the reporting period, by satisfying service and performance requirements, to receive or retain shares or units, other instruments, or cash in accordance with the terms of the arrangement. Reference 1: http://www.xbrl.org/2003/role/disclosureRef
-Topic 718
-SubTopic 10
-Name Accounting Standards Codification
-Section 50
-Paragraph 2
-Subparagraph (c)(2)(iii)(02)
-Publisher FASB
-URI https://asc.fasb.org/1943274/2147480429/718-10-50-2
| Name: |
us-gaap_ShareBasedCompensationArrangementByShareBasedPaymentAwardEquityInstrumentsOtherThanOptionsVestedInPeriodWeightedAverageGrantDateFairValue |
| Namespace Prefix: |
us-gaap_ |
| Data Type: |
dtr-types:perShareItemType |
| Balance Type: |
na |
| Period Type: |
duration |
|
v3.25.0.1
| X |
- DefinitionDeferred Compensation Liability, Current and Noncurrent, After Year Five
| Name: |
cmg_DeferredCompensationLiabilityCurrentAndNoncurrentAfterYearFive |
| Namespace Prefix: |
cmg_ |
| Data Type: |
xbrli:monetaryItemType |
| Balance Type: |
credit |
| Period Type: |
instant |
|
| X |
- DefinitionDeferred Compensation Liability, Current and Noncurrent, Year One
| Name: |
cmg_DeferredCompensationLiabilityCurrentAndNoncurrentYearOne |
| Namespace Prefix: |
cmg_ |
| Data Type: |
xbrli:monetaryItemType |
| Balance Type: |
credit |
| Period Type: |
instant |
|
| X |
- DefinitionDeferred Compensation Liability, Current and Noncurrent, Years Four-Five
| Name: |
cmg_DeferredCompensationLiabilityCurrentAndNoncurrentYearsFourFive |
| Namespace Prefix: |
cmg_ |
| Data Type: |
xbrli:monetaryItemType |
| Balance Type: |
credit |
| Period Type: |
instant |
|
| X |
- DefinitionDeferred Compensation Liability, Current and Noncurrent, Years Two-Three
| Name: |
cmg_DeferredCompensationLiabilityCurrentAndNoncurrentYearsTwoThree |
| Namespace Prefix: |
cmg_ |
| Data Type: |
xbrli:monetaryItemType |
| Balance Type: |
credit |
| Period Type: |
instant |
|
| X |
- DefinitionAggregate carrying value as of the balance sheet date of the liabilities for all deferred compensation arrangements. Represents currently earned compensation under compensation arrangements that is not actually paid until a later date.
| Name: |
us-gaap_DeferredCompensationLiabilityCurrentAndNoncurrent |
| Namespace Prefix: |
us-gaap_ |
| Data Type: |
xbrli:monetaryItemType |
| Balance Type: |
credit |
| Period Type: |
instant |
|
v3.25.0.1
| X |
- References
+ Details
| Name: |
us-gaap_LeasesAbstract |
| Namespace Prefix: |
us-gaap_ |
| Data Type: |
xbrli:stringItemType |
| Balance Type: |
na |
| Period Type: |
duration |
|
| X |
- DefinitionWeighted average discount rate for operating lease calculated at point in time. Reference 1: http://www.xbrl.org/2003/role/exampleRef
-Topic 842
-SubTopic 20
-Name Accounting Standards Codification
-Section 55
-Paragraph 53
-Publisher FASB
-URI https://asc.fasb.org/1943274/2147479589/842-20-55-53
Reference 2: http://www.xbrl.org/2003/role/disclosureRef
-Topic 842
-SubTopic 20
-Name Accounting Standards Codification
-Section 50
-Paragraph 4
-Subparagraph (g)(4)
-Publisher FASB
-URI https://asc.fasb.org/1943274/2147478964/842-20-50-4
| Name: |
us-gaap_OperatingLeaseWeightedAverageDiscountRatePercent |
| Namespace Prefix: |
us-gaap_ |
| Data Type: |
dtr-types:percentItemType |
| Balance Type: |
na |
| Period Type: |
instant |
|
| X |
- DefinitionWeighted average remaining lease term for operating lease, in 'PnYnMnDTnHnMnS' format, for example, 'P1Y5M13D' represents reported fact of one year, five months, and thirteen days. Reference 1: http://www.xbrl.org/2003/role/exampleRef
-Topic 842
-SubTopic 20
-Name Accounting Standards Codification
-Section 55
-Paragraph 53
-Publisher FASB
-URI https://asc.fasb.org/1943274/2147479589/842-20-55-53
Reference 2: http://www.xbrl.org/2003/role/disclosureRef
-Topic 842
-SubTopic 20
-Name Accounting Standards Codification
-Section 50
-Paragraph 4
-Subparagraph (g)(3)
-Publisher FASB
-URI https://asc.fasb.org/1943274/2147478964/842-20-50-4
| Name: |
us-gaap_OperatingLeaseWeightedAverageRemainingLeaseTerm1 |
| Namespace Prefix: |
us-gaap_ |
| Data Type: |
xbrli:durationItemType |
| Balance Type: |
na |
| Period Type: |
instant |
|
v3.25.0.1
Leases - Schedule of Lease Expense Components (Details) - USD ($)
$ in Thousands |
12 Months Ended |
Dec. 31, 2024 |
Dec. 31, 2023 |
Dec. 31, 2022 |
| Lessee, Lease, Description [Line Items] |
|
|
|
| Total lease cost |
$ 604,559
|
$ 543,963
|
$ 494,937
|
| Occupancy, Other operating costs, General and administrative expenses and Pre-opening costs |
|
|
|
| Lessee, Lease, Description [Line Items] |
|
|
|
| Operating lease cost |
486,598
|
436,313
|
397,112
|
| Variable lease cost |
120,948
|
111,896
|
102,636
|
| Other operating costs |
|
|
|
| Lessee, Lease, Description [Line Items] |
|
|
|
| Short-term lease cost |
572
|
519
|
633
|
| General and administrative expenses |
|
|
|
| Lessee, Lease, Description [Line Items] |
|
|
|
| Sublease income |
$ (3,559)
|
$ (4,765)
|
$ (5,444)
|
| X |
- DefinitionAmount of lease cost recognized by lessee for lease contract. Reference 1: http://www.xbrl.org/2003/role/exampleRef
-Topic 842
-SubTopic 20
-Name Accounting Standards Codification
-Section 55
-Paragraph 53
-Publisher FASB
-URI https://asc.fasb.org/1943274/2147479589/842-20-55-53
Reference 2: http://www.xbrl.org/2003/role/disclosureRef
-Topic 842
-SubTopic 20
-Name Accounting Standards Codification
-Section 50
-Paragraph 4
-Publisher FASB
-URI https://asc.fasb.org/1943274/2147478964/842-20-50-4
| Name: |
us-gaap_LeaseCost |
| Namespace Prefix: |
us-gaap_ |
| Data Type: |
xbrli:monetaryItemType |
| Balance Type: |
debit |
| Period Type: |
duration |
|
| X |
- DefinitionLine items represent financial concepts included in a table. These concepts are used to disclose reportable information associated with domain members defined in one or many axes to the table. Reference 1: http://www.xbrl.org/2003/role/disclosureRef
-Topic 842
-SubTopic 20
-Name Accounting Standards Codification
-Section 50
-Paragraph 7A
-Subparagraph (c)
-Publisher FASB
-URI https://asc.fasb.org/1943274/2147478964/842-20-50-7A
Reference 2: http://www.xbrl.org/2003/role/disclosureRef
-Topic 842
-SubTopic 20
-Name Accounting Standards Codification
-Section 50
-Paragraph 3
-Publisher FASB
-URI https://asc.fasb.org/1943274/2147478964/842-20-50-3
| Name: |
us-gaap_LesseeLeaseDescriptionLineItems |
| Namespace Prefix: |
us-gaap_ |
| Data Type: |
xbrli:stringItemType |
| Balance Type: |
na |
| Period Type: |
duration |
|
| X |
- DefinitionAmount of single lease cost, calculated by allocation of remaining cost of lease over remaining lease term. Includes, but is not limited to, single lease cost, after impairment of right-of-use asset, calculated by amortization of remaining right-of-use asset and accretion of lease liability. Reference 1: http://www.xbrl.org/2003/role/exampleRef
-Topic 842
-SubTopic 20
-Name Accounting Standards Codification
-Section 55
-Paragraph 53
-Publisher FASB
-URI https://asc.fasb.org/1943274/2147479589/842-20-55-53
Reference 2: http://www.xbrl.org/2003/role/disclosureRef
-Topic 842
-SubTopic 20
-Name Accounting Standards Codification
-Section 50
-Paragraph 4
-Subparagraph (b)
-Publisher FASB
-URI https://asc.fasb.org/1943274/2147478964/842-20-50-4
| Name: |
us-gaap_OperatingLeaseCost |
| Namespace Prefix: |
us-gaap_ |
| Data Type: |
xbrli:monetaryItemType |
| Balance Type: |
debit |
| Period Type: |
duration |
|
| X |
- DefinitionAmount of short-term lease cost, excluding expense for lease with term of one month or less. Reference 1: http://www.xbrl.org/2003/role/exampleRef
-Topic 842
-SubTopic 20
-Name Accounting Standards Codification
-Section 55
-Paragraph 53
-Publisher FASB
-URI https://asc.fasb.org/1943274/2147479589/842-20-55-53
Reference 2: http://www.xbrl.org/2003/role/disclosureRef
-Topic 842
-SubTopic 20
-Name Accounting Standards Codification
-Section 50
-Paragraph 4
-Subparagraph (c)
-Publisher FASB
-URI https://asc.fasb.org/1943274/2147478964/842-20-50-4
| Name: |
us-gaap_ShortTermLeaseCost |
| Namespace Prefix: |
us-gaap_ |
| Data Type: |
xbrli:monetaryItemType |
| Balance Type: |
debit |
| Period Type: |
duration |
|
| X |
- DefinitionAmount of sublease income excluding finance and operating lease expense. Reference 1: http://www.xbrl.org/2003/role/exampleRef
-Topic 842
-SubTopic 20
-Name Accounting Standards Codification
-Section 55
-Paragraph 53
-Publisher FASB
-URI https://asc.fasb.org/1943274/2147479589/842-20-55-53
Reference 2: http://www.xbrl.org/2003/role/disclosureRef
-Topic 842
-SubTopic 20
-Name Accounting Standards Codification
-Section 50
-Paragraph 4
-Subparagraph (e)
-Publisher FASB
-URI https://asc.fasb.org/1943274/2147478964/842-20-50-4
| Name: |
us-gaap_SubleaseIncome |
| Namespace Prefix: |
us-gaap_ |
| Data Type: |
xbrli:monetaryItemType |
| Balance Type: |
credit |
| Period Type: |
duration |
|
| X |
- DefinitionAmount of variable lease cost, excluded from lease liability, recognized when obligation for payment is incurred for finance and operating leases. Reference 1: http://www.xbrl.org/2003/role/exampleRef
-Topic 842
-SubTopic 20
-Name Accounting Standards Codification
-Section 55
-Paragraph 53
-Publisher FASB
-URI https://asc.fasb.org/1943274/2147479589/842-20-55-53
Reference 2: http://www.xbrl.org/2003/role/disclosureRef
-Topic 842
-SubTopic 20
-Name Accounting Standards Codification
-Section 50
-Paragraph 4
-Subparagraph (d)
-Publisher FASB
-URI https://asc.fasb.org/1943274/2147478964/842-20-50-4
| Name: |
us-gaap_VariableLeaseCost |
| Namespace Prefix: |
us-gaap_ |
| Data Type: |
xbrli:monetaryItemType |
| Balance Type: |
debit |
| Period Type: |
duration |
|
| X |
- Details
| Name: |
us-gaap_IncomeStatementLocationAxis=us-gaap_SellingGeneralAndAdministrativeExpensesMember |
| Namespace Prefix: |
|
| Data Type: |
na |
| Balance Type: |
|
| Period Type: |
|
|
| X |
- Details
| Name: |
us-gaap_IncomeStatementLocationAxis=us-gaap_OtherOperatingIncomeExpenseMember |
| Namespace Prefix: |
|
| Data Type: |
na |
| Balance Type: |
|
| Period Type: |
|
|
| X |
- Details
| Name: |
us-gaap_IncomeStatementLocationAxis=us-gaap_GeneralAndAdministrativeExpenseMember |
| Namespace Prefix: |
|
| Data Type: |
na |
| Balance Type: |
|
| Period Type: |
|
|
v3.25.0.1
Leases - Schedule of Supplemental Cash Flow Related to Leases (Details) - USD ($)
$ in Thousands |
12 Months Ended |
Dec. 31, 2024 |
Dec. 31, 2023 |
Dec. 31, 2022 |
| Leases [Abstract] |
|
|
|
| Cash paid for operating lease liabilities |
$ 466,171
|
$ 421,591
|
$ 386,238
|
| Operating lease assets obtained in exchange for operating lease liabilities |
692,684
|
521,759
|
425,243
|
| Derecognition of operating lease assets due to terminations or impairment |
$ 6,899
|
$ 6,862
|
$ 14,718
|
| X |
- References
+ Details
| Name: |
us-gaap_LeasesAbstract |
| Namespace Prefix: |
us-gaap_ |
| Data Type: |
xbrli:stringItemType |
| Balance Type: |
na |
| Period Type: |
duration |
|
| X |
- DefinitionAmount of loss from impairment of right-of-use asset from operating lease. Reference 1: http://www.xbrl.org/2009/role/commonPracticeRef
-Topic 842
-SubTopic 20
-Name Accounting Standards Codification
-Section 25
-Paragraph 6
-Subparagraph (c)
-Publisher FASB
-URI https://asc.fasb.org/1943274/2147479365/842-20-25-6
| Name: |
us-gaap_OperatingLeaseImpairmentLoss |
| Namespace Prefix: |
us-gaap_ |
| Data Type: |
xbrli:monetaryItemType |
| Balance Type: |
debit |
| Period Type: |
duration |
|
| X |
- DefinitionAmount of cash outflow from operating lease, excluding payments to bring another asset to condition and location necessary for its intended use. Reference 1: http://www.xbrl.org/2003/role/disclosureRef
-Topic 842
-SubTopic 20
-Name Accounting Standards Codification
-Section 45
-Paragraph 5
-Subparagraph (c)
-Publisher FASB
-URI https://asc.fasb.org/1943274/2147479041/842-20-45-5
Reference 2: http://www.xbrl.org/2003/role/disclosureRef
-Topic 842
-SubTopic 20
-Name Accounting Standards Codification
-Section 50
-Paragraph 4
-Subparagraph (g)(1)
-Publisher FASB
-URI https://asc.fasb.org/1943274/2147478964/842-20-50-4
| Name: |
us-gaap_OperatingLeasePayments |
| Namespace Prefix: |
us-gaap_ |
| Data Type: |
xbrli:monetaryItemType |
| Balance Type: |
credit |
| Period Type: |
duration |
|
| X |
- DefinitionAmount of increase in right-of-use asset obtained in exchange for operating lease liability. Reference 1: http://www.xbrl.org/2003/role/exampleRef
-Topic 842
-SubTopic 20
-Name Accounting Standards Codification
-Section 55
-Paragraph 53
-Publisher FASB
-URI https://asc.fasb.org/1943274/2147479589/842-20-55-53
Reference 2: http://www.xbrl.org/2003/role/disclosureRef
-Topic 842
-SubTopic 20
-Name Accounting Standards Codification
-Section 50
-Paragraph 4
-Subparagraph (g)(2)
-Publisher FASB
-URI https://asc.fasb.org/1943274/2147478964/842-20-50-4
| Name: |
us-gaap_RightOfUseAssetObtainedInExchangeForOperatingLeaseLiability |
| Namespace Prefix: |
us-gaap_ |
| Data Type: |
xbrli:monetaryItemType |
| Balance Type: |
debit |
| Period Type: |
duration |
|
v3.25.0.1
Leases - Schedule of Maturity of Lease Liabilities (Details)
$ in Thousands |
Dec. 31, 2024
USD ($)
|
| Leases [Abstract] |
|
| 2025 |
$ 464,795
|
| 2026 |
507,341
|
| 2027 |
499,428
|
| 2028 |
484,473
|
| 2029 |
467,981
|
| Thereafter |
4,133,853
|
| Total lease payments |
6,557,871
|
| Less: imputed interest |
2,017,253
|
| Operating lease liabilities (Current and Long-Term) |
$ 4,540,618
|
| X |
- References
+ Details
| Name: |
us-gaap_LeasesAbstract |
| Namespace Prefix: |
us-gaap_ |
| Data Type: |
xbrli:stringItemType |
| Balance Type: |
na |
| Period Type: |
duration |
|
| X |
- DefinitionAmount of lessee's undiscounted obligation for lease payment for operating lease. Reference 1: http://www.xbrl.org/2003/role/disclosureRef
-Topic 842
-SubTopic 20
-Name Accounting Standards Codification
-Section 50
-Paragraph 6
-Publisher FASB
-URI https://asc.fasb.org/1943274/2147478964/842-20-50-6
| Name: |
us-gaap_LesseeOperatingLeaseLiabilityPaymentsDue |
| Namespace Prefix: |
us-gaap_ |
| Data Type: |
xbrli:monetaryItemType |
| Balance Type: |
credit |
| Period Type: |
instant |
|
| X |
- DefinitionAmount of lessee's undiscounted obligation for lease payment for operating lease due after fifth fiscal year following current fiscal year. Excludes interim and annual periods when interim periods are reported from current statement of financial position date (rolling approach). Reference 1: http://www.xbrl.org/2003/role/disclosureRef
-Topic 842
-SubTopic 20
-Name Accounting Standards Codification
-Section 50
-Paragraph 6
-Publisher FASB
-URI https://asc.fasb.org/1943274/2147478964/842-20-50-6
| Name: |
us-gaap_LesseeOperatingLeaseLiabilityPaymentsDueAfterYearFive |
| Namespace Prefix: |
us-gaap_ |
| Data Type: |
xbrli:monetaryItemType |
| Balance Type: |
credit |
| Period Type: |
instant |
|
| X |
- DefinitionAmount of lessee's undiscounted obligation for lease payment for operating lease to be paid in next fiscal year following current fiscal year. Excludes interim and annual periods when interim periods are reported from current statement of financial position date (rolling approach). Reference 1: http://www.xbrl.org/2003/role/disclosureRef
-Topic 842
-SubTopic 20
-Name Accounting Standards Codification
-Section 50
-Paragraph 6
-Publisher FASB
-URI https://asc.fasb.org/1943274/2147478964/842-20-50-6
| Name: |
us-gaap_LesseeOperatingLeaseLiabilityPaymentsDueNextTwelveMonths |
| Namespace Prefix: |
us-gaap_ |
| Data Type: |
xbrli:monetaryItemType |
| Balance Type: |
credit |
| Period Type: |
instant |
|
| X |
- DefinitionAmount of lessee's undiscounted obligation for lease payment for operating lease to be paid in fifth fiscal year following current fiscal year. Excludes interim and annual periods when interim periods are reported from current statement of financial position date (rolling approach). Reference 1: http://www.xbrl.org/2003/role/disclosureRef
-Topic 842
-SubTopic 20
-Name Accounting Standards Codification
-Section 50
-Paragraph 6
-Publisher FASB
-URI https://asc.fasb.org/1943274/2147478964/842-20-50-6
| Name: |
us-gaap_LesseeOperatingLeaseLiabilityPaymentsDueYearFive |
| Namespace Prefix: |
us-gaap_ |
| Data Type: |
xbrli:monetaryItemType |
| Balance Type: |
credit |
| Period Type: |
instant |
|
| X |
- DefinitionAmount of lessee's undiscounted obligation for lease payment for operating lease to be paid in fourth fiscal year following current fiscal year. Excludes interim and annual periods when interim periods are reported from current statement of financial position date (rolling approach). Reference 1: http://www.xbrl.org/2003/role/disclosureRef
-Topic 842
-SubTopic 20
-Name Accounting Standards Codification
-Section 50
-Paragraph 6
-Publisher FASB
-URI https://asc.fasb.org/1943274/2147478964/842-20-50-6
| Name: |
us-gaap_LesseeOperatingLeaseLiabilityPaymentsDueYearFour |
| Namespace Prefix: |
us-gaap_ |
| Data Type: |
xbrli:monetaryItemType |
| Balance Type: |
credit |
| Period Type: |
instant |
|
| X |
- DefinitionAmount of lessee's undiscounted obligation for lease payment for operating lease to be paid in third fiscal year following current fiscal year. Excludes interim and annual periods when interim periods are reported from current statement of financial position date (rolling approach). Reference 1: http://www.xbrl.org/2003/role/disclosureRef
-Topic 842
-SubTopic 20
-Name Accounting Standards Codification
-Section 50
-Paragraph 6
-Publisher FASB
-URI https://asc.fasb.org/1943274/2147478964/842-20-50-6
| Name: |
us-gaap_LesseeOperatingLeaseLiabilityPaymentsDueYearThree |
| Namespace Prefix: |
us-gaap_ |
| Data Type: |
xbrli:monetaryItemType |
| Balance Type: |
credit |
| Period Type: |
instant |
|
| X |
- DefinitionAmount of lessee's undiscounted obligation for lease payment for operating lease to be paid in second fiscal year following current fiscal year. Excludes interim and annual periods when interim periods are reported from current statement of financial position date (rolling approach). Reference 1: http://www.xbrl.org/2003/role/disclosureRef
-Topic 842
-SubTopic 20
-Name Accounting Standards Codification
-Section 50
-Paragraph 6
-Publisher FASB
-URI https://asc.fasb.org/1943274/2147478964/842-20-50-6
| Name: |
us-gaap_LesseeOperatingLeaseLiabilityPaymentsDueYearTwo |
| Namespace Prefix: |
us-gaap_ |
| Data Type: |
xbrli:monetaryItemType |
| Balance Type: |
credit |
| Period Type: |
instant |
|
| X |
- DefinitionAmount of lessee's undiscounted obligation for lease payments in excess of discounted obligation for lease payments for operating lease. Reference 1: http://www.xbrl.org/2003/role/disclosureRef
-Topic 842
-SubTopic 20
-Name Accounting Standards Codification
-Section 50
-Paragraph 6
-Publisher FASB
-URI https://asc.fasb.org/1943274/2147478964/842-20-50-6
| Name: |
us-gaap_LesseeOperatingLeaseLiabilityUndiscountedExcessAmount |
| Namespace Prefix: |
us-gaap_ |
| Data Type: |
xbrli:monetaryItemType |
| Balance Type: |
credit |
| Period Type: |
instant |
|
| X |
- DefinitionPresent value of lessee's discounted obligation for lease payments from operating lease. Reference 1: http://www.xbrl.org/2003/role/disclosureRef
-Topic 842
-SubTopic 20
-Name Accounting Standards Codification
-Section 45
-Paragraph 1
-Subparagraph (b)
-Publisher FASB
-URI https://asc.fasb.org/1943274/2147479041/842-20-45-1
| Name: |
us-gaap_OperatingLeaseLiability |
| Namespace Prefix: |
us-gaap_ |
| Data Type: |
xbrli:monetaryItemType |
| Balance Type: |
credit |
| Period Type: |
instant |
|
v3.25.0.1
Leases - Narrative (Details)
$ in Thousands |
12 Months Ended |
|
Dec. 31, 2024
USD ($)
|
|---|
| Lessee, Lease, Description [Line Items] |
|
| Operating lease payments related to options to extend lease terms |
$ 2,759,141
|
| Future sublease income |
11,419
|
| Operating Lease, Lease Not yet Commenced |
|
| Lessee, Lease, Description [Line Items] |
|
| Operating lease payments not yet commenced |
$ 646,462
|
| X |
- DefinitionLessee, Operating Future Sublease Income
| Name: |
cmg_LesseeOperatingFutureSubleaseIncome |
| Namespace Prefix: |
cmg_ |
| Data Type: |
xbrli:monetaryItemType |
| Balance Type: |
credit |
| Period Type: |
duration |
|
| X |
- DefinitionLine items represent financial concepts included in a table. These concepts are used to disclose reportable information associated with domain members defined in one or many axes to the table. Reference 1: http://www.xbrl.org/2003/role/disclosureRef
-Topic 842
-SubTopic 20
-Name Accounting Standards Codification
-Section 50
-Paragraph 7A
-Subparagraph (c)
-Publisher FASB
-URI https://asc.fasb.org/1943274/2147478964/842-20-50-7A
Reference 2: http://www.xbrl.org/2003/role/disclosureRef
-Topic 842
-SubTopic 20
-Name Accounting Standards Codification
-Section 50
-Paragraph 3
-Publisher FASB
-URI https://asc.fasb.org/1943274/2147478964/842-20-50-3
| Name: |
us-gaap_LesseeLeaseDescriptionLineItems |
| Namespace Prefix: |
us-gaap_ |
| Data Type: |
xbrli:stringItemType |
| Balance Type: |
na |
| Period Type: |
duration |
|
| X |
- DefinitionAmount of unrecorded obligation to transfer funds in future for fixed or minimum amount or quantity of product and service at fixed or minimum price. Includes, but is not limited to, lease not yet commenced and take-or-pay and throughput contracts. Reference 1: http://www.xbrl.org/2003/role/disclosureRef
-Topic 440
-SubTopic 10
-Name Accounting Standards Codification
-Section 50
-Paragraph 4
-Subparagraph (b)
-Publisher FASB
-URI https://asc.fasb.org/1943274/2147482648/440-10-50-4
Reference 2: http://www.xbrl.org/2009/role/commonPracticeRef
-Topic 842
-SubTopic 20
-Name Accounting Standards Codification
-Section 50
-Paragraph 3
-Subparagraph (b)
-Publisher FASB
-URI https://asc.fasb.org/1943274/2147478964/842-20-50-3
| Name: |
us-gaap_UnrecordedUnconditionalPurchaseObligationBalanceSheetAmount |
| Namespace Prefix: |
us-gaap_ |
| Data Type: |
xbrli:monetaryItemType |
| Balance Type: |
credit |
| Period Type: |
instant |
|
| X |
- Details
| Name: |
us-gaap_UnrecordedUnconditionalPurchaseObligationByCategoryOfItemPurchasedAxis=us-gaap_OperatingLeaseLeaseNotYetCommencedMember |
| Namespace Prefix: |
|
| Data Type: |
na |
| Balance Type: |
|
| Period Type: |
|
|
v3.25.0.1
Earnings Per Share - Basic and Diluted Earnings per Share (Details) - USD ($)
$ / shares in Units, shares in Thousands, $ in Thousands |
12 Months Ended |
Dec. 31, 2024 |
Dec. 31, 2023 |
Dec. 31, 2022 |
| Earnings Per Share [Abstract] |
|
|
|
| Net income |
$ 1,534,110
|
$ 1,228,737
|
$ 899,101
|
| Weighted-average number of common shares outstanding (for basic calculation) (in shares) |
1,368,343
|
1,377,768
|
1,392,543
|
| Dilutive stock awards |
8,212
|
7,732
|
10,534
|
| Weighted-average number of common shares outstanding (for diluted calculation) (in shares) |
1,376,555
|
1,385,500
|
1,403,077
|
| Basic earnings per share (in usd per share) |
$ 1.12
|
$ 0.89
|
$ 0.65
|
| Diluted earnings per share (in usd per share) |
$ 1.11
|
$ 0.89
|
$ 0.64
|
| X |
- References
+ Details
| Name: |
us-gaap_EarningsPerShareAbstract |
| Namespace Prefix: |
us-gaap_ |
| Data Type: |
xbrli:stringItemType |
| Balance Type: |
na |
| Period Type: |
duration |
|
| X |
- DefinitionThe amount of net income (loss) for the period per each share of common stock or unit outstanding during the reporting period. Reference 1: http://www.xbrl.org/2003/role/disclosureRef
-Topic 250
-SubTopic 10
-Name Accounting Standards Codification
-Section 50
-Paragraph 6
-Publisher FASB
-URI https://asc.fasb.org/1943274/2147483443/250-10-50-6
Reference 2: http://www.xbrl.org/2003/role/exampleRef
-Topic 260
-SubTopic 10
-Name Accounting Standards Codification
-Section 55
-Paragraph 52
-Publisher FASB
-URI https://asc.fasb.org/1943274/2147482635/260-10-55-52
Reference 3: http://www.xbrl.org/2003/role/disclosureRef
-Topic 805
-SubTopic 60
-Name Accounting Standards Codification
-Section 65
-Paragraph 1
-Subparagraph (g)
-Publisher FASB
-URI https://asc.fasb.org/1943274/2147476176/805-60-65-1
Reference 4: http://www.xbrl.org/2003/role/disclosureRef
-Topic 740
-SubTopic 323
-Name Accounting Standards Codification
-Section 65
-Paragraph 2
-Subparagraph (g)(3)
-Publisher FASB
-URI https://asc.fasb.org/1943274/2147478666/740-323-65-2
Reference 5: http://www.xbrl.org/2003/role/disclosureRef
-Topic 250
-SubTopic 10
-Name Accounting Standards Codification
-Section 50
-Paragraph 3
-Publisher FASB
-URI https://asc.fasb.org/1943274/2147483443/250-10-50-3
Reference 6: http://www.xbrl.org/2003/role/disclosureRef
-Topic 260
-SubTopic 10
-Name Accounting Standards Codification
-Section 55
-Paragraph 15
-Publisher FASB
-URI https://asc.fasb.org/1943274/2147482635/260-10-55-15
Reference 7: http://www.xbrl.org/2003/role/disclosureRef
-Topic 815
-SubTopic 40
-Name Accounting Standards Codification
-Section 65
-Paragraph 1
-Subparagraph (e)(4)
-Publisher FASB
-URI https://asc.fasb.org/1943274/2147480175/815-40-65-1
Reference 8: http://www.xbrl.org/2003/role/disclosureRef
-Topic 815
-SubTopic 40
-Name Accounting Standards Codification
-Section 65
-Paragraph 1
-Subparagraph (f)
-Publisher FASB
-URI https://asc.fasb.org/1943274/2147480175/815-40-65-1
Reference 9: http://www.xbrl.org/2003/role/disclosureRef
-Topic 250
-SubTopic 10
-Name Accounting Standards Codification
-Section 50
-Paragraph 11
-Subparagraph (a)
-Publisher FASB
-URI https://asc.fasb.org/1943274/2147483443/250-10-50-11
Reference 10: http://www.xbrl.org/2003/role/disclosureRef
-Topic 250
-SubTopic 10
-Name Accounting Standards Codification
-Section 50
-Paragraph 11
-Subparagraph (b)
-Publisher FASB
-URI https://asc.fasb.org/1943274/2147483443/250-10-50-11
Reference 11: http://www.xbrl.org/2003/role/disclosureRef
-Topic 250
-SubTopic 10
-Name Accounting Standards Codification
-Section 50
-Paragraph 7
-Subparagraph (a)
-Publisher FASB
-URI https://asc.fasb.org/1943274/2147483443/250-10-50-7
Reference 12: http://www.xbrl.org/2003/role/disclosureRef
-Topic 260
-SubTopic 10
-Name Accounting Standards Codification
-Section 45
-Paragraph 2
-Publisher FASB
-URI https://asc.fasb.org/1943274/2147482689/260-10-45-2
Reference 13: http://www.xbrl.org/2003/role/disclosureRef
-Topic 260
-SubTopic 10
-Name Accounting Standards Codification
-Section 45
-Paragraph 60B
-Subparagraph (d)
-Publisher FASB
-URI https://asc.fasb.org/1943274/2147482689/260-10-45-60B
Reference 14: http://www.xbrl.org/2003/role/disclosureRef
-Topic 250
-SubTopic 10
-Name Accounting Standards Codification
-Section 50
-Paragraph 4
-Publisher FASB
-URI https://asc.fasb.org/1943274/2147483443/250-10-50-4
Reference 15: http://www.xbrl.org/2003/role/disclosureRef
-Topic 260
-SubTopic 10
-Name Accounting Standards Codification
-Section 50
-Paragraph 1
-Subparagraph (a)
-Publisher FASB
-URI https://asc.fasb.org/1943274/2147482662/260-10-50-1
Reference 16: http://www.xbrl.org/2003/role/disclosureRef
-Topic 260
-SubTopic 10
-Name Accounting Standards Codification
-Section 45
-Paragraph 10
-Publisher FASB
-URI https://asc.fasb.org/1943274/2147482689/260-10-45-10
Reference 17: http://www.xbrl.org/2003/role/disclosureRef
-Topic 220
-SubTopic 10
-Name Accounting Standards Codification
-Section S99
-Paragraph 2
-Subparagraph (SX 210.5-03(25))
-Publisher FASB
-URI https://asc.fasb.org/1943274/2147483621/220-10-S99-2
Reference 18: http://www.xbrl.org/2003/role/disclosureRef
-Topic 942
-SubTopic 220
-Name Accounting Standards Codification
-Section S99
-Paragraph 1
-Subparagraph (SX 210.9-04(27))
-Publisher FASB
-URI https://asc.fasb.org/1943274/2147478524/942-220-S99-1
Reference 19: http://www.xbrl.org/2003/role/disclosureRef
-Topic 944
-SubTopic 220
-Name Accounting Standards Codification
-Section S99
-Paragraph 1
-Subparagraph (SX 210.7-04(23))
-Publisher FASB
-URI https://asc.fasb.org/1943274/2147477250/944-220-S99-1
Reference 20: http://www.xbrl.org/2003/role/disclosureRef
-Topic 260
-SubTopic 10
-Name Accounting Standards Codification
-Section 45
-Paragraph 7
-Publisher FASB
-URI https://asc.fasb.org/1943274/2147482689/260-10-45-7
| Name: |
us-gaap_EarningsPerShareBasic |
| Namespace Prefix: |
us-gaap_ |
| Data Type: |
dtr-types:perShareItemType |
| Balance Type: |
na |
| Period Type: |
duration |
|
| X |
- DefinitionThe amount of net income (loss) for the period available to each share of common stock or common unit outstanding during the reporting period and to each share or unit that would have been outstanding assuming the issuance of common shares or units for all dilutive potential common shares or units outstanding during the reporting period. Reference 1: http://www.xbrl.org/2003/role/disclosureRef
-Topic 250
-SubTopic 10
-Name Accounting Standards Codification
-Section 50
-Paragraph 6
-Publisher FASB
-URI https://asc.fasb.org/1943274/2147483443/250-10-50-6
Reference 2: http://www.xbrl.org/2003/role/exampleRef
-Topic 260
-SubTopic 10
-Name Accounting Standards Codification
-Section 55
-Paragraph 52
-Publisher FASB
-URI https://asc.fasb.org/1943274/2147482635/260-10-55-52
Reference 3: http://www.xbrl.org/2003/role/disclosureRef
-Topic 805
-SubTopic 60
-Name Accounting Standards Codification
-Section 65
-Paragraph 1
-Subparagraph (g)
-Publisher FASB
-URI https://asc.fasb.org/1943274/2147476176/805-60-65-1
Reference 4: http://www.xbrl.org/2003/role/disclosureRef
-Topic 740
-SubTopic 323
-Name Accounting Standards Codification
-Section 65
-Paragraph 2
-Subparagraph (g)(3)
-Publisher FASB
-URI https://asc.fasb.org/1943274/2147478666/740-323-65-2
Reference 5: http://www.xbrl.org/2003/role/disclosureRef
-Topic 250
-SubTopic 10
-Name Accounting Standards Codification
-Section 50
-Paragraph 3
-Publisher FASB
-URI https://asc.fasb.org/1943274/2147483443/250-10-50-3
Reference 6: http://www.xbrl.org/2003/role/disclosureRef
-Topic 260
-SubTopic 10
-Name Accounting Standards Codification
-Section 55
-Paragraph 15
-Publisher FASB
-URI https://asc.fasb.org/1943274/2147482635/260-10-55-15
Reference 7: http://www.xbrl.org/2003/role/disclosureRef
-Topic 815
-SubTopic 40
-Name Accounting Standards Codification
-Section 65
-Paragraph 1
-Subparagraph (e)(4)
-Publisher FASB
-URI https://asc.fasb.org/1943274/2147480175/815-40-65-1
Reference 8: http://www.xbrl.org/2003/role/disclosureRef
-Topic 815
-SubTopic 40
-Name Accounting Standards Codification
-Section 65
-Paragraph 1
-Subparagraph (f)
-Publisher FASB
-URI https://asc.fasb.org/1943274/2147480175/815-40-65-1
Reference 9: http://www.xbrl.org/2003/role/disclosureRef
-Topic 250
-SubTopic 10
-Name Accounting Standards Codification
-Section 50
-Paragraph 11
-Subparagraph (a)
-Publisher FASB
-URI https://asc.fasb.org/1943274/2147483443/250-10-50-11
Reference 10: http://www.xbrl.org/2003/role/disclosureRef
-Topic 250
-SubTopic 10
-Name Accounting Standards Codification
-Section 50
-Paragraph 11
-Subparagraph (b)
-Publisher FASB
-URI https://asc.fasb.org/1943274/2147483443/250-10-50-11
Reference 11: http://www.xbrl.org/2003/role/disclosureRef
-Topic 250
-SubTopic 10
-Name Accounting Standards Codification
-Section 50
-Paragraph 7
-Subparagraph (a)
-Publisher FASB
-URI https://asc.fasb.org/1943274/2147483443/250-10-50-7
Reference 12: http://www.xbrl.org/2003/role/disclosureRef
-Topic 260
-SubTopic 10
-Name Accounting Standards Codification
-Section 45
-Paragraph 2
-Publisher FASB
-URI https://asc.fasb.org/1943274/2147482689/260-10-45-2
Reference 13: http://www.xbrl.org/2003/role/disclosureRef
-Topic 260
-SubTopic 10
-Name Accounting Standards Codification
-Section 45
-Paragraph 60B
-Subparagraph (d)
-Publisher FASB
-URI https://asc.fasb.org/1943274/2147482689/260-10-45-60B
Reference 14: http://www.xbrl.org/2003/role/disclosureRef
-Topic 250
-SubTopic 10
-Name Accounting Standards Codification
-Section 50
-Paragraph 4
-Publisher FASB
-URI https://asc.fasb.org/1943274/2147483443/250-10-50-4
Reference 15: http://www.xbrl.org/2003/role/disclosureRef
-Topic 260
-SubTopic 10
-Name Accounting Standards Codification
-Section 50
-Paragraph 1
-Subparagraph (a)
-Publisher FASB
-URI https://asc.fasb.org/1943274/2147482662/260-10-50-1
Reference 16: http://www.xbrl.org/2003/role/disclosureRef
-Topic 220
-SubTopic 10
-Name Accounting Standards Codification
-Section S99
-Paragraph 2
-Subparagraph (SX 210.5-03(25))
-Publisher FASB
-URI https://asc.fasb.org/1943274/2147483621/220-10-S99-2
Reference 17: http://www.xbrl.org/2003/role/disclosureRef
-Topic 942
-SubTopic 220
-Name Accounting Standards Codification
-Section S99
-Paragraph 1
-Subparagraph (SX 210.9-04(27))
-Publisher FASB
-URI https://asc.fasb.org/1943274/2147478524/942-220-S99-1
Reference 18: http://www.xbrl.org/2003/role/disclosureRef
-Topic 944
-SubTopic 220
-Name Accounting Standards Codification
-Section S99
-Paragraph 1
-Subparagraph (SX 210.7-04(23))
-Publisher FASB
-URI https://asc.fasb.org/1943274/2147477250/944-220-S99-1
Reference 19: http://www.xbrl.org/2003/role/disclosureRef
-Topic 260
-SubTopic 10
-Name Accounting Standards Codification
-Section 45
-Paragraph 7
-Publisher FASB
-URI https://asc.fasb.org/1943274/2147482689/260-10-45-7
| Name: |
us-gaap_EarningsPerShareDiluted |
| Namespace Prefix: |
us-gaap_ |
| Data Type: |
dtr-types:perShareItemType |
| Balance Type: |
na |
| Period Type: |
duration |
|
| X |
- DefinitionAdditional shares included in the calculation of diluted EPS as a result of the potentially dilutive effect of share based payment arrangements using the treasury stock method. Reference 1: http://www.xbrl.org/2003/role/disclosureRef
-Topic 718
-SubTopic 10
-Name Accounting Standards Codification
-Section 45
-Paragraph 1
-Publisher FASB
-URI https://asc.fasb.org/1943274/2147480454/718-10-45-1
Reference 2: http://www.xbrl.org/2003/role/disclosureRef
-Topic 260
-SubTopic 10
-Name Accounting Standards Codification
-Section 50
-Paragraph 1
-Subparagraph (a)
-Publisher FASB
-URI https://asc.fasb.org/1943274/2147482662/260-10-50-1
Reference 3: http://www.xbrl.org/2003/role/disclosureRef
-Topic 260
-SubTopic 10
-Name Accounting Standards Codification
-Section 45
-Paragraph 22
-Publisher FASB
-URI https://asc.fasb.org/1943274/2147482689/260-10-45-22
Reference 4: http://www.xbrl.org/2003/role/disclosureRef
-Topic 260
-SubTopic 10
-Name Accounting Standards Codification
-Section 45
-Paragraph 23
-Subparagraph (c)
-Publisher FASB
-URI https://asc.fasb.org/1943274/2147482689/260-10-45-23
Reference 5: http://www.xbrl.org/2003/role/disclosureRef
-Topic 260
-SubTopic 10
-Name Accounting Standards Codification
-Section 45
-Paragraph 28A
-Publisher FASB
-URI https://asc.fasb.org/1943274/2147482689/260-10-45-28A
| Name: |
us-gaap_IncrementalCommonSharesAttributableToShareBasedPaymentArrangements |
| Namespace Prefix: |
us-gaap_ |
| Data Type: |
xbrli:sharesItemType |
| Balance Type: |
na |
| Period Type: |
duration |
|
| X |
- DefinitionThe portion of profit or loss for the period, net of income taxes, which is attributable to the parent. Reference 1: http://www.xbrl.org/2003/role/disclosureRef
-Topic 250
-SubTopic 10
-Name Accounting Standards Codification
-Section 50
-Paragraph 6
-Publisher FASB
-URI https://asc.fasb.org/1943274/2147483443/250-10-50-6
Reference 2: http://www.xbrl.org/2003/role/disclosureRef
-Topic 250
-SubTopic 10
-Name Accounting Standards Codification
-Section 50
-Paragraph 9
-Publisher FASB
-URI https://asc.fasb.org/1943274/2147483443/250-10-50-9
Reference 3: http://www.xbrl.org/2003/role/disclosureRef
-Topic 805
-SubTopic 60
-Name Accounting Standards Codification
-Section 65
-Paragraph 1
-Subparagraph (g)
-Publisher FASB
-URI https://asc.fasb.org/1943274/2147476176/805-60-65-1
Reference 4: http://www.xbrl.org/2003/role/disclosureRef
-Topic 740
-SubTopic 323
-Name Accounting Standards Codification
-Section 65
-Paragraph 2
-Subparagraph (g)(3)
-Publisher FASB
-URI https://asc.fasb.org/1943274/2147478666/740-323-65-2
Reference 5: http://fasb.org/us-gaap/role/ref/legacyRef
-Topic 220
-SubTopic 10
-Name Accounting Standards Codification
-Section S99
-Paragraph 2
-Subparagraph (SX 210.5-03(20))
-Publisher FASB
-URI https://asc.fasb.org/1943274/2147483621/220-10-S99-2
Reference 6: http://www.xbrl.org/2003/role/disclosureRef
-Topic 235
-SubTopic 10
-Name Accounting Standards Codification
-Section S99
-Paragraph 1
-Subparagraph (SX 210.4-08(g)(1)(ii))
-Publisher FASB
-URI https://asc.fasb.org/1943274/2147480678/235-10-S99-1
Reference 7: http://www.xbrl.org/2003/role/disclosureRef
-Topic 323
-SubTopic 10
-Name Accounting Standards Codification
-Section 50
-Paragraph 3
-Subparagraph (c)
-Publisher FASB
-URI https://asc.fasb.org/1943274/2147481687/323-10-50-3
Reference 8: http://www.xbrl.org/2003/role/disclosureRef
-Topic 825
-SubTopic 10
-Name Accounting Standards Codification
-Section 50
-Paragraph 28
-Subparagraph (f)
-Publisher FASB
-URI https://asc.fasb.org/1943274/2147482907/825-10-50-28
Reference 9: http://www.xbrl.org/2003/role/disclosureRef
-Topic 220
-SubTopic 10
-Name Accounting Standards Codification
-Section 50
-Paragraph 6
-Publisher FASB
-URI https://asc.fasb.org/1943274/2147482765/220-10-50-6
Reference 10: http://www.xbrl.org/2003/role/disclosureRef
-Topic 250
-SubTopic 10
-Name Accounting Standards Codification
-Section 50
-Paragraph 3
-Publisher FASB
-URI https://asc.fasb.org/1943274/2147483443/250-10-50-3
Reference 11: http://www.xbrl.org/2003/role/disclosureRef
-Topic 250
-SubTopic 10
-Name Accounting Standards Codification
-Section 50
-Paragraph 1
-Subparagraph (b)(2)
-Publisher FASB
-URI https://asc.fasb.org/1943274/2147483443/250-10-50-1
Reference 12: http://www.xbrl.org/2003/role/disclosureRef
-Topic 815
-SubTopic 40
-Name Accounting Standards Codification
-Section 65
-Paragraph 1
-Subparagraph (f)
-Publisher FASB
-URI https://asc.fasb.org/1943274/2147480175/815-40-65-1
Reference 13: http://www.xbrl.org/2003/role/disclosureRef
-Topic 250
-SubTopic 10
-Name Accounting Standards Codification
-Section 50
-Paragraph 8
-Publisher FASB
-URI https://asc.fasb.org/1943274/2147483443/250-10-50-8
Reference 14: http://www.xbrl.org/2003/role/disclosureRef
-Topic 250
-SubTopic 10
-Name Accounting Standards Codification
-Section 50
-Paragraph 11
-Subparagraph (a)
-Publisher FASB
-URI https://asc.fasb.org/1943274/2147483443/250-10-50-11
Reference 15: http://www.xbrl.org/2003/role/disclosureRef
-Topic 250
-SubTopic 10
-Name Accounting Standards Codification
-Section 50
-Paragraph 11
-Subparagraph (b)
-Publisher FASB
-URI https://asc.fasb.org/1943274/2147483443/250-10-50-11
Reference 16: http://www.xbrl.org/2003/role/disclosureRef
-Topic 250
-SubTopic 10
-Name Accounting Standards Codification
-Section 50
-Paragraph 4
-Publisher FASB
-URI https://asc.fasb.org/1943274/2147483443/250-10-50-4
Reference 17: http://www.xbrl.org/2003/role/exampleRef
-Topic 946
-SubTopic 830
-Name Accounting Standards Codification
-Section 55
-Paragraph 10
-Publisher FASB
-URI https://asc.fasb.org/1943274/2147479168/946-830-55-10
Reference 18: http://www.xbrl.org/2003/role/disclosureRef
-Topic 946
-SubTopic 220
-Name Accounting Standards Codification
-Section 45
-Paragraph 7
-Publisher FASB
-URI https://asc.fasb.org/1943274/2147479105/946-220-45-7
Reference 19: http://www.xbrl.org/2003/role/disclosureRef
-Topic 944
-SubTopic 220
-Name Accounting Standards Codification
-Section S99
-Paragraph 1
-Subparagraph (SX 210.7-04(18))
-Publisher FASB
-URI https://asc.fasb.org/1943274/2147477250/944-220-S99-1
Reference 20: http://www.xbrl.org/2003/role/disclosureRef
-Topic 946
-SubTopic 220
-Name Accounting Standards Codification
-Section S99
-Paragraph 1
-Subparagraph (SX 210.6-07(9))
-Publisher FASB
-URI https://asc.fasb.org/1943274/2147479134/946-220-S99-1
Reference 21: http://www.xbrl.org/2003/role/disclosureRef
-Topic 946
-SubTopic 220
-Name Accounting Standards Codification
-Section S99
-Paragraph 3
-Subparagraph (SX 210.6-09(1)(d))
-Publisher FASB
-URI https://asc.fasb.org/1943274/2147479134/946-220-S99-3
Reference 22: http://www.xbrl.org/2003/role/disclosureRef
-Topic 470
-SubTopic 10
-Name Accounting Standards Codification
-Section S99
-Paragraph 1A
-Subparagraph (SX 210.13-01(a)(4)(i))
-Publisher FASB
-URI https://asc.fasb.org/1943274/2147480097/470-10-S99-1A
Reference 23: http://www.xbrl.org/2009/role/commonPracticeRef
-Topic 470
-SubTopic 10
-Name Accounting Standards Codification
-Section S99
-Paragraph 1A
-Subparagraph (SX 210.13-01(a)(4)(ii))
-Publisher FASB
-URI https://asc.fasb.org/1943274/2147480097/470-10-S99-1A
Reference 24: http://www.xbrl.org/2003/role/disclosureRef
-Topic 470
-SubTopic 10
-Name Accounting Standards Codification
-Section S99
-Paragraph 1A
-Subparagraph (SX 210.13-01(a)(4)(iii)(A))
-Publisher FASB
-URI https://asc.fasb.org/1943274/2147480097/470-10-S99-1A
Reference 25: http://www.xbrl.org/2003/role/disclosureRef
-Topic 470
-SubTopic 10
-Name Accounting Standards Codification
-Section S99
-Paragraph 1A
-Subparagraph (SX 210.13-01(a)(4)(iv))
-Publisher FASB
-URI https://asc.fasb.org/1943274/2147480097/470-10-S99-1A
Reference 26: http://www.xbrl.org/2003/role/disclosureRef
-Topic 470
-SubTopic 10
-Name Accounting Standards Codification
-Section S99
-Paragraph 1A
-Subparagraph (SX 210.13-01(a)(5))
-Publisher FASB
-URI https://asc.fasb.org/1943274/2147480097/470-10-S99-1A
Reference 27: http://www.xbrl.org/2003/role/disclosureRef
-Topic 470
-SubTopic 10
-Name Accounting Standards Codification
-Section S99
-Paragraph 1B
-Subparagraph (SX 210.13-02(a)(4)(i))
-Publisher FASB
-URI https://asc.fasb.org/1943274/2147480097/470-10-S99-1B
Reference 28: http://www.xbrl.org/2003/role/disclosureRef
-Topic 470
-SubTopic 10
-Name Accounting Standards Codification
-Section S99
-Paragraph 1B
-Subparagraph (SX 210.13-02(a)(4)(iii)(A))
-Publisher FASB
-URI https://asc.fasb.org/1943274/2147480097/470-10-S99-1B
Reference 29: http://www.xbrl.org/2003/role/disclosureRef
-Topic 470
-SubTopic 10
-Name Accounting Standards Codification
-Section S99
-Paragraph 1B
-Subparagraph (SX 210.13-02(a)(4)(iii)(B))
-Publisher FASB
-URI https://asc.fasb.org/1943274/2147480097/470-10-S99-1B
Reference 30: http://www.xbrl.org/2003/role/disclosureRef
-Topic 470
-SubTopic 10
-Name Accounting Standards Codification
-Section S99
-Paragraph 1B
-Subparagraph (SX 210.13-02(a)(4)(iv))
-Publisher FASB
-URI https://asc.fasb.org/1943274/2147480097/470-10-S99-1B
Reference 31: http://www.xbrl.org/2003/role/disclosureRef
-Topic 470
-SubTopic 10
-Name Accounting Standards Codification
-Section S99
-Paragraph 1B
-Subparagraph (SX 210.13-02(a)(5))
-Publisher FASB
-URI https://asc.fasb.org/1943274/2147480097/470-10-S99-1B
Reference 32: http://www.xbrl.org/2003/role/disclosureRef
-Topic 260
-SubTopic 10
-Name Accounting Standards Codification
-Section 45
-Paragraph 60B
-Subparagraph (a)
-Publisher FASB
-URI https://asc.fasb.org/1943274/2147482689/260-10-45-60B
Reference 33: http://www.xbrl.org/2003/role/disclosureRef
-Topic 205
-SubTopic 20
-Name Accounting Standards Codification
-Section 50
-Paragraph 7
-Publisher FASB
-URI https://asc.fasb.org/1943274/2147483499/205-20-50-7
Reference 34: http://fasb.org/us-gaap/role/ref/legacyRef
-Topic 230
-SubTopic 10
-Name Accounting Standards Codification
-Section 45
-Paragraph 28
-Publisher FASB
-URI https://asc.fasb.org/1943274/2147482740/230-10-45-28
Reference 35: http://www.xbrl.org/2003/role/disclosureRef
-Topic 220
-SubTopic 10
-Name Accounting Standards Codification
-Section 45
-Paragraph 1A
-Subparagraph (a)
-Publisher FASB
-URI https://asc.fasb.org/1943274/2147482790/220-10-45-1A
Reference 36: http://www.xbrl.org/2003/role/disclosureRef
-Topic 220
-SubTopic 10
-Name Accounting Standards Codification
-Section 45
-Paragraph 1B
-Subparagraph (a)
-Publisher FASB
-URI https://asc.fasb.org/1943274/2147482790/220-10-45-1B
Reference 37: http://fasb.org/us-gaap/role/ref/legacyRef
-Topic 942
-SubTopic 220
-Name Accounting Standards Codification
-Section S99
-Paragraph 1
-Subparagraph (SX 210.9-04(22))
-Publisher FASB
-URI https://asc.fasb.org/1943274/2147478524/942-220-S99-1
| Name: |
us-gaap_NetIncomeLoss |
| Namespace Prefix: |
us-gaap_ |
| Data Type: |
xbrli:monetaryItemType |
| Balance Type: |
credit |
| Period Type: |
duration |
|
| X |
- DefinitionThe average number of shares or units issued and outstanding that are used in calculating diluted EPS or earnings per unit (EPU), determined based on the timing of issuance of shares or units in the period. Reference 1: http://www.xbrl.org/2003/role/disclosureRef
-Topic 260
-SubTopic 10
-Name Accounting Standards Codification
-Section 50
-Paragraph 1
-Subparagraph (a)
-Publisher FASB
-URI https://asc.fasb.org/1943274/2147482662/260-10-50-1
Reference 2: http://www.xbrl.org/2003/role/disclosureRef
-Topic 260
-SubTopic 10
-Name Accounting Standards Codification
-Section 45
-Paragraph 16
-Publisher FASB
-URI https://asc.fasb.org/1943274/2147482689/260-10-45-16
| Name: |
us-gaap_WeightedAverageNumberOfDilutedSharesOutstanding |
| Namespace Prefix: |
us-gaap_ |
| Data Type: |
xbrli:sharesItemType |
| Balance Type: |
na |
| Period Type: |
duration |
|
| X |
- DefinitionNumber of [basic] shares or units, after adjustment for contingently issuable shares or units and other shares or units not deemed outstanding, determined by relating the portion of time within a reporting period that common shares or units have been outstanding to the total time in that period. Reference 1: http://www.xbrl.org/2003/role/disclosureRef
-Topic 260
-SubTopic 10
-Name Accounting Standards Codification
-Section 50
-Paragraph 1
-Subparagraph (a)
-Publisher FASB
-URI https://asc.fasb.org/1943274/2147482662/260-10-50-1
Reference 2: http://www.xbrl.org/2003/role/disclosureRef
-Topic 260
-SubTopic 10
-Name Accounting Standards Codification
-Section 45
-Paragraph 10
-Publisher FASB
-URI https://asc.fasb.org/1943274/2147482689/260-10-45-10
| Name: |
us-gaap_WeightedAverageNumberOfSharesOutstandingBasic |
| Namespace Prefix: |
us-gaap_ |
| Data Type: |
xbrli:sharesItemType |
| Balance Type: |
na |
| Period Type: |
duration |
|
v3.25.0.1
Earnings Per Share - Stock Awards Excluded from the Calculation of Diluted EPS (Details) - shares
shares in Thousands |
12 Months Ended |
Dec. 31, 2024 |
Dec. 31, 2023 |
Dec. 31, 2022 |
| Earnings Per Share [Abstract] |
|
|
|
| Stock awards subject to performance conditions |
2,179
|
2,517
|
2,701
|
| Stock awards that were antidilutive |
2,210
|
3,565
|
8,149
|
| Total stock awards excluded from diluted earnings per share |
4,389
|
6,082
|
10,850
|
| X |
- DefinitionStock awards that were excluded from diluted earnings per share. For example, stock awards subject to performance conditions and stock awards that were antidilutive.
| Name: |
cmg_SharesExcludedFromDilutedEarningsPerShare |
| Namespace Prefix: |
cmg_ |
| Data Type: |
xbrli:sharesItemType |
| Balance Type: |
na |
| Period Type: |
duration |
|
| X |
- DefinitionSecurities (including those issuable pursuant to contingent stock agreements) that could potentially dilute basic earnings per share (EPS) or earnings per unit (EPU) in the future that were not included in the computation of diluted EPS or EPU because to do so would increase EPS or EPU amounts or decrease loss per share or unit amounts for the period presented. Reference 1: http://www.xbrl.org/2003/role/disclosureRef
-Topic 260
-SubTopic 10
-Name Accounting Standards Codification
-Section 50
-Paragraph 1
-Subparagraph (c)
-Publisher FASB
-URI https://asc.fasb.org/1943274/2147482662/260-10-50-1
| Name: |
us-gaap_AntidilutiveSecuritiesExcludedFromComputationOfEarningsPerShareAmount |
| Namespace Prefix: |
us-gaap_ |
| Data Type: |
xbrli:sharesItemType |
| Balance Type: |
na |
| Period Type: |
duration |
|
| X |
- References
+ Details
| Name: |
us-gaap_EarningsPerShareAbstract |
| Namespace Prefix: |
us-gaap_ |
| Data Type: |
xbrli:stringItemType |
| Balance Type: |
na |
| Period Type: |
duration |
|
v3.25.0.1
| X |
- References
+ Details
| Name: |
us-gaap_CommitmentsAndContingenciesDisclosureAbstract |
| Namespace Prefix: |
us-gaap_ |
| Data Type: |
xbrli:stringItemType |
| Balance Type: |
na |
| Period Type: |
duration |
|
| X |
- DefinitionAmount of loss contingency liability. Reference 1: http://www.xbrl.org/2003/role/disclosureRef
-Topic 450
-SubTopic 20
-Name Accounting Standards Codification
-Section 50
-Paragraph 1
-Publisher FASB
-URI https://asc.fasb.org/1943274/2147483076/450-20-50-1
Reference 2: http://www.xbrl.org/2003/role/recommendedDisclosureRef
-Topic 450
-SubTopic 20
-Name Accounting Standards Codification
-Section 50
-Paragraph 10
-Publisher FASB
-URI https://asc.fasb.org/1943274/2147483076/450-20-50-10
| Name: |
us-gaap_LossContingencyAccrualAtCarryingValue |
| Namespace Prefix: |
us-gaap_ |
| Data Type: |
xbrli:monetaryItemType |
| Balance Type: |
credit |
| Period Type: |
instant |
|
v3.25.0.1
| X |
- DefinitionFixed charge coverage ratio.
| Name: |
cmg_FixedChargeCoverageRatio |
| Namespace Prefix: |
cmg_ |
| Data Type: |
xbrli:pureItemType |
| Balance Type: |
na |
| Period Type: |
instant |
|
| X |
- DefinitionPercentage points added to the reference rate to compute the variable rate on the debt instrument.
| Name: |
us-gaap_DebtInstrumentBasisSpreadOnVariableRate1 |
| Namespace Prefix: |
us-gaap_ |
| Data Type: |
dtr-types:percentItemType |
| Balance Type: |
na |
| Period Type: |
duration |
|
| X |
- DefinitionThe fee, expressed as a percentage of the line of credit facility, for the line of credit facility regardless of whether the facility has been used.
| Name: |
us-gaap_LineOfCreditFacilityCommitmentFeePercentage |
| Namespace Prefix: |
us-gaap_ |
| Data Type: |
dtr-types:percentItemType |
| Balance Type: |
na |
| Period Type: |
duration |
|
| X |
- DefinitionLine items represent financial concepts included in a table. These concepts are used to disclose reportable information associated with domain members defined in one or many axes to the table. Reference 1: http://www.xbrl.org/2003/role/disclosureRef
-Topic 470
-SubTopic 10
-Name Accounting Standards Codification
-Section 50
-Paragraph 6
-Subparagraph (b)
-Publisher FASB
-URI https://asc.fasb.org/1943274/2147481544/470-10-50-6
Reference 2: http://www.xbrl.org/2009/role/commonPracticeRef
-Topic 470
-SubTopic 10
-Name Accounting Standards Codification
-Section 50
-Paragraph 6
-Subparagraph (a)
-Publisher FASB
-URI https://asc.fasb.org/1943274/2147481544/470-10-50-6
Reference 3: http://www.xbrl.org/2009/role/commonPracticeRef
-Topic 235
-SubTopic 10
-Name Accounting Standards Codification
-Section S99
-Paragraph 1
-Subparagraph (SX 210.4-08(f))
-Publisher FASB
-URI https://asc.fasb.org/1943274/2147480678/235-10-S99-1
| Name: |
us-gaap_LineOfCreditFacilityLineItems |
| Namespace Prefix: |
us-gaap_ |
| Data Type: |
xbrli:stringItemType |
| Balance Type: |
na |
| Period Type: |
duration |
|
| X |
- DefinitionMaximum borrowing capacity under the credit facility without consideration of any current restrictions on the amount that could be borrowed or the amounts currently outstanding under the facility. Reference 1: http://fasb.org/us-gaap/role/ref/legacyRef
-Topic 210
-SubTopic 10
-Name Accounting Standards Codification
-Section S99
-Paragraph 1
-Subparagraph (SX 210.5-02(22)(b))
-Publisher FASB
-URI https://asc.fasb.org/1943274/2147480566/210-10-S99-1
Reference 2: http://fasb.org/us-gaap/role/ref/legacyRef
-Topic 210
-SubTopic 10
-Name Accounting Standards Codification
-Section S99
-Paragraph 1
-Subparagraph (SX 210.5-02(19)(b))
-Publisher FASB
-URI https://asc.fasb.org/1943274/2147480566/210-10-S99-1
| Name: |
us-gaap_LineOfCreditFacilityMaximumBorrowingCapacity |
| Namespace Prefix: |
us-gaap_ |
| Data Type: |
xbrli:monetaryItemType |
| Balance Type: |
credit |
| Period Type: |
instant |
|
| X |
- Details
| Name: |
us-gaap_CreditFacilityAxis=us-gaap_RevolvingCreditFacilityMember |
| Namespace Prefix: |
|
| Data Type: |
na |
| Balance Type: |
|
| Period Type: |
|
|
| X |
- Details
| Name: |
us-gaap_LineOfCreditFacilityAxis=cmg_JPMorganChaseBankMember |
| Namespace Prefix: |
|
| Data Type: |
na |
| Balance Type: |
|
| Period Type: |
|
|
v3.25.0.1
| X |
- DefinitionThe percentage of ownership of common stock or equity participation in the investee accounted for under the equity method of accounting. Reference 1: http://www.xbrl.org/2003/role/disclosureRef
-Topic 323
-SubTopic 10
-Name Accounting Standards Codification
-Section 50
-Paragraph 3
-Subparagraph (a)(1)
-Publisher FASB
-URI https://asc.fasb.org/1943274/2147481687/323-10-50-3
| Name: |
us-gaap_EquityMethodInvestmentOwnershipPercentage |
| Namespace Prefix: |
us-gaap_ |
| Data Type: |
dtr-types:percentItemType |
| Balance Type: |
na |
| Period Type: |
instant |
|
| X |
- Details
| Name: |
srt_ScheduleOfEquityMethodInvestmentEquityMethodInvesteeNameAxis=cmg_TractorMember |
| Namespace Prefix: |
|
| Data Type: |
na |
| Balance Type: |
|
| Period Type: |
|
|
| X |
- Details
| Name: |
srt_ScheduleOfEquityMethodInvestmentEquityMethodInvesteeNameAxis=cmg_VebuMember |
| Namespace Prefix: |
|
| Data Type: |
na |
| Balance Type: |
|
| Period Type: |
|
|
v3.25.0.1
| X |
- DefinitionNumber of operating segments. An operating segment is a component of an enterprise: (a) that engages in business activities from which it may earn revenues and incur expenses (including revenues and expenses relating to transactions with other components of the same enterprise), (b) whose operating results are regularly reviewed by the enterprise's chief operating decision maker to make decisions about resources to be allocated to the segment and assess its performance, and (c) for which discrete financial information is available. An operating segment may engage in business activities for which it has yet to earn revenues, for example, start-up operations may be operating segments before earning revenues. Reference 1: http://www.xbrl.org/2003/role/exampleRef
-Topic 280
-SubTopic 10
-Name Accounting Standards Codification
-Section 55
-Paragraph 49
-Publisher FASB
-URI https://asc.fasb.org/1943274/2147482785/280-10-55-49
Reference 2: http://www.xbrl.org/2009/role/commonPracticeRef
-Topic 280
-SubTopic 10
-Name Accounting Standards Codification
-Section 50
-Paragraph 18
-Publisher FASB
-URI https://asc.fasb.org/1943274/2147482810/280-10-50-18
| Name: |
us-gaap_NumberOfOperatingSegments |
| Namespace Prefix: |
us-gaap_ |
| Data Type: |
xbrli:integerItemType |
| Balance Type: |
na |
| Period Type: |
duration |
|
| X |
- DefinitionNumber of segments reported by the entity. A reportable segment is a component of an entity for which there is an accounting requirement to report separate financial information on that component in the entity's financial statements. Reference 1: http://www.xbrl.org/2003/role/exampleRef
-Topic 280
-SubTopic 10
-Name Accounting Standards Codification
-Section 55
-Paragraph 47
-Subparagraph (a)
-Publisher FASB
-URI https://asc.fasb.org/1943274/2147482785/280-10-55-47
Reference 2: http://www.xbrl.org/2003/role/exampleRef
-Topic 280
-SubTopic 10
-Name Accounting Standards Codification
-Section 55
-Paragraph 54
-Subparagraph (e)
-Publisher FASB
-URI https://asc.fasb.org/1943274/2147482785/280-10-55-54
Reference 3: http://www.xbrl.org/2009/role/commonPracticeRef
-Topic 280
-SubTopic 10
-Name Accounting Standards Codification
-Section 50
-Paragraph 18
-Publisher FASB
-URI https://asc.fasb.org/1943274/2147482810/280-10-50-18
| Name: |
us-gaap_NumberOfReportableSegments |
| Namespace Prefix: |
us-gaap_ |
| Data Type: |
xbrli:integerItemType |
| Balance Type: |
na |
| Period Type: |
duration |
|
| X |
- References
+ Details
| Name: |
us-gaap_SegmentReportingAbstract |
| Namespace Prefix: |
us-gaap_ |
| Data Type: |
xbrli:stringItemType |
| Balance Type: |
na |
| Period Type: |
duration |
|
v3.25.0.1
Segment Reporting - Schedule of Reportable Segments (Details) - USD ($)
$ in Thousands |
12 Months Ended |
Dec. 31, 2024 |
Dec. 31, 2023 |
Dec. 31, 2022 |
| Segment Reporting, Asset Reconciling Item [Line Items] |
|
|
|
| Total revenue |
$ 11,313,853
|
$ 9,871,649
|
$ 8,634,652
|
| Less: |
|
|
|
| Food, beverage and packaging |
3,374,516
|
2,912,564
|
2,602,245
|
| Labor |
2,789,789
|
2,440,982
|
2,197,958
|
| Occupancy |
563,374
|
503,264
|
460,425
|
| Other operating costs |
1,568,482
|
1,428,747
|
1,311,905
|
| Depreciation and amortization |
335,030
|
319,394
|
286,826
|
| Income from operations |
1,916,333
|
1,557,813
|
1,160,403
|
| Interest and other income, net |
93,897
|
62,693
|
21,128
|
| Total consolidated income before income taxes |
2,010,230
|
1,620,506
|
1,181,531
|
| Corporate and other unallocated expenses |
|
|
|
| Less: |
|
|
|
| Income from operations |
709,426
|
657,134
|
574,572
|
| Excluding corporate nonsegment |
|
|
|
| Segment Reporting, Asset Reconciling Item [Line Items] |
|
|
|
| Total revenue |
202,121
|
151,280
|
118,442
|
| Less: |
|
|
|
| Income from operations |
(2,840)
|
(7,171)
|
(9,633)
|
| Interest and other income, net |
93,897
|
62,693
|
21,128
|
| Food and beverage revenue |
|
|
|
| Segment Reporting, Asset Reconciling Item [Line Items] |
|
|
|
| Total revenue |
11,247,384
|
9,804,124
|
8,558,001
|
| Delivery service revenue |
|
|
|
| Segment Reporting, Asset Reconciling Item [Line Items] |
|
|
|
| Total revenue |
66,469
|
67,525
|
76,651
|
| U. S. Segment | Operating Segments |
|
|
|
| Segment Reporting, Asset Reconciling Item [Line Items] |
|
|
|
| Total revenue |
11,111,732
|
9,720,369
|
8,516,210
|
| Less: |
|
|
|
| Food, beverage and packaging |
3,299,295
|
2,853,651
|
2,556,657
|
| Labor |
2,741,590
|
2,402,964
|
2,168,994
|
| Occupancy |
548,688
|
491,757
|
450,684
|
| Marketing |
283,053
|
261,358
|
248,319
|
| Other operating costs |
1,254,512
|
1,141,850
|
1,045,025
|
| Depreciation and amortization |
300,513
|
282,521
|
253,904
|
| Other segment items |
55,482
|
64,150
|
48,019
|
| Income from operations |
2,628,599
|
2,222,118
|
1,744,608
|
| U. S. Segment | Food and beverage revenue | Operating Segments |
|
|
|
| Segment Reporting, Asset Reconciling Item [Line Items] |
|
|
|
| Total revenue |
11,045,450
|
9,652,976
|
8,439,674
|
| U. S. Segment | Delivery service revenue | Operating Segments |
|
|
|
| Segment Reporting, Asset Reconciling Item [Line Items] |
|
|
|
| Total revenue |
$ 66,282
|
$ 67,393
|
$ 76,536
|
| X |
- DefinitionCost of labor directly related to good produced and service rendered. Includes, but is not limited to, payroll cost and equity-based compensation. Reference 1: http://www.xbrl.org/2009/role/commonPracticeRef
-Topic 220
-SubTopic 10
-Name Accounting Standards Codification
-Section S99
-Paragraph 2
-Subparagraph (SX 210.5-03(2))
-Publisher FASB
-URI https://asc.fasb.org/1943274/2147483621/220-10-S99-2
| Name: |
us-gaap_CostDirectLabor |
| Namespace Prefix: |
us-gaap_ |
| Data Type: |
xbrli:monetaryItemType |
| Balance Type: |
debit |
| Period Type: |
duration |
|
| X |
- DefinitionCost of material used for good produced and service rendered. Reference 1: http://www.xbrl.org/2009/role/commonPracticeRef
-Topic 220
-SubTopic 10
-Name Accounting Standards Codification
-Section S99
-Paragraph 2
-Subparagraph (SX 210.5-03(2))
-Publisher FASB
-URI https://asc.fasb.org/1943274/2147483621/220-10-S99-2
| Name: |
us-gaap_CostDirectMaterial |
| Namespace Prefix: |
us-gaap_ |
| Data Type: |
xbrli:monetaryItemType |
| Balance Type: |
debit |
| Period Type: |
duration |
|
| X |
- DefinitionThe aggregate expense recognized in the current period that allocates the cost of tangible assets, intangible assets, or depleting assets to periods that benefit from use of the assets. Reference 1: http://fasb.org/us-gaap/role/ref/legacyRef
-Name Accounting Standards Codification
-Section 45
-Paragraph 28
-Subparagraph (b)
-SubTopic 10
-Topic 230
-Publisher FASB
-URI https://asc.fasb.org/1943274/2147482740/230-10-45-28
Reference 2: http://www.xbrl.org/2003/role/exampleRef
-Topic 280
-SubTopic 10
-Name Accounting Standards Codification
-Section 55
-Paragraph 48
-Publisher FASB
-URI https://asc.fasb.org/1943274/2147482785/280-10-55-48
Reference 3: http://www.xbrl.org/2003/role/exampleRef
-Topic 280
-SubTopic 10
-Name Accounting Standards Codification
-Section 55
-Paragraph 49
-Publisher FASB
-URI https://asc.fasb.org/1943274/2147482785/280-10-55-49
Reference 4: http://www.xbrl.org/2003/role/disclosureRef
-Topic 270
-SubTopic 10
-Name Accounting Standards Codification
-Section 50
-Paragraph 1
-Subparagraph (i)
-Publisher FASB
-URI https://asc.fasb.org/1943274/2147482964/270-10-50-1
Reference 5: http://www.xbrl.org/2003/role/disclosureRef
-Topic 280
-SubTopic 10
-Name Accounting Standards Codification
-Section 50
-Paragraph 32
-Subparagraph (ee)
-Publisher FASB
-URI https://asc.fasb.org/1943274/2147482810/280-10-50-32
Reference 6: http://www.xbrl.org/2003/role/disclosureRef
-Topic 280
-SubTopic 10
-Name Accounting Standards Codification
-Section 50
-Paragraph 22
-Subparagraph (e)
-Publisher FASB
-URI https://asc.fasb.org/1943274/2147482810/280-10-50-22
| Name: |
us-gaap_DepreciationDepletionAndAmortization |
| Namespace Prefix: |
us-gaap_ |
| Data Type: |
xbrli:monetaryItemType |
| Balance Type: |
debit |
| Period Type: |
duration |
|
| X |
- DefinitionExpenditures for planning and executing the conception, pricing, promotion, and distribution of ideas, goods, and services. Costs of public relations and corporate promotions are typically considered to be marketing costs. Reference 1: http://fasb.org/us-gaap/role/ref/legacyRef
-Topic 220
-SubTopic 10
-Name Accounting Standards Codification
-Section S99
-Paragraph 2
-Subparagraph (SX 210.5-03(4))
-Publisher FASB
-URI https://asc.fasb.org/1943274/2147483621/220-10-S99-2
| Name: |
us-gaap_MarketingExpense |
| Namespace Prefix: |
us-gaap_ |
| Data Type: |
xbrli:monetaryItemType |
| Balance Type: |
debit |
| Period Type: |
duration |
|
| X |
- DefinitionAmount of net occupancy expense that may include items, such as depreciation of facilities and equipment, lease expenses, property taxes and property and casualty insurance expense. Reference 1: http://fasb.org/us-gaap/role/ref/legacyRef
-Topic 220
-SubTopic 10
-Name Accounting Standards Codification
-Section S99
-Paragraph 2
-Subparagraph (SX 210.5-03(6))
-Publisher FASB
-URI https://asc.fasb.org/1943274/2147483621/220-10-S99-2
Reference 2: http://fasb.org/us-gaap/role/ref/legacyRef
-Topic 942
-SubTopic 220
-Name Accounting Standards Codification
-Section S99
-Paragraph 1
-Subparagraph (SX 210.9-04(14)(b))
-Publisher FASB
-URI https://asc.fasb.org/1943274/2147478524/942-220-S99-1
Reference 3: http://fasb.org/us-gaap/role/ref/otherTransitionRef
-Topic 840
-SubTopic 30
-Name Accounting Standards Codification
-Section 50
-Paragraph 1
-Publisher FASB
-URI https://asc.fasb.org/1943274/2147481161/840-30-50-1
| Name: |
us-gaap_OccupancyNet |
| Namespace Prefix: |
us-gaap_ |
| Data Type: |
xbrli:monetaryItemType |
| Balance Type: |
debit |
| Period Type: |
duration |
|
| X |
- References
+ Details
| Name: |
us-gaap_OperatingCostsAndExpensesAbstract |
| Namespace Prefix: |
us-gaap_ |
| Data Type: |
xbrli:stringItemType |
| Balance Type: |
na |
| Period Type: |
duration |
|
| X |
- DefinitionThe net result for the period of deducting operating expenses from operating revenues. Reference 1: http://www.xbrl.org/2009/role/commonPracticeRef
-Topic 280
-SubTopic 10
-Name Accounting Standards Codification
-Section 50
-Paragraph 22
-Publisher FASB
-URI https://asc.fasb.org/1943274/2147482810/280-10-50-22
Reference 2: http://www.xbrl.org/2009/role/commonPracticeRef
-Topic 280
-SubTopic 10
-Name Accounting Standards Codification
-Section 50
-Paragraph 32
-Subparagraph (f)
-Publisher FASB
-URI https://asc.fasb.org/1943274/2147482810/280-10-50-32
Reference 3: http://www.xbrl.org/2009/role/commonPracticeRef
-Topic 280
-SubTopic 10
-Name Accounting Standards Codification
-Section 50
-Paragraph 30
-Subparagraph (b)
-Publisher FASB
-URI https://asc.fasb.org/1943274/2147482810/280-10-50-30
Reference 4: http://www.xbrl.org/2009/role/commonPracticeRef
-Topic 270
-SubTopic 10
-Name Accounting Standards Codification
-Section 50
-Paragraph 1
-Subparagraph (i)
-Publisher FASB
-URI https://asc.fasb.org/1943274/2147482964/270-10-50-1
Reference 5: http://www.xbrl.org/2009/role/commonPracticeRef
-Topic 280
-SubTopic 10
-Name Accounting Standards Codification
-Section 50
-Paragraph 32
-Subparagraph (ee)
-Publisher FASB
-URI https://asc.fasb.org/1943274/2147482810/280-10-50-32
Reference 6: http://fasb.org/us-gaap/role/ref/otherTransitionRef
-Topic 280
-SubTopic 10
-Name Accounting Standards Codification
-Section 50
-Paragraph 32
-Subparagraph (c)
-Publisher FASB
-URI https://asc.fasb.org/1943274/2147482810/280-10-50-32
Reference 7: http://www.xbrl.org/2003/role/exampleRef
-Topic 280
-SubTopic 10
-Name Accounting Standards Codification
-Section 50
-Paragraph 31
-Publisher FASB
-URI https://asc.fasb.org/1943274/2147482810/280-10-50-31
| Name: |
us-gaap_OperatingIncomeLoss |
| Namespace Prefix: |
us-gaap_ |
| Data Type: |
xbrli:monetaryItemType |
| Balance Type: |
credit |
| Period Type: |
duration |
|
| X |
- DefinitionThe total amount of other operating cost and expense items that are associated with the entity's normal revenue producing operation. Reference 1: http://www.xbrl.org/2003/role/exampleRef
-Topic 280
-SubTopic 10
-Name Accounting Standards Codification
-Section 55
-Paragraph 48
-Publisher FASB
-URI https://asc.fasb.org/1943274/2147482785/280-10-55-48
Reference 2: http://fasb.org/us-gaap/role/ref/legacyRef
-Topic 220
-SubTopic 10
-Name Accounting Standards Codification
-Section S99
-Paragraph 2
-Subparagraph (SX 210.5-03(3))
-Publisher FASB
-URI https://asc.fasb.org/1943274/2147483621/220-10-S99-2
Reference 3: http://www.xbrl.org/2003/role/disclosureRef
-Topic 944
-SubTopic 220
-Name Accounting Standards Codification
-Section S99
-Paragraph 1
-Subparagraph (SX 210.7-04(7)(b))
-Publisher FASB
-URI https://asc.fasb.org/1943274/2147477250/944-220-S99-1
| Name: |
us-gaap_OtherCostAndExpenseOperating |
| Namespace Prefix: |
us-gaap_ |
| Data Type: |
xbrli:monetaryItemType |
| Balance Type: |
debit |
| Period Type: |
duration |
|
| X |
- DefinitionAmount of income (expense) related to nonoperating activities, classified as other. Reference 1: http://fasb.org/us-gaap/role/ref/legacyRef
-Topic 220
-SubTopic 10
-Name Accounting Standards Codification
-Section S99
-Paragraph 2
-Subparagraph (SX 210.5-03(9))
-Publisher FASB
-URI https://asc.fasb.org/1943274/2147483621/220-10-S99-2
| Name: |
us-gaap_OtherNonoperatingIncomeExpense |
| Namespace Prefix: |
us-gaap_ |
| Data Type: |
xbrli:monetaryItemType |
| Balance Type: |
credit |
| Period Type: |
duration |
|
| X |
- DefinitionAmount of revenue recognized from goods sold, services rendered, insurance premiums, or other activities that constitute an earning process. Includes, but is not limited to, investment and interest income before deduction of interest expense when recognized as a component of revenue, and sales and trading gain (loss). Reference 1: http://www.xbrl.org/2003/role/exampleRef
-Topic 280
-SubTopic 10
-Name Accounting Standards Codification
-Section 55
-Paragraph 48
-Publisher FASB
-URI https://asc.fasb.org/1943274/2147482785/280-10-55-48
Reference 2: http://www.xbrl.org/2003/role/disclosureRef
-Topic 280
-SubTopic 10
-Name Accounting Standards Codification
-Section 50
-Paragraph 41
-Subparagraph (a)
-Publisher FASB
-URI https://asc.fasb.org/1943274/2147482810/280-10-50-41
Reference 3: http://www.xbrl.org/2003/role/disclosureRef
-Topic 270
-SubTopic 10
-Name Accounting Standards Codification
-Section 50
-Paragraph 1
-Subparagraph (i)
-Publisher FASB
-URI https://asc.fasb.org/1943274/2147482964/270-10-50-1
Reference 4: http://www.xbrl.org/2003/role/disclosureRef
-Topic 280
-SubTopic 10
-Name Accounting Standards Codification
-Section 50
-Paragraph 32
-Subparagraph (ee)
-Publisher FASB
-URI https://asc.fasb.org/1943274/2147482810/280-10-50-32
Reference 5: http://fasb.org/us-gaap/role/ref/otherTransitionRef
-Topic 280
-SubTopic 10
-Name Accounting Standards Codification
-Section 50
-Paragraph 32
-Subparagraph (b)
-Publisher FASB
-URI https://asc.fasb.org/1943274/2147482810/280-10-50-32
Reference 6: http://fasb.org/us-gaap/role/ref/otherTransitionRef
-Topic 280
-SubTopic 10
-Name Accounting Standards Codification
-Section 50
-Paragraph 32
-Subparagraph (a)
-Publisher FASB
-URI https://asc.fasb.org/1943274/2147482810/280-10-50-32
Reference 7: http://www.xbrl.org/2003/role/disclosureRef
-Topic 235
-SubTopic 10
-Name Accounting Standards Codification
-Section S99
-Paragraph 1
-Subparagraph (SX 210.4-08(g)(1)(ii))
-Publisher FASB
-URI https://asc.fasb.org/1943274/2147480678/235-10-S99-1
Reference 8: http://www.xbrl.org/2003/role/disclosureRef
-Topic 323
-SubTopic 10
-Name Accounting Standards Codification
-Section 50
-Paragraph 3
-Subparagraph (c)
-Publisher FASB
-URI https://asc.fasb.org/1943274/2147481687/323-10-50-3
Reference 9: http://www.xbrl.org/2003/role/disclosureRef
-Topic 825
-SubTopic 10
-Name Accounting Standards Codification
-Section 50
-Paragraph 28
-Subparagraph (f)
-Publisher FASB
-URI https://asc.fasb.org/1943274/2147482907/825-10-50-28
Reference 10: http://www.xbrl.org/2003/role/disclosureRef
-Topic 470
-SubTopic 10
-Name Accounting Standards Codification
-Section S99
-Paragraph 1A
-Subparagraph (SX 210.13-01(a)(4)(i))
-Publisher FASB
-URI https://asc.fasb.org/1943274/2147480097/470-10-S99-1A
Reference 11: http://www.xbrl.org/2009/role/commonPracticeRef
-Topic 470
-SubTopic 10
-Name Accounting Standards Codification
-Section S99
-Paragraph 1A
-Subparagraph (SX 210.13-01(a)(4)(ii))
-Publisher FASB
-URI https://asc.fasb.org/1943274/2147480097/470-10-S99-1A
Reference 12: http://www.xbrl.org/2003/role/disclosureRef
-Topic 470
-SubTopic 10
-Name Accounting Standards Codification
-Section S99
-Paragraph 1A
-Subparagraph (SX 210.13-01(a)(4)(iii)(A))
-Publisher FASB
-URI https://asc.fasb.org/1943274/2147480097/470-10-S99-1A
Reference 13: http://www.xbrl.org/2003/role/disclosureRef
-Topic 470
-SubTopic 10
-Name Accounting Standards Codification
-Section S99
-Paragraph 1A
-Subparagraph (SX 210.13-01(a)(4)(iv))
-Publisher FASB
-URI https://asc.fasb.org/1943274/2147480097/470-10-S99-1A
Reference 14: http://www.xbrl.org/2003/role/disclosureRef
-Topic 470
-SubTopic 10
-Name Accounting Standards Codification
-Section S99
-Paragraph 1A
-Subparagraph (SX 210.13-01(a)(5))
-Publisher FASB
-URI https://asc.fasb.org/1943274/2147480097/470-10-S99-1A
Reference 15: http://www.xbrl.org/2003/role/disclosureRef
-Topic 470
-SubTopic 10
-Name Accounting Standards Codification
-Section S99
-Paragraph 1B
-Subparagraph (SX 210.13-02(a)(4)(i))
-Publisher FASB
-URI https://asc.fasb.org/1943274/2147480097/470-10-S99-1B
Reference 16: http://www.xbrl.org/2003/role/disclosureRef
-Topic 470
-SubTopic 10
-Name Accounting Standards Codification
-Section S99
-Paragraph 1B
-Subparagraph (SX 210.13-02(a)(4)(iii)(A))
-Publisher FASB
-URI https://asc.fasb.org/1943274/2147480097/470-10-S99-1B
Reference 17: http://www.xbrl.org/2003/role/disclosureRef
-Topic 470
-SubTopic 10
-Name Accounting Standards Codification
-Section S99
-Paragraph 1B
-Subparagraph (SX 210.13-02(a)(4)(iii)(B))
-Publisher FASB
-URI https://asc.fasb.org/1943274/2147480097/470-10-S99-1B
Reference 18: http://www.xbrl.org/2003/role/disclosureRef
-Topic 470
-SubTopic 10
-Name Accounting Standards Codification
-Section S99
-Paragraph 1B
-Subparagraph (SX 210.13-02(a)(4)(iv))
-Publisher FASB
-URI https://asc.fasb.org/1943274/2147480097/470-10-S99-1B
Reference 19: http://www.xbrl.org/2003/role/disclosureRef
-Topic 470
-SubTopic 10
-Name Accounting Standards Codification
-Section S99
-Paragraph 1B
-Subparagraph (SX 210.13-02(a)(5))
-Publisher FASB
-URI https://asc.fasb.org/1943274/2147480097/470-10-S99-1B
Reference 20: http://www.xbrl.org/2003/role/disclosureRef
-Topic 280
-SubTopic 10
-Name Accounting Standards Codification
-Section 50
-Paragraph 30
-Subparagraph (a)
-Publisher FASB
-URI https://asc.fasb.org/1943274/2147482810/280-10-50-30
Reference 21: http://www.xbrl.org/2003/role/disclosureRef
-Topic 280
-SubTopic 10
-Name Accounting Standards Codification
-Section 50
-Paragraph 42
-Publisher FASB
-URI https://asc.fasb.org/1943274/2147482810/280-10-50-42
Reference 22: http://www.xbrl.org/2003/role/disclosureRef
-Topic 280
-SubTopic 10
-Name Accounting Standards Codification
-Section 50
-Paragraph 22
-Subparagraph (b)
-Publisher FASB
-URI https://asc.fasb.org/1943274/2147482810/280-10-50-22
Reference 23: http://www.xbrl.org/2003/role/disclosureRef
-Topic 280
-SubTopic 10
-Name Accounting Standards Codification
-Section 50
-Paragraph 40
-Publisher FASB
-URI https://asc.fasb.org/1943274/2147482810/280-10-50-40
Reference 24: http://www.xbrl.org/2003/role/disclosureRef
-Topic 280
-SubTopic 10
-Name Accounting Standards Codification
-Section 50
-Paragraph 22
-Subparagraph (a)
-Publisher FASB
-URI https://asc.fasb.org/1943274/2147482810/280-10-50-22
Reference 25: http://www.xbrl.org/2003/role/disclosureRef
-Topic 942
-SubTopic 235
-Name Accounting Standards Codification
-Section S99
-Paragraph 1
-Subparagraph (SX 210.9-05(b)(2))
-Publisher FASB
-URI https://asc.fasb.org/1943274/2147477314/942-235-S99-1
Reference 26: http://www.xbrl.org/2003/role/disclosureRef
-Topic 220
-SubTopic 10
-Name Accounting Standards Codification
-Section S99
-Paragraph 2
-Subparagraph (SX 210.5-03(1))
-Publisher FASB
-URI https://asc.fasb.org/1943274/2147483621/220-10-S99-2
| Name: |
us-gaap_Revenues |
| Namespace Prefix: |
us-gaap_ |
| Data Type: |
xbrli:monetaryItemType |
| Balance Type: |
credit |
| Period Type: |
duration |
|
| X |
- DefinitionLine items represent financial concepts included in a table. These concepts are used to disclose reportable information associated with domain members defined in one or many axes to the table.
| Name: |
us-gaap_SegmentReportingAssetReconcilingItemLineItems |
| Namespace Prefix: |
us-gaap_ |
| Data Type: |
xbrli:stringItemType |
| Balance Type: |
na |
| Period Type: |
duration |
|
| X |
- DefinitionAmount of other expense (income) and loss (gain) calculated as difference between segment revenue and separately disclosed expense category to arrive at segment profit (loss). Reference 1: http://www.xbrl.org/2003/role/exampleRef
-Topic 280
-SubTopic 10
-Name Accounting Standards Codification
-Section 55
-Paragraph 48
-Publisher FASB
-URI https://asc.fasb.org/1943274/2147482785/280-10-55-48
Reference 2: http://www.xbrl.org/2003/role/disclosureRef
-Topic 270
-SubTopic 10
-Name Accounting Standards Codification
-Section 50
-Paragraph 1
-Subparagraph (i)
-Publisher FASB
-URI https://asc.fasb.org/1943274/2147482964/270-10-50-1
Reference 3: http://www.xbrl.org/2003/role/disclosureRef
-Topic 280
-SubTopic 10
-Name Accounting Standards Codification
-Section 50
-Paragraph 32
-Subparagraph (ee)
-Publisher FASB
-URI https://asc.fasb.org/1943274/2147482810/280-10-50-32
Reference 4: http://www.xbrl.org/2003/role/disclosureRef
-Topic 280
-SubTopic 10
-Name Accounting Standards Codification
-Section 50
-Paragraph 26C
-Publisher FASB
-URI https://asc.fasb.org/1943274/2147482810/280-10-50-26C
Reference 5: http://www.xbrl.org/2003/role/disclosureRef
-Topic 280
-SubTopic 10
-Name Accounting Standards Codification
-Section 50
-Paragraph 26B
-Publisher FASB
-URI https://asc.fasb.org/1943274/2147482810/280-10-50-26B
| Name: |
us-gaap_SegmentReportingOtherItemAmount |
| Namespace Prefix: |
us-gaap_ |
| Data Type: |
xbrli:monetaryItemType |
| Balance Type: |
debit |
| Period Type: |
duration |
|
| X |
- Details
| Name: |
srt_ConsolidationItemsAxis=us-gaap_CorporateNonSegmentMember |
| Namespace Prefix: |
|
| Data Type: |
na |
| Balance Type: |
|
| Period Type: |
|
|
| X |
- Details
| Name: |
srt_ConsolidationItemsAxis=us-gaap_MaterialReconcilingItemsMember |
| Namespace Prefix: |
|
| Data Type: |
na |
| Balance Type: |
|
| Period Type: |
|
|
| X |
- Details
| Name: |
srt_ProductOrServiceAxis=us-gaap_FoodAndBeverageMember |
| Namespace Prefix: |
|
| Data Type: |
na |
| Balance Type: |
|
| Period Type: |
|
|
| X |
- Details
| Name: |
srt_ProductOrServiceAxis=cmg_DeliveryServiceMember |
| Namespace Prefix: |
|
| Data Type: |
na |
| Balance Type: |
|
| Period Type: |
|
|
| X |
- Details
| Name: |
us-gaap_StatementBusinessSegmentsAxis=cmg_U.S.SegmentMember |
| Namespace Prefix: |
|
| Data Type: |
na |
| Balance Type: |
|
| Period Type: |
|
|
| X |
- Details
| Name: |
srt_ConsolidationItemsAxis=us-gaap_OperatingSegmentsMember |
| Namespace Prefix: |
|
| Data Type: |
na |
| Balance Type: |
|
| Period Type: |
|
|
v3.25.0.1
| X |
- DefinitionLong-lived assets other than financial instruments, long-term customer relationships of a financial institution, mortgage and other servicing rights, deferred policy acquisition costs, and deferred tax assets. Reference 1: http://www.xbrl.org/2003/role/disclosureRef
-Topic 280
-SubTopic 10
-Name Accounting Standards Codification
-Section 50
-Paragraph 41
-Subparagraph (b)
-Publisher FASB
-URI https://asc.fasb.org/1943274/2147482810/280-10-50-41
| Name: |
us-gaap_NoncurrentAssets |
| Namespace Prefix: |
us-gaap_ |
| Data Type: |
xbrli:monetaryItemType |
| Balance Type: |
debit |
| Period Type: |
instant |
|
| X |
- DefinitionLine items represent financial concepts included in a table. These concepts are used to disclose reportable information associated with domain members defined in one or many axes to the table.
| Name: |
us-gaap_RevenuesFromExternalCustomersAndLongLivedAssetsLineItems |
| Namespace Prefix: |
us-gaap_ |
| Data Type: |
xbrli:stringItemType |
| Balance Type: |
na |
| Period Type: |
duration |
|
| X |
- Details
| Name: |
srt_StatementGeographicalAxis=country_US |
| Namespace Prefix: |
|
| Data Type: |
na |
| Balance Type: |
|
| Period Type: |
|
|
| X |
- Details
| Name: |
srt_StatementGeographicalAxis=us-gaap_NonUsMember |
| Namespace Prefix: |
|
| Data Type: |
na |
| Balance Type: |
|
| Period Type: |
|
|
Chipotle Mexican Grill (NYSE:CMG)
Gráfico Histórico do Ativo
De Jan 2025 até Fev 2025

Chipotle Mexican Grill (NYSE:CMG)
Gráfico Histórico do Ativo
De Fev 2024 até Fev 2025

