US Index Futures See Gains, Oil Prices Dip
17 Abril 2024 - 7:59AM
IH Market News
U.S. index futures displayed positive performance in pre-market
trading on Wednesday, with S&P 500 aiming to halt a downward
trend that persisted over the last three consecutive days.
As of 6:23 AM, Dow Jones futures (DOWI:DJI) were up 146 points,
or 0.39%. S&P 500 futures rose 0.36%, and Nasdaq-100 futures
increased by 0.22%. The yield on the 10-year Treasury notes was at
4.641%.
In the commodities market, West Texas Intermediate crude oil for
May delivery dropped by 0.91% to $84.58 per barrel. Brent crude oil
for June fell by 0.92% to approximately $89.19 per barrel. Iron ore
traded on the Dalian Exchange rose by 4.25% to $120.21 per metric
ton.
The economic agenda in the United States for Wednesday starts at
10:30 AM with the publication of the crude oil inventory position
up to the previous Friday by the Department of Energy (DoE). Later,
at 2:00 PM, the focus shifts to the Federal Reserve (Fed), which
will release the Beige Book.
European markets showed resilience, trading higher despite
recent statements by Federal Reserve Chairman Jerome Powell, which
usually have a significant influence on global markets. Even with
ongoing geopolitical tension involving potential confrontations
between Iran and Israel, investors maintained cautious
optimism.
The Stoxx 600 index, a key benchmark for the region, recorded an
increase, with most sectors showing gains. Mining stocks were
particularly highlighted, with a rise of 2.2%. Meanwhile, in the
United Kingdom, the March inflation rate dropped to 3.2%, a result
below economists’ expectations. This indicator of inflation slowing
down could signal future interest rate cuts by the Bank of England,
bringing significant implications for monetary policy and economic
expectations in the region.
Asian stock markets had a mixed close on Wednesday following a
significant drop in the previous session, reflecting the complexity
of the regional economic landscape influenced by tensions in the
Middle East. Notably, Singapore’s economy revealed concerning data
with a 20.7% decrease in non-oil exports, a substantially larger
number than the 7% forecast by analysts surveyed by Reuters. This
scenario was exacerbated by the ongoing appreciation of the dollar,
which has placed additional pressures on regional currencies,
especially the Japanese yen.
At market close, the Shanghai SE in China registered a gain of
2.14%, while the Nikkei in Japan fell by 1.32%. The Hang Seng in
Hong Kong virtually stagnated with a slight increase of 0.02%, and
other indices like the Kospi in South Korea and the ASX 200 in
Australia also experienced declines, recording -0.98% and -0.09%,
respectively.
On Tuesday, the U.S. stock market showed uncertainty,
fluctuating throughout the day after recent losses. The Dow Jones
slightly rose, gaining 63.86 points, or 0.17%, to close at
37,798.97. The S&P 500, however, fell by 10.41 points, or
0.21%, to 5,051.41, while the Nasdaq dropped 19.77 points, or
0.12%, to 15,865.25. The Dow Jones was boosted by a jump in shares
of UnitedHealth (NYSE:UNH). However, a drop in
shares of Johnson & Johnson (NYSE:JNJ) limited
further gains, as market participants assessed future risks, such
as the prospect of higher interest rates.
In terms of quarterly earnings, reports are scheduled to be
presented before the start of trading from ASML
(NASDAQ:ASML), Abbott (NYSE:ABT),
Prologis (NYSE:PLD), Travelers
(NYSE:TRV), US Bancorp (NYSE:USB), First
Horizon National Corp (NYSE:FHN), First Community
Corporation (NASDAQ:FCCO), BankUnited Inc
(NYSE:BKU), SHL Telemedicine (NASDAQ:SHLT), among
others.
After the close, earnings numbers from Alcoa
(NYSE:AA), Bank OZK (NASDAQ:OZK), Las
Vegas Sands (NYSE:LVS), Liberty Energy
(NYSE:LBRT), Kinder Morgan (NYSE:KMI),
Synovus Financial Corp (NYSE:SNV),
Discover Financial Services (NYSE:DFS), SL
Green Realty Corp (NYSE:SLG), CSX
Corporation (NASDAQ:CSX), and more will be awaited.
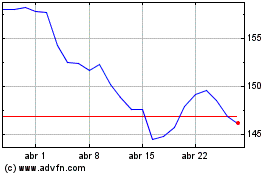
Johnson and Johnson (NYSE:JNJ)
Gráfico Histórico do Ativo
De Mar 2024 até Abr 2024

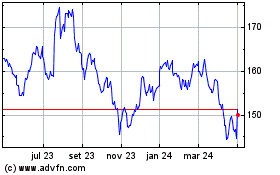
Johnson and Johnson (NYSE:JNJ)
Gráfico Histórico do Ativo
De Abr 2023 até Abr 2024
