Futures Pointing To Roughly Flat Open On Wall Street
24 Junho 2024 - 10:08AM
IH Market News
The major U.S. index futures are currently pointing to a roughly
flat open on Monday, with stocks likely to extend the lackluster
performance seen during last Friday’s session.
Traders may be reluctant to make significant moves ahead of the
release of some key U.S. economic data later in the week.
On Friday, the Commerce Department is due to release its report
on personal income and spending in the month of May, which includes
readings on inflation said to be preferred by the Federal
Reserve.
The report, which is expected to show a modest slowdown by the
annual rate of consumer price growth, could have a significant
impact on the outlook for interest rates.
Reports on new home sales, consumer confidence, durable goods
orders and pending home sales may also attract attention in the
coming days.
Following the mixed performance seen in Thursday’s sessions,
stocks showed a lack of direction over the course of the trading
day on Friday. The major averages spent the day bouncing back and
forth across the unchanged line.
The major averages eventually ended the day narrowly mixed.
While the Dow inched up 15.57 points or less than a tenth of a
percent to 39,150.33, the Nasdaq dipped 32.23 points or 0.2 percent
to 17,689.36 and the S&P 500 dipped 8.55 points or 0.2 percent
to 5,464.62.
For the holiday-interrupted week, the Dow jumped by 1.5 percent
and the S&P 500 climbed by 0.6 percent, while the Nasdaq was
nearly unchanged.
The choppy trading on Wall Street came as traders took a step
back to assess recent activity in the markets, which saw the Nasdaq
and the S&P 500 reach new record intraday highs on Thursday
before turning lower.
The narrower Dow, on the other hand, saw further upside over the
course of Thursday’s trading, and today’s uptick lifted the blue
chip index to its best closing level in a month.
Traders also kept an eye on shares of Nvidia (NASDAQ:NVDA), as
the AI darling has recently been a key driver of the markets.
Nvidia tumbled by 3.5 percent on Tuesday and by slumped by
another 3.2 percent today after briefly surpassing Microsoft
(NASDAQ:MSFT) as the world’s most valuable public company on
Tuesday.
On the U.S. economic front, The National Association of Realtors
released a report showing existing home sales in the U.S. decreased
roughly in line with economist estimates in the month of May.
The report said existing home sales slid 0.7 percent to an
annual rate of 4.11 million in May after tumbling by 1.9 percent to
an annual rate of 4.14 million. Economists had expected existing
home sales to drop to a rate of 4.10 million.
The continued decline by existing home sales came as the median
existing-home price reached a record high $419,300 in May, up 5.8
percent from $396,500 a year ago.
“Home prices reaching new highs are creating a wider divide
between those owning properties and those who wish to be first-time
buyers,” said NAR Chief Economist Lawrence Yun.
“The mortgage payment for a typical home today is more than
double that of homes purchased before 2020,” he added. “Still,
first-time buyers in the market understand the long-term benefits
of owning.”
A separate report released by the Conference Board showed its
reading on leading U.S. economic indicators fell by more than
expected in the month of May.
The Conference Board said its leading economic index decreased
by 0.5 percent in May following a 0.6 percent decline in April.
Economist had expected the index to dip by 0.3 percent.
Reflecting the lackluster performance by the broader markets,
most of the major sectors ended the day showing only modest
moves.
Gold stocks showed a significant move to the downside, however,
resulting in a 1.4 percent decline by the NYSE Arca Gold Bugs
Index. The weakness among gold stocks came amid a sharp pullback by
the price of the precious metal.
Considerable weakness was also visible among semiconductor
stocks, as reflected by the 1.3 loss posted by the Philadelphia
Semiconductor Index.
On the other hand, networking stocks showed a strong move to the
upside, driving the NYSE Arca Networking Index up by 1.2
percent.
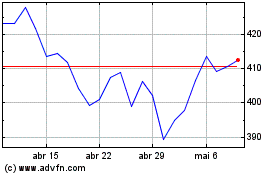
Microsoft (NASDAQ:MSFT)
Gráfico Histórico do Ativo
De Mai 2024 até Jun 2024

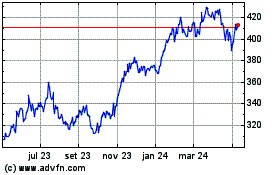
Microsoft (NASDAQ:MSFT)
Gráfico Histórico do Ativo
De Jun 2023 até Jun 2024
