U.S. Index Futures Drop, Signaling Ongoing Market Volatility; Oil Prices Stall
08 Agosto 2024 - 6:55AM
IH Market News
U.S. index futures fell in pre-market trading on Thursday,
signaling persistent market volatility. Following a tumultuous
Wednesday, these movements suggest that economic and geopolitical
concerns will continue to keep investors cautious in the coming
months.
At 4:43 AM ET, Dow Jones futures (DOWI:DJI) fell 95 points or
0.24%. S&P 500 futures lost 0.20%, and Nasdaq-100 futures
declined 0.02%. The 10-year Treasury yield stood at 3.918%.
In the commodities market, West Texas Intermediate crude for
September fell 0.20% to $75.06 per barrel. Brent crude for October
dropped 0.31% to around $78.09 per barrel. Prices paused recent 3%
gains due to Middle East tensions. Despite the volatility, with the
deaths of Hamas and Hezbollah leaders and potential Iran attacks,
supply was unaffected. Libya’s production decreased due to
protests, and U.S. oil stocks fell more than expected. Analysts see
an upside price risk due to geopolitical factors and weather
conditions.
On the U.S. economic calendar for Thursday, initial jobless
claims for the week ending August 3 will be released at 8:30 AM ET,
with a forecast of 240,000 claims, below the previously expected
249,000. At 10 AM, the wholesale inventories report for June will
be released, expected to show 0.2% growth compared to the previous
month’s 0.6%. At 3 PM, Richmond Fed President Tom Barkin will
speak.
Asia-Pacific markets showed mixed variations. Japan’s Nikkei 225
fell 0.74%. Australia’s S&P/ASX 200 dropped 0.4%, and South
Korea’s KOSPI decreased 0.45%. The Shanghai Composite rose 0.3% and
Hong Kong’s Hang Seng gained 0.8%. The Bank of Japan’s interest
rate decision and Japan’s trade data influenced fluctuations.
Japan’s current account surplus was 1.533 trillion yen ($10.2
billion), below the expected 1.789 trillion yen. SoftBank announced
a share buyback of up to 500 billion yen, with its shares down
3.5%. Lasertec rose 22.55% after a 39.7% increase in net sales. The
Reserve Bank of India kept rates at 6.5%.
European markets opened lower, with technology and mining
sectors leading declines. This drop follows a recovery in regional
stocks on Wednesday. Today’s focus includes earnings from companies
like Munich
Re (TG:A289EQ), Siemens (TG:SIE)
and Allianz (TG:ALV), with no major
economic data releases expected.
Siemens reported a quarterly operating profit of around $3.3
billion (€3 billion), up 11% from last year and exceeding analyst
expectations. Growth was driven by high demand in electrification
and software, though automation faced challenges. The company
maintained its annual forecast, expecting revenue growth between 4%
and 8%.
On Wednesday, stocks initially rose but lost ground during
trading, with major indices closing in negative territory. The Dow
Jones fell 234.21 points or 0.60% to 38,763.45 points, the S&P
500 slid 40.53 points or 0.77% to 5,199.50 points, and the Nasdaq
declined 171.05 points or 1.05% to 16,195.81 points. Stocks
initially benefited from bargain hunting, but persistent concerns
about the U.S. economic outlook continued to cast uncertainty over
markets, leading investors to adopt a more cautious stance.
In earnings reports before the market opens, Eli Lilly
&
Co. (NYSE:LLY), Novavax (NASDAQ:NVAX), Medical
Properties Trust Inc (NYSE:MPW), Vistra
Energy (NYSE:VST), Cheniere
Energy (NYSE:LNG), Datadog (NASDAQ:DDOG), Plug
Power (NASDAQ:PLUG), Cronos
Group (NASDAQ:CRON), CyberArk (NASDAQ:CYBR), Himax
Technologies (NASDAQ:HIMX), SharkNinja (NYSE:SN), Krispy
Kreme (NASDAQ:DNUT), Papa John’s
International (NASDAQ:PZZA), and more are expected to
report.
After the market closes, results are anticipated from
Paramount
Global (NASDAQ:PARA), Unity (NYSE:U), Gilead
Sciences (NASDAQ:GILD), SoundHound
AI (NASDAQ:SOUN), Trade
Desk (NASDAQ:TTD), Rocket Lab
USA (NASDAQ:RKLB), CleanSpark (NASDAQ:CLSK), Array
Technologies
Inc (NASDAQ:ARRY), TaskUs (NASDAQ:TASK), Five9 (NASDAQ:FIVN), B2Gold
Corp. (AMEX:BTG), Sweetgreen (NYSE:SG), e.l.f.
Beauty (NYSE:ELF), Honest
Company (NASDAQ:HNST), and others.
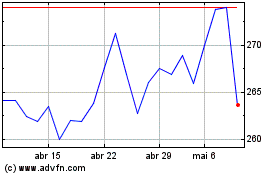
Allianz (TG:ALV)
Gráfico Histórico do Ativo
De Jan 2025 até Fev 2025

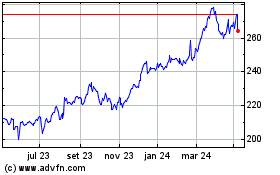
Allianz (TG:ALV)
Gráfico Histórico do Ativo
De Fev 2024 até Fev 2025
