Bitcoin Rally Driven By U.S. Coinbase Investors – Top Analyst Shares Metrics
20 Novembro 2024 - 9:00PM
NEWSBTC
Bitcoin reached a new all-time high yesterday, surging to $94,000
and solidifying the bulls’ control over the market. This milestone
has ignited widespread speculation about the key factors fueling
the rally, as Bitcoin continues to dominate headlines and capture
investor enthusiasm. Related Reading: Solana Analyst Expects
A Retrace Before It Breaks ATH – Targets Revealed Key insights from
CryptoQuant CEO Ki Young Ju shed light on the drivers of this
historic surge. According to Ju, this rally has been powered by
Coinbase investors, with U.S.-based buyers playing a significant
role. The influx of demand from these investors underscores the
growing domestic interest in Bitcoin and highlights the critical
influence of American market participants on global crypto trends.
Adding to the excitement, market sentiment appears to be heavily
influenced by the pro-crypto stance of President-elect Donald
Trump. His support for digital assets has sparked optimism across
the industry, potentially creating a favorable regulatory
environment that could sustain Bitcoin’s growth. Bitcoin Demand
Continues To Drive The Price Bitcoin demand remains
remarkably strong, even as miners and long-term holders (LTHs) take
profits during this rally. Despite selling pressure from these
groups, BTC continues to rise, underscoring the robust market
appetite for the leading cryptocurrency. This strength suggests
buyers readily absorb the distributed supply, fueling Bitcoin’s
bullish momentum. CryptoQuant CEO Ki Young Ju recently shared
insightful data on X that highlights the driving forces behind this
rally. According to Ju, U.S.-based investors using Coinbase have
played a pivotal role in Bitcoin’s surge. He referenced the BTC
Hourly Coinbase Premium (Volume-Weighted, USDT/USD Adjusted), which
measures the difference in Bitcoin prices on Coinbase compared to
other exchanges. The premium is currently positive and
growing, indicating that U.S. investors are willing to pay more for
BTC than their international counterparts. This trend demonstrates
strong demand from U.S. market participants, likely buoyed by
improving market sentiment and potential regulatory optimism.
Related Reading: Dogecoin Breaking Out Of Falling Wedge Pattern –
Analyst Reveals Target If this upward momentum in U.S. demand
persists, Bitcoin’s rally could extend further in the coming weeks,
potentially setting new highs before any major correction occurs.
However, as with all parabolic trends, traders and analysts remain
cautious, recognizing the possibility of eventual pullbacks. The
focus remains on Bitcoin’s strength, as buyers continue to outpace
sellers, driving the market higher. BTC Setting New Highs
(Again) Bitcoin (BTC) is trading at $93,300, following its
recent break above the all-time high (ATH) of $93,483. While this
move marked a new milestone for BTC, the price has since entered a
sideways range within a defined uptrend, indicating that demand
continues to outweigh supply. However, the breakout above the ATH
lacked significant momentum, resembling more of a small spring than
a decisive rally. This suggests that bulls might be starting to
lose steam. Despite this, BTC’s ability to maintain above $89,800
in the coming hours will be critical. Holding this key support
level could pave the way for a surge to $95,000, aligning with
broader market expectations of continued bullish momentum. Such a
move would likely reaffirm confidence among investors, potentially
driving further buying interest as Bitcoin eyes the psychological
$100,000 level. Related Reading: Bitcoin Demand Outpaces Supply –
On-Chain Metrics Reveal Low Seller Volume On the other hand, a drop
below $89,800 would shift the short-term narrative. This scenario
could lead to a retrace toward lower demand zones around $85,000,
where buyers might regroup to push prices higher again. As BTC
consolidates near its ATH, the market awaits a decisive move to
determine whether the bulls remain firmly in control or if a
temporary correction is on the horizon. Featured image from Dall-E,
chart from TradingView
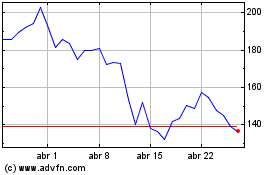
Solana (COIN:SOLUSD)
Gráfico Histórico do Ativo
De Nov 2024 até Dez 2024

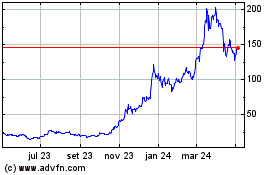
Solana (COIN:SOLUSD)
Gráfico Histórico do Ativo
De Dez 2023 até Dez 2024
