Arbitrum (ARB) Primed For 46% Rally If This Happens, Analyst Reveals
22 Janeiro 2025 - 4:00AM
NEWSBTC
An analyst has explained how Arbitrum could see an upswing of
around 46% if its price breaks out of this technical analysis
pattern. Arbitrum Has Been Trading Inside A Descending Triangle
Recently In a new post on X, analyst Ali Martinez has talked about
a Descending Triangle pattern forming in the 4-hour price of
Arbitrum. The “Descending Triangle” refers to a formation from
technical analysis (TA) that, as its name suggests, looks like a
triangle slopped downwards. The pattern involves two trendlines
between which the asset consolidates: an upper level drawn by
connecting together lower highs in the price and a lower one
parallel to the time-axis that joins bottoms. Like in many other TA
patterns, the upper line is considered to be a point of probable
resistance for the price, while the lower one can act as support.
Related Reading: Trader Greed Strikes Again: Bitcoin Corrects To
$102,000 After FOMO Spike Breaks out of either of these lines can
imply a continuation of trend in that direction. An escape above
the triangle is naturally a bullish signal, while a drop under it
can foreshadow a bearish outcome. Similar to the Descending
Triangle, there is also another pattern called the Ascending
Triangle, which forms when the consolidation occurs towards an
overall upside. Now, here is the chart shared by the analyst that
shows the Descending Triangle that the 4-hour price of Arbitrum has
been trading inside during the last couple of months: As displayed
in the above graph, the Arbitrum 4-hour price retested the upper
level of the Descending Triangle a few days ago, but it found
rejection as it has since plunged down. Yesterday, the coin saw a
very brief retest of the lower line, but it appears this level is
also holding for the cryptocurrency as its price has found a
rebound from it. Related Reading: XRP Whale Binance Deposits
Skyrocket: Key Holders Preparing For Profit-Taking? It’s likely
that these levels won’t hold for long, however, as ARB is fast
approaching the apex of the triangle. As the range gets narrower,
the chances of a breakout (in either direction) become higher. At
present, Arbitrum is trading right in the middle of the two levels,
so it’s uncertain which one it would be traveling to next. Martinez
notes that if the breakout happens towards the upside, then the
cryptocurrency could end up enjoying a surge of around 46%. This
figure is based on the fact that the height of the triangle
involves a price swing of this percentage. It only remains to be
seen whether ARB would be able to find a break above the Descending
Triangle or not. ARB Price At the time of writing, Arbitrum is
trading around $0.72, up 1% over the last 24 hours. Featured image
from Dall-E, charts from TradingView.com
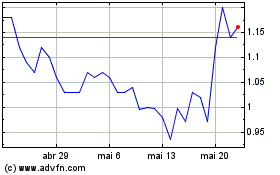
Arbitrum (COIN:ARBUSD)
Gráfico Histórico do Ativo
De Dez 2024 até Jan 2025

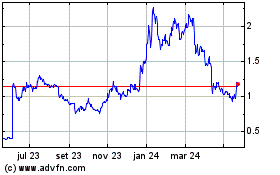
Arbitrum (COIN:ARBUSD)
Gráfico Histórico do Ativo
De Jan 2024 até Jan 2025
