Dogecoin Price On The Edge: Breakout Or Breakdown—What’s Next?
21 Fevereiro 2025 - 9:30AM
NEWSBTC
In a technical update posted on X, crypto analyst More Crypto
Online (@Morecryptoonl) presented a one-hour DOGE/USD chart
(Binance) illustrating a precarious sideways movement and a
potential turning point for the meme coin. At press time, Dogecoin
is stuck around the $0.25 region, barely moving after a substantial
drop in early February, with little to confirm a definitive bottom
in place. Dogecoin Stuck In Limbo From the chart’s labeling, the
analyst employs a blend of Elliott Wave counts and Fibonacci
retracement levels to map out Dogecoin’s possible next steps.
Notably, a broad corrective sequence labeled as (1), (4), C, A, B,
W, X, Y highlights multiple overlapping waves—indicative of an
extended correction rather than a simple price pullback. In the
latest leg downward, the analyst’s markings show a major swing low
around $0.21–$0.22, which coincides with a potential wave (4) on
the chart, although there is an “alt 4?” label suggesting this may
still be an alternative count which drags the DOGE price even
deeper in one last correction. The Fibonacci retracements and
extensions plotted in the $0.22–$0.24 region, with key levels
including the 50% retracement at $0.2446, a 78.6% level near
$0.2206, and a 100% extension around $0.2338, are key support
levels. These overlapping zones show where DOGE’s price bounced and
consolidated over the past several sessions. Related Reading:
Dogecoin Could Collapse If This Support Fails, Analyst Warns
Despite the intricate wave structure, the analyst points out there
is “no clear confirmation of a bottom.” The price has been
range-bound in the mid-$0.25 territory, lacking the momentum
usually seen in robust trend reversals. More Crypto Online
underscores two primary levels overhead that could confirm a
bullish reversal: $0.293 – Breaking above this zone may offer the
first tangible indication that buyers are taking control and $0.341
– A close above $0.341 would serve as a stronger confirmation of
trend reversal and likely invalidate current lower-wave counts.
Related Reading: Dogecoin Repeating History? This Setup Led To 150%
Gains Until these thresholds are breached, the analyst remains
cautious, noting that while they “lean toward the low being in,”
there is still no definitive evidence to support it. A crucial
observation is the muted bounce off recent lows while the Bitcoin
price saw a strong move upwards on Thursday. According to the
chart, each subsequent uptick has been shallow, failing to gain
meaningful traction and hinting that sellers remain active. This
underscores the broader uncertainty. If buyers cannot push above
$0.293 soon, Dogecoin’s sideways drift could persist. A deeper dip
below $0.22 could give rise to a more extended corrective pattern,
labeled on the chart as (5) or C, challenging bullish hopes that
the last swing low is the cycle bottom. In the words of the
analyst: “Despite some charts showing strong moves today, the DOGE
price has remained stagnant, with no clear confirmation of a
bottom. The price continues to move sideways, lacking decisive
momentum. A break above $0.293 would be the first step in signaling
a potential reversal, with stronger confirmation coming from a move
beyond $0.341. While I lean toward the low being in, there’s still
no definitive evidence. So far, the upside move from the last low
has been too small to be meaningful.” At press time, DOGE traded at
$0.25. Featured image created with DALL.E, chart from
TradingView.com
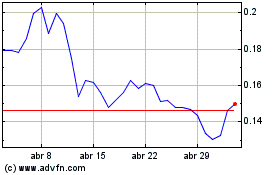
Dogecoin (COIN:DOGEUSD)
Gráfico Histórico do Ativo
De Jan 2025 até Fev 2025

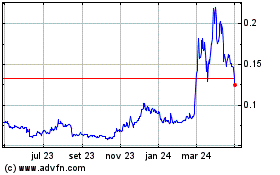
Dogecoin (COIN:DOGEUSD)
Gráfico Histórico do Ativo
De Fev 2024 até Fev 2025
