XRP Price Prediction: Bears Reject $0.40, Ripple Turns Vulnerable To More Losses
28 Fevereiro 2023 - 2:58AM
NEWSBTC
Ripple is moving lower from the $0.405 resistance zone against the
US Dollar. XRP price is now at a risk of downside break below the
$0.37 support. Ripple is currently moving lower from the $0.4050
resistance zone against the US dollar. The price is now trading
above $0.385 and the 100 simple moving average (4-hours). There is
a key bearish trend line forming with resistance near $0.3780 on
the 4-hours chart of the XRP/USD pair (data source from Kraken).
The pair could recover if there is a clear move above the $0.385
and $0.388 resistance levels. Ripple Price Dips Further This past
week, ripple’s XRP started a fresh decline from the $0.4050
resistance zone against the US Dollar. The price declined below the
$0.395 and $0.392 levels to move into a bearish zone. There was a
drop below the $0.380 level and the 100 simple moving average
(4-hours). A low is formed near $0.3694 and the price is now
consolidating losses. There is a key bearish trend line forming
with resistance near $0.3780 on the 4-hours chart of the XRP/USD
pair. XRP price is now trading above $0.385 and the 100 simple
moving average (4-hours). On the upside, an initial resistance is
near the $0.378 zone and the trend line. The trend line is near the
23.6% Fib retracement level of the downward move from the $0.4086
swing high to $0.3694 low. Source: XRPUSD on TradingView.com The
next key resistance is near the $0.3880 level or the 50% Fib
retracement level of the downward move from the $0.4086 swing high
to $0.3694 low. A successful break above the $0.388 resistance
might send the price towards the $0.400 resistance. Any more gains
might send the price towards the $0.425 level. More Losses in XRP?
If ripple fails to clear the $0.388 resistance zone, it could
continue to move down. An initial support on the downside is near
the $0.370 level. The next major support is near $0.364. If there
is a downside break and close below the $0.364 level, xrp price
could extend losses. In the stated case, the price could even
decline below the $0.332 support. Technical Indicators 4-Hours MACD
– The MACD for XRP/USD is now losing pace in the bearish zone.
4-Hours RSI (Relative Strength Index) – The RSI for XRP/USD is now
below the 50 level. Major Support Levels – $0.370, $0.364 and
$0.332. Major Resistance Levels – $0.384, $0.388 and $0.400.
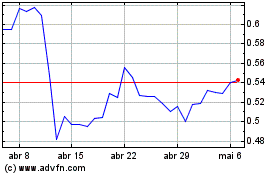
Ripple (COIN:XRPUSD)
Gráfico Histórico do Ativo
De Mar 2024 até Abr 2024

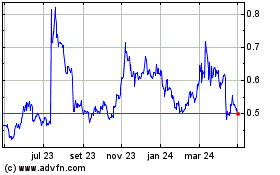
Ripple (COIN:XRPUSD)
Gráfico Histórico do Ativo
De Abr 2023 até Abr 2024
