Avalanche Shows Signs Of Recovery As Key Indicator Flashes A Buy Signal – Details
13 Fevereiro 2025 - 8:00PM
NEWSBTC
Avalanche (AVAX) has faced relentless selling pressure since
mid-December, with its price plummeting over 60% and erasing all
the gains from its impressive November 2024 rally. This sharp
decline has left investors on edge, fueling fear and uncertainty as
Avalanche mirrors the bearish trends seen across the broader crypto
market. Doubts about AVAX’s potential to recover and generate
significant gains have started to dominate market sentiment,
leaving many questioning whether a rebound is possible in the near
term. Related Reading: Cardano Could Move Up To $0.83 If Momentum
Holds – Can ADA Sustain A Breakout? However, amidst this
uncertainty, there are signs that Avalanche may be preparing for a
turnaround. According to key metrics shared by top analyst Ali
Martinez, Avalanche is showing promising signs of a potential
rebound. Martinez highlights that a key technical indicator has
flashed a buy signal on the weekly chart, offering a glimmer of
hope for a recovery rally. This signal suggests that AVAX might be
nearing a bottom, and if market conditions align, it could mark the
beginning of a new bullish phase. As the market remains volatile,
all eyes are on Avalanche to see if this buy signal can translate
into sustained upward momentum. Investors are cautiously
optimistic, hoping that AVAX can overcome current challenges and
reclaim its bullish potential. Avalanche Indicator Signals A
Potential Trend Reversal Avalanche (AVAX) has been stuck in a state
of indecision as bulls fail to reclaim the $27 mark, while bears
struggle to push the price further down. This tug-of-war reflects
the broader uncertainty in the crypto market, leaving Avalanche at
a critical juncture. Analysts are divided on the next move for
AVAX, with some predicting a massive recovery rally while others
anticipate a continuation of the bearish trend that has gripped the
market since mid-December. Top analyst Ali Martinez has added to
the discussion by sharing a technical analysis on X that reveals
promising signs for Avalanche. Martinez highlights that the TD
Sequential indicator, a widely used tool for identifying trend
exhaustion and potential price reversals, has flashed a buy signal
on the weekly chart. This is significant, as weekly signals carry
more weight and often suggest the possibility of long-term
reversals. If bulls capitalize on this signal and push the price
above the $27 resistance level, it could trigger a broader recovery
phase. On the flip side, failure to hold current levels may lead to
further consolidation or downside movement as bears attempt to
regain control. Related Reading: Ethereum Whales Have Bought Over
600,000 ETH In The Past Week – Time For A Price Upswing? The coming
days and weeks will be crucial for Avalanche, as the price action
will either validate the bullish signal or reinforce the prevailing
bearish sentiment. Investors are closely monitoring the $27 level
and the implications of the TD Sequential signal, as it could mark
the beginning of a long-awaited recovery rally for AVAX. AVAX Price
Consolidates Between Key Levels Avalanche (AVAX) is trading at
$25.6 after several days of indecision and consolidation within a
narrow range, stuck below the $27 resistance level and above the
$23 support zone. This tight range reflects the ongoing uncertainty
in the broader market as bulls and bears battle for control. Bulls
face a crucial test at current levels. They need to hold the $25
support zone and build momentum to push AVAX above the key $28.7
resistance level. Breaking and reclaiming this mark as support
would confirm a trend reversal, signaling the start of a potential
recovery rally. A successful breakout above $28.7 could attract
more buyers and lead to a move into higher price levels. However,
selling pressure remains a significant risk for AVAX. If the price
loses the $23 support level, the bearish trend that has dominated
since mid-December could continue. A breakdown below this range
would likely take AVAX into lower demand zones, with $20 being the
next critical support level. Related Reading: Litecoin Approaches
Daily Range Peak – Can LTC Break Multi-Year Highs? The coming days
will be pivotal for Avalanche, as the price must either reclaim
higher levels to change the bearish narrative or risk further
declines as the market grapples with ongoing fear and uncertainty.
Featured image from Dall-E, chart from TradingView
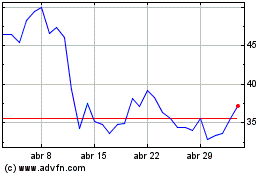
Avalanche (COIN:AVAXUSD)
Gráfico Histórico do Ativo
De Jan 2025 até Fev 2025

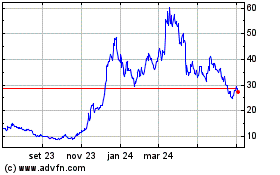
Avalanche (COIN:AVAXUSD)
Gráfico Histórico do Ativo
De Fev 2024 até Fev 2025
