XRP Price About To Make A New All-Time High Run To $5? Here’s What The Chart Says
11 Fevereiro 2025 - 5:00PM
NEWSBTC
The past 24 hours have seen bullish momentum return to XRP, with
the cryptocurrency now reclaiming the $2.5 price level. This
bullish momentum comes after a seven-day stretch of range
consolidation between resistance at $2.5 and support at $2.3.
Despite this consolidation of the price, technical analysis shows
that XRP is still trading in a bullish setup, especially on the
daily candlestick timeframe. Notably, this bullish setup shows that
the XRP price is about to make a new all-time high run to $5.
Bullish RSI Divergence And Strong Support Set The Stage Technical
analysis of the XRP price, which was posted on the TradingView
platform, shows that the cryptocurrency is on the verge of a
maximum surge in the coming weeks. Technical indicators play a
crucial role in this outlook, which is currently bullish, despite
the recent price downturn. Related Reading: XRP Price Breaks
Out Of Symmetrical Triangle Pattern, Why The Target Is $8 One such
technical indicator is the Relative Strength Index (RSI), which
measures momentum in price movements. The RSI, for one, is flashing
a bullish divergence on the daily timeframe. This occurs when the
RSI makes higher lows while price action makes lower lows, which is
a signal of reversal to the upside. Furthermore, technical
analysis shows that despite the price downturn, XRP has managed to
hold above strong support at $2. The ability of XRP to hold above
the support means that the recent selling pressure wasn’t an XRP
price weakness as many expect, but only a consequence of a wider
downturn in the entire crypto market. With the bullish structure
intact and selling pressure appearing to wane, the asset remains in
a strong position for a renewed rally, with a $5 target in sight.
Can XRP Break Its All-Time High And Rally To $5? XRP’s all-time
high remains at $3.40 and has yet to return to this price level
since January 7, 2018. However, the altcoin has been one of the
best performers this cycle, and this all-time high might not stand
for long. In a recent rally, the cryptocurrency surged to $3.36,
only to face sharp rejection from bearish resistance just before
breaking new ground. Related Reading: XRP Price Prediction To $4.9:
How The 1-Day 50 MA Will Drive The Next Wave A move to $5 would not
only mark a new all-time high but also solidify XRP as the best
performer this cycle. The path to this milestone, however, will
require the cryptocurrency to overcome key resistance zones,
particularly around the $2.8 and $3 levels, where selling pressure
has shot up this cycle. At the time of writing, XRP is
trading at $2.51, having increased by about 4.5% in the past 24
hours. If bullish momentum continues to build and XRP successfully
clears these barriers, the projected $5 price target could be
within reach. Featured image from Adobe Stock, chart from
Tradingview.com
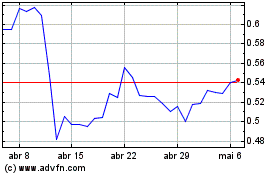
Ripple (COIN:XRPUSD)
Gráfico Histórico do Ativo
De Jan 2025 até Fev 2025

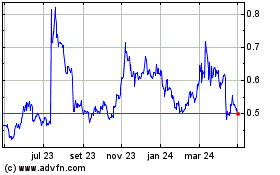
Ripple (COIN:XRPUSD)
Gráfico Histórico do Ativo
De Fev 2024 até Fev 2025
