 BRK.A BRK.A
| Berkshire Hathaway Inc | | 702.613,50 | 118.840,50 | 20,36% | 5.743 |

|
 NVR NVR
| NVR Inc | | 8.016,18 | 900,18 | 12,65% | 20.209 |

|
 TPL TPL
| Texas Pacific Land Corporation | | 1.297,17 | 792,59 | 157,08% | 131.698 |

|
 FICO FICO
| Fair Isaac Inc | | 1.873,56 | 676,22 | 56,48% | 169.212 |

|
 AZO AZO
| AutoZone Inc | | 3.350,21 | 521,58 | 18,44% | 135.433 |

|
 WTM WTM
| White Moutains Insurance Group Ltd | | 1.931,63 | 335,63 | 21,03% | 11.415 |

|
 SPOT SPOT
| Spotify Technology SA | | 548,01 | 332,96 | 154,83% | 2.032.397 |

|
 BH.A BH.A
| Biglari Holdings Inc | | 1.109,91 | 320,96 | 40,68% | 188 |

|
 MKL MKL
| Markel Group Inc | | 1.828,78 | 318,80 | 21,11% | 46.031 |

|
 BLK BLK
| BlackRock Inc | | 1.076,50 | 297,03 | 38,11% | 596.036 |

|
 UI UI
| Ubiquiti Inc | | 403,42 | 275,58 | 215,57% | 77.424 |

|
 TDG TDG
| Transdigm Group Incorporated | | 1.353,34 | 265,77 | 24,44% | 233.374 |

|
 GS GS
| Goldman Sachs Group Inc | | 638,06 | 252,06 | 65,30% | 2.176.232 |

|
 NOW NOW
| ServiceNow Inc | | 1.018,75 | 240,86 | 30,96% | 1.296.254 |

|
 PH PH
| Parker Hannifin Corp |  | 707,05 | 233,19 | 49,21% | 636.458 |

|
 GEV GEV
| GE Vernova Inc | | 369,28 | 226,39 | 158,44% | 3.457.787 |

|
 EME EME
| EMCOR Group Inc | | 450,00 | 219,04 | 94,84% | 442.489 |

|
 FIX FIX
| Comfort Systems USA Inc | | 436,75 | 214,59 | 96,59% | 390.614 |

|
 CVNA CVNA
| Carvana Co | | 246,64 | 203,05 | 465,82% | 4.360.992 |

|
 GPI GPI
| Group 1 Automotive Inc | | 456,49 | 191,49 | 72,26% | 135.546 |

|
 GHC GHC
| Graham Holdings Company | | 929,53 | 187,55 | 25,28% | 15.144 |

|
 TYL TYL
| Tyler Technologies Corp |  | 601,64 | 170,96 | 39,70% | 236.348 |

|
 HUBS HUBS
| HubSpot Inc | | 777,11 | 162,74 | 26,49% | 579.392 |

|
 LLY LLY
| Eli Lilly and Co | | 810,50 | 160,12 | 24,62% | 3.290.046 |

|
 RH RH
| RH | | 418,63 | 157,75 | 60,47% | 715.286 |

|
 GWW GWW
| WW Grainger Inc |  | 1.062,67 | 152,43 | 16,75% | 236.986 |

|
 RDDT RDDT
| Reddit Inc | | 199,00 | 152,00 | 323,40% | 5.178.087 |

|
 LII LII
| Lennox International Inc | | 592,42 | 151,99 | 34,51% | 305.569 |

|
 AMP AMP
| Ameriprise Financial Inc |  | 543,36 | 150,91 | 38,45% | 464.597 |

|
 MUSA MUSA
| Murphy USA Inc | | 504,80 | 149,80 | 42,20% | 191.366 |

|
 MSI MSI
| Motorola Solutions Inc | | 469,25 | 142,67 | 43,69% | 706.545 |

|
 EAT EAT
| Brinker International Inc |  | 182,50 | 141,91 | 349,62% | 1.410.916 |

|
 RCL RCL
| Royal Caribbean Group | | 266,00 | 140,18 | 111,41% | 2.304.554 |

|
 PIPR PIPR
| Piper Sandler Companies |  | 317,50 | 137,30 | 76,19% | 105.102 |

|
 CRS CRS
| Carpenter Technology Corp | | 193,06 | 129,44 | 203,46% | 636.829 |

|
 MTD MTD
| Mettler Toledo International Inc | | 1.364,44 | 124,35 | 10,03% | 128.616 |

|
 VST VST
| Vistra Corp | | 165,15 | 123,80 | 299,40% | 7.195.610 |

|
 URI URI
| United Rentals |  | 760,00 | 120,80 | 18,90% | 535.674 |

|
 CW CW
| Curtiss Wright Corp |  | 346,00 | 119,97 | 53,08% | 240.317 |

|
 CMI CMI
| Cummins Inc | | 356,25 | 114,42 | 47,31% | 1.383.048 |

|
 AXP AXP
| American Express Company | | 316,38 | 113,98 | 56,31% | 2.736.666 |

|
 WSM WSM
| Williams Sonoma | | 211,37 | 111,46 | 111,55% | 1.487.892 |

|
 PWR PWR
| Quanta Services Inc | | 307,61 | 110,36 | 55,95% | 932.902 |

|
 EVR EVR
| Evercore Inc | | 291,27 | 110,20 | 60,86% | 341.506 |

|
 TRGP TRGP
| Targa Resources Corporation | | 196,50 | 109,18 | 125,03% | 1.666.021 |

|
 JLL JLL
| Jones Lang LaSalle Inc | | 282,80 | 105,96 | 59,92% | 288.166 |

|
 TT TT
| Trane Technologies plc | | 362,75 | 105,42 | 40,97% | 1.147.271 |

|
 MA MA
| MasterCard Incorporated | | 555,43 | 104,93 | 23,29% | 2.484.157 |

|
 GDDY GDDY
| GoDaddy Inc | | 212,50 | 103,95 | 95,76% | 1.403.828 |

|
 RL RL
| Ralph Lauren Corporation | | 249,70 | 102,70 | 69,86% | 833.155 |

|
 MCO MCO
| Moodys Corp | | 499,44 | 102,07 | 25,69% | 711.939 |

|
 VMI VMI
| Valmont Industries | | 331,50 | 101,26 | 43,98% | 148.996 |

|
 SAP SAP
| SAP SE | | 276,30 | 100,66 | 57,31% | 816.000 |

|
 MCK MCK
| McKesson Corporation | | 594,75 | 100,01 | 20,21% | 809.535 |

|
 GWRE GWRE
| GuideWire Software Inc | | 211,27 | 97,71 | 86,04% | 809.714 |

|
 GE GE
| GE Aerospace |  | 202,98 | 96,15 | 90,00% | 5.763.812 |

|
 DFS DFS
| Discover Financial Services | | 201,09 | 94,46 | 88,59% | 1.539.178 |

|
 GRMN GRMN
| Garmin Ltd |  | 215,85 | 93,99 | 77,13% | 849.970 |

|
 TSM TSM
| Taiwan Semiconductor Manufacturing Co Ltd | | 207,50 | 93,96 | 82,75% | 15.438.995 |

|
 WSO.B WSO.B
| Watsco Inc | | 484,25 | 92,37 | 23,57% | 61 |

|
 AGX AGX
| Argan Inc | | 136,60 | 91,30 | 201,55% | 213.737 |

|
 GTLS GTLS
| Chart Industries Inc | | 211,59 | 90,39 | 74,58% | 653.393 |

|
 JPM JPM
| JP Morgan Chase and Co | | 266,34 | 90,14 | 51,16% | 8.953.133 |

|
 CLS CLS
| Celestica Inc | | 123,00 | 90,07 | 273,52% | 2.407.733 |

|
 AYI AYI
| Acuity Brands Inc | | 332,05 | 89,95 | 37,15% | 258.185 |

|
 WAT WAT
| Waters Corp | | 415,48 | 87,94 | 26,85% | 441.521 |

|
 BOOT BOOT
| Boot Barn Holdings Inc |  | 161,50 | 87,62 | 118,60% | 743.641 |

|
 DKS DKS
| Dicks Sporting Goods Inc | | 240,52 | 87,44 | 57,12% | 1.099.281 |

|
 XYZ XYZ
| Block Inc | | 90,239 | 87,24 | 2.907,97% | 146.508 |

|
 BURL BURL
| Burlington Stores Inc | | 283,93 | 87,00 | 44,18% | 871.981 |

|
 CAVA CAVA
| CAVA Group Inc | | 134,02 | 86,44 | 181,67% | 2.805.687 |

|
 KAI KAI
| Kadant Inc | | 372,79 | 86,43 | 30,18% | 86.474 |

|
 WSO WSO
| Watsco Inc | | 478,21 | 83,75 | 21,23% | 263.063 |

|
 SE SE
| Sea Limited | | 121,02 | 82,72 | 215,98% | 4.944.160 |

|
 ABG ABG
| Asbury Automotive Group Inc | | 296,68 | 81,73 | 38,02% | 187.762 |

|
 TDY TDY
| Teledyne Technologies Inc |  | 511,33 | 81,58 | 18,98% | 241.738 |

|
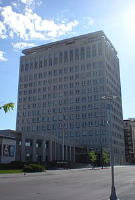 BRK.B BRK.B
| Berkshire Hathaway Inc |  | 468,00 | 80,60 | 20,81% | 3.690.473 |

|
 HUBB HUBB
| Hubbell Incorporated |  | 423,01 | 80,60 | 23,54% | 441.487 |

|
 IT IT
| Gartner Inc | | 542,83 | 80,28 | 17,36% | 379.290 |

|
 DE DE
| Deere and Co | | 476,56 | 79,24 | 19,94% | 1.416.420 |

|
 KKR KKR
| KKR and Company Inc | | 167,02 | 79,15 | 90,08% | 4.184.784 |

|
 MTZ MTZ
| MasTec Inc | | 145,09 | 78,04 | 116,39% | 846.127 |

|
 ETN ETN
| Eaton Corp New |  | 326,44 | 77,68 | 31,23% | 2.230.806 |

|
 AIT AIT
| Applied Industrial Technologies Inc | | 260,03 | 77,35 | 42,34% | 296.877 |

|
 LAD LAD
| Lithia Motors Inc | | 376,09 | 76,81 | 25,66% | 276.605 |

|
 ARES ARES
| Ares Management Corporation | | 197,80 | 75,87 | 62,22% | 1.160.297 |

|
 RACE RACE
| Ferrari NV | | 428,52 | 75,41 | 21,36% | 268.773 |

|
 WAB WAB
| Wabtec Corp | | 207,92 | 74,96 | 56,38% | 1.076.393 |

|
 LRN LRN
| Stride Inc | | 135,00 | 74,66 | 123,73% | 820.679 |

|
 RBC RBC
| RBC Bearings Incorporated |  | 349,00 | 74,20 | 27,00% | 149.204 |

|
 DY DY
| Dycom Industries Inc | | 189,16 | 74,17 | 64,50% | 330.812 |

|
 BH BH
| Biglari Holdings Inc | | 232,01 | 74,09 | 46,92% | 4.319 |

|
 FI FI
| Fiserv Inc | | 216,04 | 73,87 | 51,96% | 2.506.032 |

|
 APD APD
| Air Products and Chemicals Inc | | 334,59 | 73,49 | 28,15% | 1.580.172 |

|
 DDS DDS
| Dillards Inc | | 468,11 | 73,17 | 18,53% | 122.629 |

|
 TWLO TWLO
| Twilio Inc |  | 145,00 | 72,79 | 100,80% | 2.786.738 |

|
 AON AON
| Aon PLC |  | 370,82 | 71,66 | 23,95% | 1.136.724 |

|
 AJG AJG
| Arthur J Gallagher and Company | | 301,82 | 70,39 | 30,42% | 1.090.845 |

|
 TKO TKO
| Tko Group Holdings Inc |  | 155,21 | 70,21 | 82,60% | 951.533 |

|
 HWM HWM
| Howmet Aerospace Inc | | 126,05 | 70,07 | 125,17% | 2.799.559 |

|


 Recursos principais


